Cost Function

K-Means에서 최소화하려는 cost function은 위와같다.
각 점에서 Centroid 까지의 거리를 최소화 하는 것이다.

이 함수 를 다른말로는 distortion function 이라 부른다. 알고리즘을 다시 보면
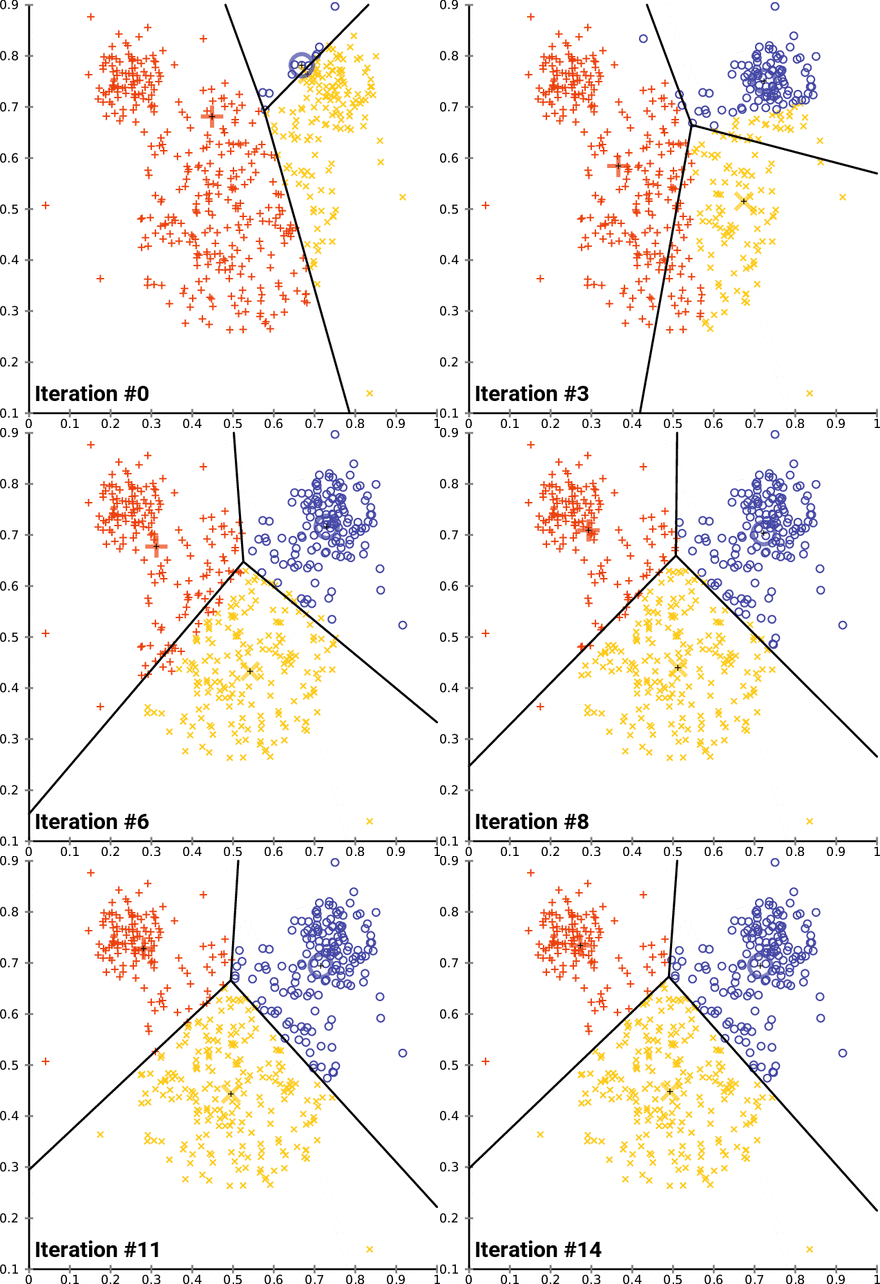
- clustering assignment step 에서는 를 고정시키고 에 대해서 를 최소화 한다.
- move centroid step 에서는 를 고정시키고 에 대해서 를 최소화 한다.
N-차원의 데이터에 대하여
- K(n_components)개의 랜덤한 데이터를 Cluster의 중심점으로 설정
- 해당 Cluster에 근접해있는 데이터를 Cluster로 할당
- 변경된 Cluster에 대하여 중심점을 새로 계산
- 더이상의 변화가 없을 때 까지 2~3 반복

실습!
import pandas as pd
import matplotlib.pyplot as plt
from sklearn.datasets import make_blobs
'''4개의 중심점(클러스터)를 가진 column 2개 짜리 데이터 100행'''
x, y = make_blobs(n_samples = 100, centers = 4, n_features = 2)
df = pd.DataFrame(dict(x = x[:, 0], y = x[:, 1], label = y))
colors = {0 : '#eb4d4b', 1 : '#4834d4', 2 : '#6ab04c', 3:'y'}
fig, ax = plt.subplots()
grouped = df.groupby('label')
for key, group in grouped:
    group.plot(ax = ax, kind = 'scatter', x = 'x', y = 'y', label = key, color = colors[key])
plt.show()
df.head()
points = df.drop('label', axis = 1) # label 삭제
points.head()
dataset_centroid_x = points.x.mean()
dataset_centroid_y = points.y.mean()
print(dataset_centroid_x, dataset_centroid_y)
#
ax.plot(points.x, points.y)
ax = plt.subplot(1,1,1)
ax.scatter(points.x, points.y)
ax.plot(dataset_centroid_x, dataset_centroid_y, "or")
plt.show()
랜덤한 포인트를 cluster의 centroid로 지정
centroids = points.sample(3)
centroids
클러스터의 라벨을 지정
import math
import numpy as np
from scipy.spatial import distance
def find_nearest_centroid(df, centroids, iteration):
  #포인트와 centroid 간의 거리 계산
  distances = distance.cdist(df, centroids, 'euclidean')
  #제일 근접한 centroid 선택
  nearest_centroids = np.argmin(distances, axis = 1)
  #cluster 할당
  se = pd.Series(nearest_centroids)
  df['cluster_' + iteration] = se.values
  return df
#\\
first_pass = find_nearest_centroid(points.select_dtypes(exclude='int64'), centroids, '1')
first_pass.head()
가상 cluster에 대해, centroid 를 계산, 새로운 센터로 대체
def get_centroids(df, column_header):
  new_centroids = df.groupby(column_header).mean()
  return new_centroids
#
centroids = get_centroids(first_pass, 'cluster_1')
centroids
cluster 별 scatter plot 그려보기
def plot_clusters(df, column_header, centroids):
  colors = {0 : 'red', 1 : 'cyan', 2 : 'yellow'}
  fig, ax = plt.subplots()
  ax.plot(centroids.iloc[0].x, centroids.iloc[0].y, "ok") # 기존 중심점
  ax.plot(centroids.iloc[1].x, centroids.iloc[1].y, "ok")
  ax.plot(centroids.iloc[2].x, centroids.iloc[2].y, "ok")
  grouped = df.groupby(column_header)
  for key, group in grouped:
      group.plot(ax = ax, kind = 'scatter', x = 'x', y = 'y', label = key, color = colors[key])
  plt.show()
\
plot_clusters(first_pass, 'cluster_1', centroids)
이제 센터지정, 라벨링, 센터바꾸기 과정을 계속 반복하면된다!
# 변경된 cluster에 대해 centroid 계산
centroids = get_centroids(first_pass,'cluster_1')
second_pass = find_nearest_centroid(first_pass
              .select_dtypes(exclude='int64')
                , centroids, '2')
plot_clusters(second_pass, 'cluster_2', centroids)
또 다시 센터바꾸기!
centroids = get_centroids(second_pass,
                          'cluster_2')
third_pass = find_nearest_centroid(
    second_pass.select_dtypes(exclude='int64'),
    centroids, '3')
plot_clusters(third_pass, 'cluster_3', centroids)
워후..;; 이대로 쭉 계속 하면서
# 유의미한 차이가 없을 때 까지 반복, 이번 경우에는 전체 cluster에 변화가 없는 것을 기준으로 하겠습니다.
convergence = np.array_equal(fifth_pass['cluster_5'], sixth_pass['cluster_6'])
convergence
유의미한 차이가 없어질떄까지만 돌리면 된다!
코드참조 (DS진환님....)
sklearn 을 활용하기
from sklearn.cluster import KMeans
inertias=[]
for k in range(1,10):
    kmeans = KMeans(n_clusters=k).fit(stdf)
    inertias.append(kmeans.inertia_)
plt.figure()
plt.grid()
plt.plot(range(1,10),inertias)
plt.xlabel("Number of cluster")
plt.ylabel("inertias")
plt.show()
일단 이녀석도 먼저 내가 클러스터값을 알고있지않는다면 scree plot 그렸던것처럼 그려보고 하는게 좋다!
왜냐? 이것도 비지도학습의 일종이랬다;..
그래서 만약 내가 라벨링된 데이터를 알고있지않다면, cluster를 예측해보고 진행하는게 훨~~~씬 좋을거다 이말이다
일단, cluster의 개수를 아직 단정지을 수 없는 상황이라면, PCA에서 Scree plot 그렸던 것 처럼, 여기도 그려본다.
from sklearn.cluster import KMeans
inertias=[]
for k in range(1,10):
    kmeans = KMeans(n_clusters=k).fit(dfno)
    inertias.append(kmeans.inertia_)
plt.figure()
plt.grid()
plt.plot(range(1,10),inertias)
plt.xlabel("Number of cluster")
plt.ylabel("inertias")
plt.show()
대략 2개 또는 3개를 선택하면 될 거 같다.
지금 예시로 사용한 데이터는 diagnosis 데이터로, 악성종양 vs 양성종양 이렇게 두가지의 label이 존재하므로 n_cluster를 2로 하겠다.
dfno = df.drop(['diagnosis','id'], axis=1)
model = KMeans(n_clusters=2, random_state=0).fit(dfno)
dfno['cluster']=model.labels_
dfno['diagnosis']=dflabel
dfno
기존 데이터프레임에 함친 후 scatter plot을 그려보면 잘 되었는 지 확인할 수 있는것이다.
sns.scatterplot(data=dfno,
               x='concave points_worst',
               y='perimeter_worst',
               hue='diagnosis')
sns.scatterplot(data=dfno,
                 x='concave points_worst',
                 y='perimeter_worst',
                 hue='cluster')
여기서, 몇개의 라벨이 맞게 되었는지 확인하기위해서는 간단하게 함수하나만 만들어 계산하면된다.
def check(x):
    if x['cluster']==0 and x['diagnosis']=='M' or x['cluster']==1 and x['diagnosis']=='B' : return 1
    else: return 0
dfcluster['isRight']=dfcluster.apply(lambda x : check(x), axis=1)
print(f'Accuracy : {sum(dfcluster.isRight) / len(dfcluster.isRight)}')
Accuracy : 0.8541300527240774
85%가 맞았다구한당. . .


