
들어가며
이번 글에서는 현대 모니터링 스택의 표준인 Prometheus와 Grafana를 활용하여 Kubernetes 환경의 MSA 서비스들을 효과적으로 모니터링하는 방법을 알아보겠습니다.
Prometheus란?
Prometheus는 SoundCloud에서 개발한 오픈소스 모니터링 시스템으로, 현재 CNCF(Cloud Native Computing Foundation)의 졸업 프로젝트입니다. 시계열 데이터베이스를 기반으로 메트릭을 수집, 저장, 조회할 수 있는 강력한 모니터링 도구입니다.
Prometheus의 핵심 특징
Pull 기반 메트릭 수집
다른 모니터링 시스템과 달리 Prometheus는 타겟 애플리케이션에서 메트릭을 주기적으로 가져오는(Pull) 방식을 사용합니다. 이를 통해 네트워크 문제나 서비스 장애 시에도 안정적으로 동작합니다.
Service Discovery
Kubernetes, Consul, EC2 등 다양한 환경에서 자동으로 모니터링 대상을 발견하고 추가할 수 있어 동적 환경에 최적화되어 있습니다.
PromQL (Prometheus Query Language)
강력한 쿼리 언어를 통해 복잡한 메트릭 분석과 알림 조건을 정의할 수 있습니다.
Alerting
Alertmanager와 연동하여 임계값 초과 시 다양한 채널(Slack, Email, PagerDuty 등)로 알림을 발송할 수 있습니다.
Prometheus 아키텍처
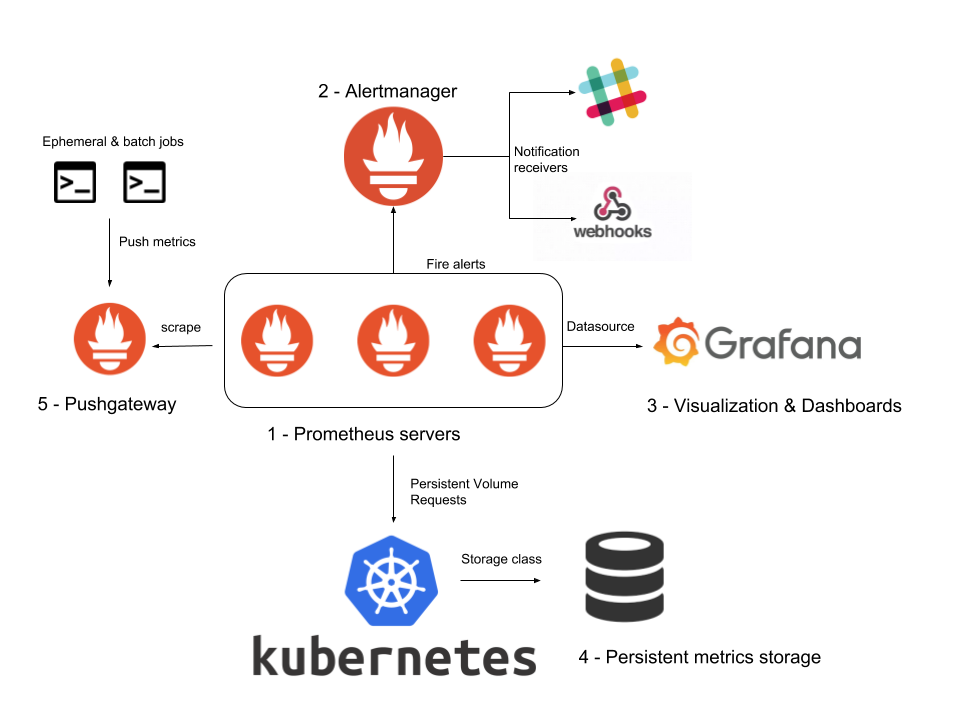
Prometheus Server
- 메트릭 수집 및 저장
- PromQL 쿼리 처리
- 알림 규칙 평가
Alertmanager
- 알림 라우팅, 그룹핑, 중복 제거
Exporters
- 다양한 시스템의 메트릭을 Prometheus 형식으로 변환
- Node Exporter (시스템 메트릭), MySQL Exporter (DB 메트릭) 등
Pushgateway
- 단기 실행 Job이나 Batch 작업의 메트릭 수집
Grafana란?
Grafana는 메트릭 데이터를 시각화하는 오픈소스 대시보드 플랫폼입니다. Prometheus뿐만 아니라 InfluxDB, MySQL, PostgreSQL 등 다양한 데이터 소스를 지원하여 통합 모니터링 대시보드를 구성할 수 있습니다.
Grafana의 주요 기능
다양한 시각화 옵션
- 그래프, 게이지, 히트맵, 테이블 등 다양한 차트 타입
- 실시간 데이터 업데이트
- 반응형 대시보드
템플릿 변수
- 동적 대시보드 생성
- 드롭다운을 통한 필터링
- 환경별, 서비스별 대시보드 전환
알림 기능
- 시각적 알림과 이메일, Slack 연동
- 알림 규칙 관리
- 알림 히스토리
대시보드 공유
- 팀 간 대시보드 공유
- 스냅샷 생성
- 임베드 기능
Prometheus + Grafana 조합의 장점
완벽한 모니터링 스택
- Prometheus: 데이터 수집 및 저장
- Grafana: 시각화 및 알림
- 서로 완벽하게 호환되는 조합
클라우드 네이티브
- Kubernetes 환경에 최적화
- 컨테이너 기반 배포 지원
- Auto-discovery 기능
확장성
- 대규모 메트릭 처리 가능
- 수평적 확장 지원
- 플러그인 생태계
Prometheus와 Grafana 설치
1단계: Helm을 통한 설치
# Prometheus와 Grafana 설치
helm repo add prometheus-community https://prometheus-community.github.io/helm-charts
helm repo update
helm install prometheus prometheus-community/kube-prometheus-stack --namespace monitoring --create-namespace
kube-prometheus-stack에 포함된 구성요소
- Prometheus Server
- Grafana
- Alertmanager
- Node Exporter
- Kube State Metrics
- Prometheus Operator
2단계: 서비스 외부 노출
# Grafana 서비스를 LoadBalancer로 변경
kubectl patch svc prometheus-grafana -n monitoring -p '{"spec": {"type": "LoadBalancer"}}'

# Prometheus 서비스도 LoadBalancer로 변경
kubectl patch svc prometheus-kube-prometheus-prometheus -n monitoring -p '{"spec": {"type": "LoadBalancer"}}'

# 서비스 상태 확인
kubectl get svc -n monitoring prometheus-grafana prometheus-kube-prometheus-prometheus
3단계: Grafana 접속 정보 확인
# Grafana 관리자 패스워드 확인
kubectl get secret prometheus-grafana -n monitoring -o jsonpath="{.data.admin-password}" | base64 -d

# 결과: prom-operator
접속 정보
- URL:
http://공인IP:포트번호 - 사용자명:
admin - 비밀번호:
prom-operator
MSA 애플리케이션 모니터링 설정
1단계: Spring Boot 애플리케이션 메트릭 설정
의존성 추가 (build.gradle)
// Prometheus 메트릭 수집을 위한 의존성
implementation 'org.springframework.boot:spring-boot-starter-actuator'
implementation 'io.micrometer:micrometer-registry-prometheus'
애플리케이션 설정 (application.yml)
# Prometheus 설정 추가
management:
  endpoints:
    web:
      exposure:
        include: health,info,prometheus
  endpoint:
    prometheus:
      enabled: true
  metrics:
    export:
      prometheus:
        enabled: true
    tags:
      application: ${spring.application.name}
2단계: Spring Security 설정 수정
@Configuration
public class SecurityConfig {

    @Bean
    public SecurityFilterChain filterChain(HttpSecurity http) throws Exception {
        http
            .authorizeHttpRequests(authorize -> authorize
                .requestMatchers("/actuator/**").permitAll() // actuator 엔드포인트 허용
                // 나머지 설정
            );
        return http.build();
    }
}
3단계: 서비스 포트 고정
랜덤 포트에서 고정 포트로 변경
# auth-service.yml
server:
  port: 8081

# user-service.yml
server:
  port: 8082

# health-service.yml
server:
  port: 8083
# 방화벽 설정
sudo ufw allow 8081 # auth-service
sudo ufw allow 8082 # user-service
sudo ufw allow 8083 # health-serviceServiceMonitor 설정
ServiceMonitor란?
Prometheus Operator가 사용하는 CRD(Custom Resource Definition)로, Prometheus가 어떤 서비스의 메트릭을 수집할지 정의합니다.
1단계: ServiceMonitor 생성
sudo vi msa-service-monitor.yamlapiVersion: monitoring.coreos.com/v1
kind: ServiceMonitor
metadata:
name: msa-service-monitor
namespace: monitoring
labels:
release: prometheus
spec:
selector:
matchLabels:
app.kubernetes.io/part-of: msa
namespaceSelector:
matchNames:
- msa-apps
endpoints:
- port: http
path: /actuator/prometheus
interval: 15s# ServiceMonitor 적용
kubectl apply -f msa-service-monitor.yaml2단계: 서비스 레이블 및 포트 설정
# 서비스에 필요한 레이블 추가
kubectl label service auth-service config-service user-service health-service gateway-service eureka-service -n msa-apps app.kubernetes.io/part-of=msa

# 서비스 포트 이름을 http로 수정
kubectl patch svc auth-service -n msa-apps --type='json' -p='[{"op": "replace", "path": "/spec/ports/0/name", "value": "http"}]'
kubectl patch svc user-service -n msa-apps --type='json' -p='[{"op": "replace", "path": "/spec/ports/0/name", "value": "http"}]'
kubectl patch svc health-service -n msa-apps --type='json' -p='[{"op": "replace", "path": "/spec/ports/0/name", "value": "http"}]'
kubectl patch svc gateway-service -n msa-apps --type='json' -p='[{"op": "replace", "path": "/spec/ports/0/name", "value": "http"}]'
kubectl patch svc config-service -n msa-apps --type='json' -p='[{"op": "replace", "path": "/spec/ports/0/name", "value": "http"}]'
kubectl patch svc eureka-service -n msa-apps --type='json' -p='[{"op": "replace", "path": "/spec/ports/0/name", "value": "http"}]'
모니터링 대시보드 구성
1단계: Prometheus 타겟 확인
Prometheus UI 접속: http://공인IP:9090
- Status > Targets 메뉴 이동
- ServiceMonitor로 추가한 MSA 서비스들 확인
- 모든 타겟이 UP 상태인지 확인
2단계: Grafana 데이터 소스 설정
Grafana 접속: http://공인IP:32575
- 왼쪽 상단 메뉴 클릭
- Data Sources 클릭
- Add New data source 클릭
- Prometheus 선택
- 설정 정보 입력:
- Name: 원하는 이름
- Connection:
http://공인IP:9090(Prometheus URL)
- Save & Test 클릭
3단계: 대시보드 Import
추천 대시보드 ID
- Spring Boot 3.x: 19004 (Spring Boot 애플리케이션 통계)
- JVM 메트릭: 4701 (JVM 모니터링)
- Node 모니터링: 1860 (Node Exporter Full)
Import 과정
1. Import Dashboard 클릭
2. 대시보드 ID 입력 후 Load
3. Prometheus 데이터 소스 선택
4. Import 클릭
주요 모니터링 메트릭
애플리케이션 메트릭
- HTTP 요청 수:
http_server_requests_total - 응답 시간:
http_server_requests_seconds - 에러율:
http_server_requests_total{status=~"4..|5.."} - 활성 스레드:
jvm_threads_live_threads
JVM 메트릭
- 힙 메모리 사용량:
jvm_memory_used_bytes{area="heap"} - GC 시간:
jvm_gc_pause_seconds - 클래스 로딩:
jvm_classes_loaded_classes
시스템 메트릭
- CPU 사용률:
system_cpu_usage - 메모리 사용률:
system_memory_usage - 디스크 I/O:
system_disk_io_bytes
마치며
Prometheus와 Grafana를 활용한 모니터링 시스템은 MSA 환경에서 필수적인 인프라입니다. 실시간 메트릭 수집과 시각화를 통해 시스템의 상태를 정확히 파악하고, 문제 발생 시 빠르게 대응할 수 있습니다.