이번 프로젝트에서는 모니터링 부분을 구현해보고 응용해보고자 하여 모니터링 파트를 지속적으로 포스팅하고자 한다. (하고자 노력한다 ㅎㅎ)
1. Prometheus 란?
Prometheus는 메트릭 수집, 시각화, 알림, 서비스 디스커버리 기능을 모두 가지고 있는 오픈소스 기반의 모니터링 시스템이다.
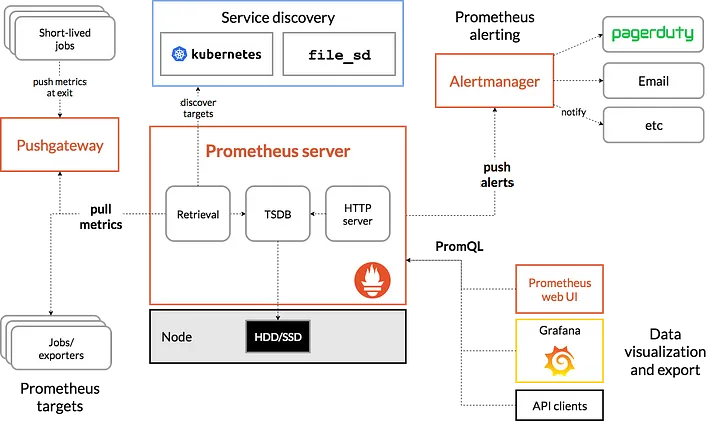
Prometheus의 아키텍처는 위와 같다.
좌측 하단의 Jobs/exporter는 실제로 메트릭을 수집하는 프로세스이다.
이 exporter에서 /metrics 라는 HTTP 엔드포인트를 통해 다양한 메트릭을 가져갈 수 있게 해준다.
그러면 Prometheus Server가 HTTP GET 요청을 날려 풀(Pull) 방식으로 메트릭을 가져온다.
이를 Alertmanager를 통해 알림 서비스와 연계하여, CPU 사용량이 많아지면 슬랙에 알람을 보낸다거나하는 기능을 구현할 수 있다.
Prometheus에서도 간단한 웹 뷰를 통해 메트릭을 조회할 수 있지만 "Grafana"와 같은 Data Visualization Tool을 사용하여 시각화 하고 있다.
💡 실제로 Prometheus + Grafana 의 조합이 가장 일반적이라고 할 수 있다.
Prometheus는 prometheus.yml 파일을 통해 기본적인 설정을 한다.
prometheus.yml 파일의 예시는 아래와 같다.
global:
  scrape_interval: 15s
  scrape_timeout: 15s
  evaluation_interval: 2m
  external_labels:
    monitor: 'codelab-monitor'
  query_log_file: query_log_file.log
rule_files:
  - "rule.yml"
scrape_configs:
  - job_name: 'prometheus'
    scrape_interval: 10s
    scrape_timeout: 10s
    metrics_path: '/metrics'
    honor_labels: false
    honor_timestamps: false
    scheme: 'http'
    params:
      user-id: ['kyoungsuk3254@naver.com']
    static_configs:
      - targets: ['{본인 IP주소}:9090']
        labels:
          service: 'monitor-1'
  - job_name: 'node'
    static_configs:
      - targets: ['{본인 IP주소}:9100']
크게 global, rule_files, scrape_config 로 나눌 수 있는데, 하나하나 살펴보겠다.
1. global
: 기본적인 전역 설정이다.
scrape_interval (메트릭을 수집할 간격), scrape_timeout (메트릭을 수집할 때 이 시간을 넘어서면 timeout이라고 간주), query_log_file의 이름 등등을 설정할 수 있다.
2. rule_files
: 규칙을 처음 한번 로딩하고, evaluation_interval 설정에 따라 정기적으로 규칙을 평가한다.
(인스턴스가 down 되었는지, API latency가 너무 높다던지,, 등등을 설정하면 interval마다 평가)
groups:
  - name: example
    rules:
      - alert: InstanceDown
        expr: up == 0
        for: 5m
        labels:
          severity: page
        annotations:
          summary: "Instance {{ $labels.instance }} down"
          description: "{{ $labels.instance }} of job {{ $labels.job }} has been down for more than 5 minutes."
      - alert: APIHighRequestLatency
        expr: api_http_request_latencies_second{quantile="0.5"} > 1
        for: 10m
        annotations:
          summary: "High request latency on {{ $labels.instance }}"
          description: "{{ $labels.instance }} has a median request latency above 1s (current value: {{ $value }}s)"
3. scrape_config
: 구체적으로 어디에서 메트릭을 수집할 지 정의하는 부분이다.
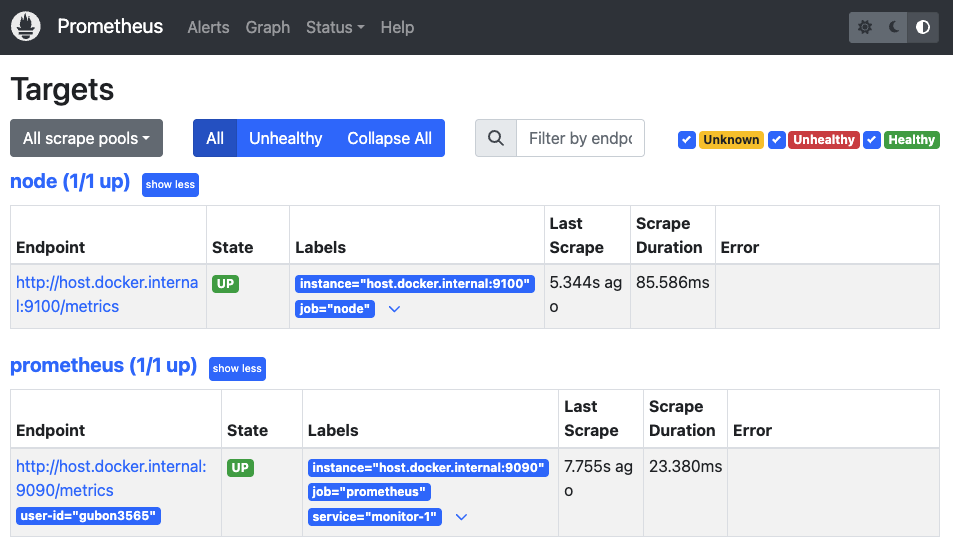
9090포트는 프로메테우스 자신을 뜻하고, 9100은 후에 다운받을 node-exporter에 해당한다.
이렇게 파일을 작성해서 docker run 하면, 정상적으로 Prometheus가 동작하는 것을 확인할 수 있다.

좋은 글 감사합니다!