
🔑Summarization
- Python package - Seaborn basic
📗Contents
설치
pip install seabornModule Load
import matplotlib.pyplot as plt
import numpy as np
import seaborn as sns

# matplotlib inline
get_ipython().run_line_magic('matplotlib', 'inline')
기본 형태
- 데이터 생성
sns.set_style('white')
plt.figure(figsize = (10, 6))
plt.plot(x, y1, x, y2, x, y3, x, y4)
sns.despine()
plt.show()- Plot
x = np.linspace(0, 14, 100)
y1 = np.sin(x)
y2 = 2 * np.sin(x + 0.5)
y3 = 3 * np.sin(x + 1.0)
y4 = 4 * np.sin(x + 1.5)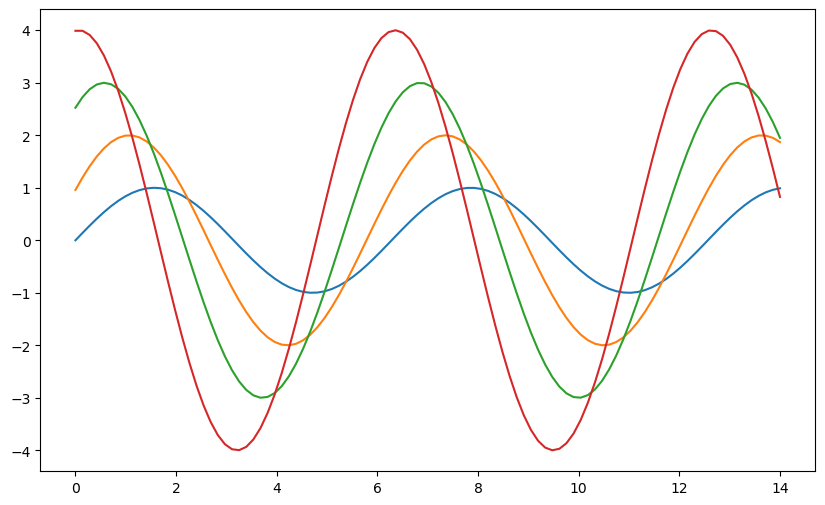
Set style
plt.figure(figsize = (10, 6))
plt.plot(x, y1, x, y2, x, y3, x, y4)
plt.show()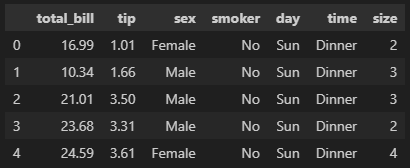
Boxplot
data : seaborn 내장 실습 데이터
tips = sns.load_dataset('tips')
tips.head()plt.figure(figsize = (8, 6))
sns.boxplot(x = tips['total_bill'])
plt.show()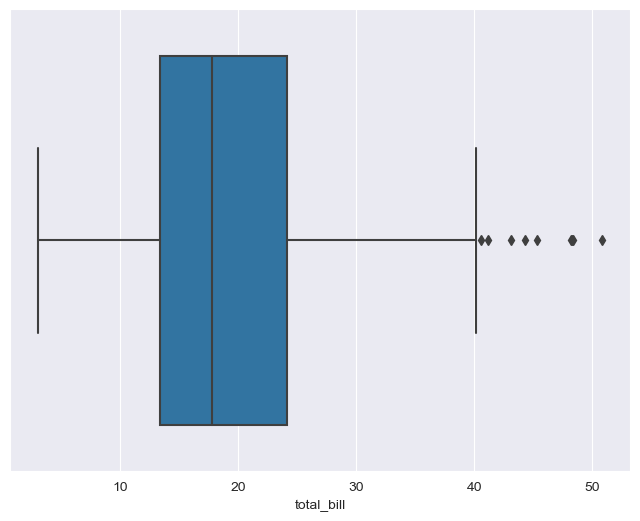
plt.figure(figsize = (8, 6))
sns.boxplot(x = 'day', y = 'total_bill', data = tips)
plt.show()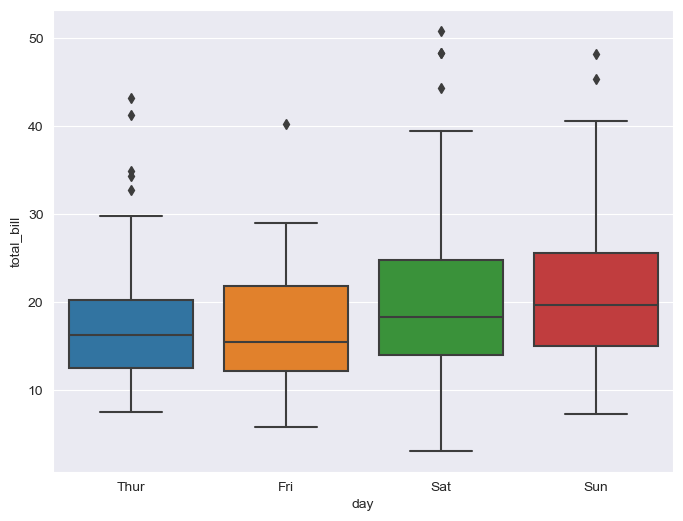
- palette : 색상지정
- hue : 범례
plt.figure(figsize = (8, 6))
sns.boxplot(x = 'day', y = 'total_bill', hue = 'smoker', data = tips, palette= 'Set3')
plt.show()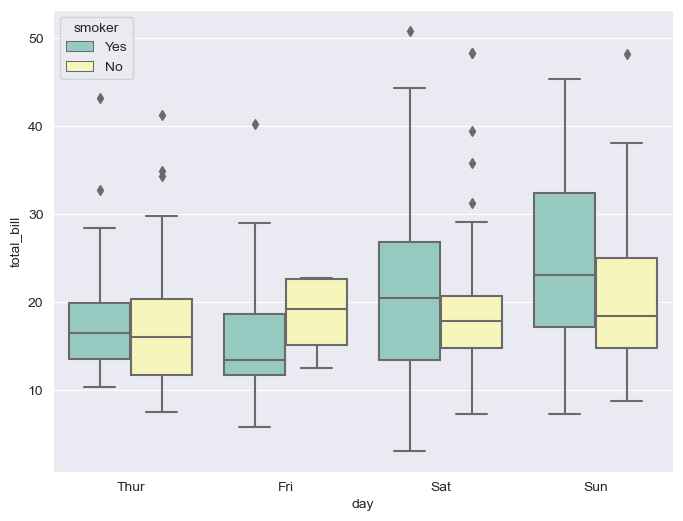
swarmplot
plt.figure(figsize = (8, 6))
sns.swarmplot(x = 'day', y = 'total_bill', hue = 'smoker', data = tips)
plt.show()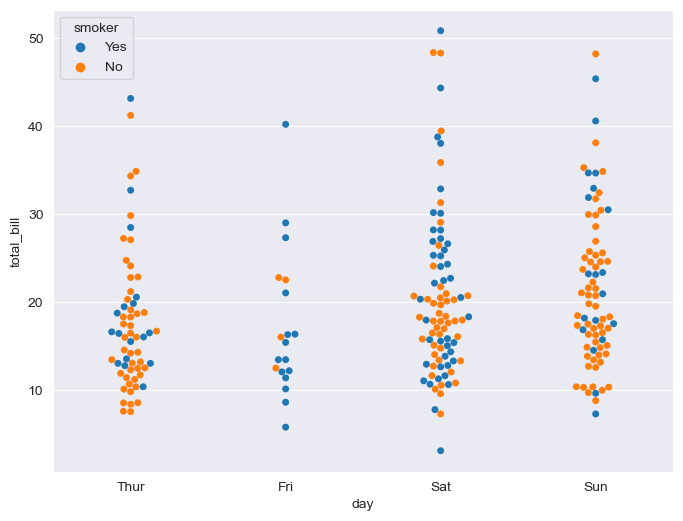
lmplot
- 흐린 영역이 좁을수록 강한 상관관계
sns.lmplot(x = 'total_bill', y = 'tip', data = tips)
plt.show()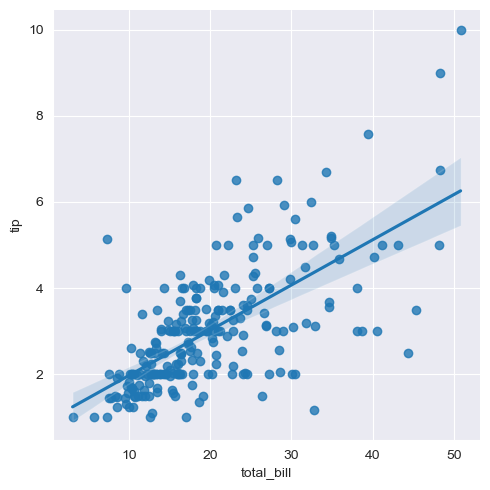
sns.lmplot(x = 'total_bill', y = 'tip', hue = 'smoker', data = tips)
plt.show()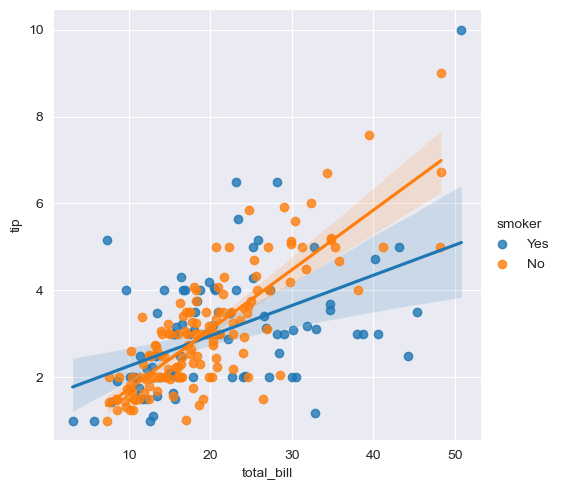
heatmap
Data
flights = sns.load_dataset('flights')
flights.head()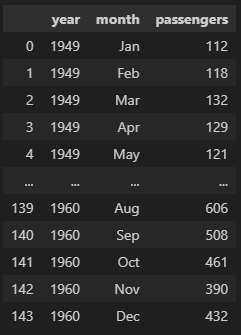
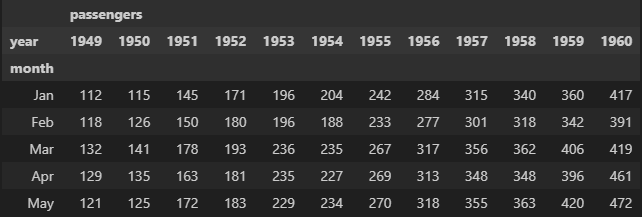
flights = flights.pivot(index = ['month'], columns=['year'], values=['passengers'])
flights.head()- annot : 내부에 값 넣을지 여부 # True : 넣어줌
- fmt : 포맷 # d : 정수형
- cmap : 컬러맵
plt.figure(figsize = (10, 6))
sns.heatmap(flights, annot = True, fmt = 'd')
plt.show()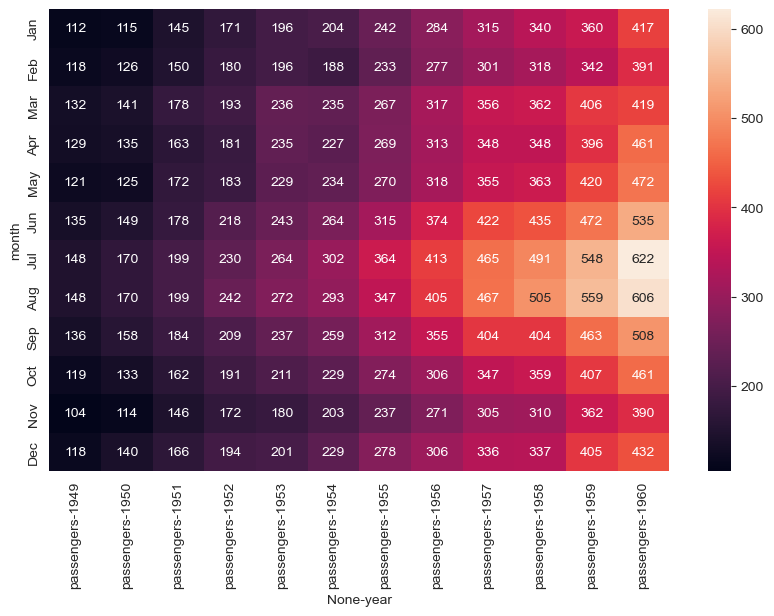
plt.figure(figsize = (10, 6))
sns.heatmap(flights, annot = True, fmt = 'd', cmap = 'YlGnBu')
plt.show()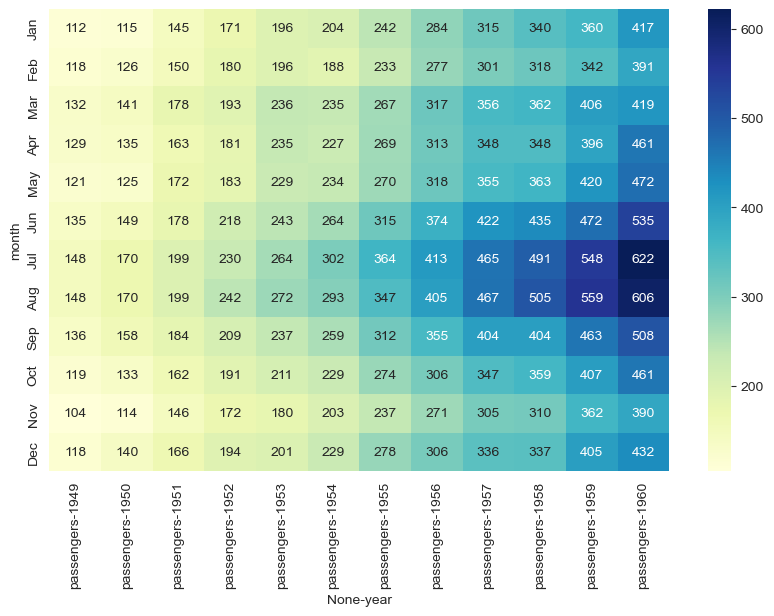
IRIS data
data
sns.set(style = 'ticks')
iris = sns.load_dataset('iris')
iris.head()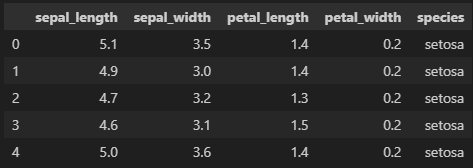
- 특성별 상관관계 즉시 파악
sns.pairplot(iris)
plt.show()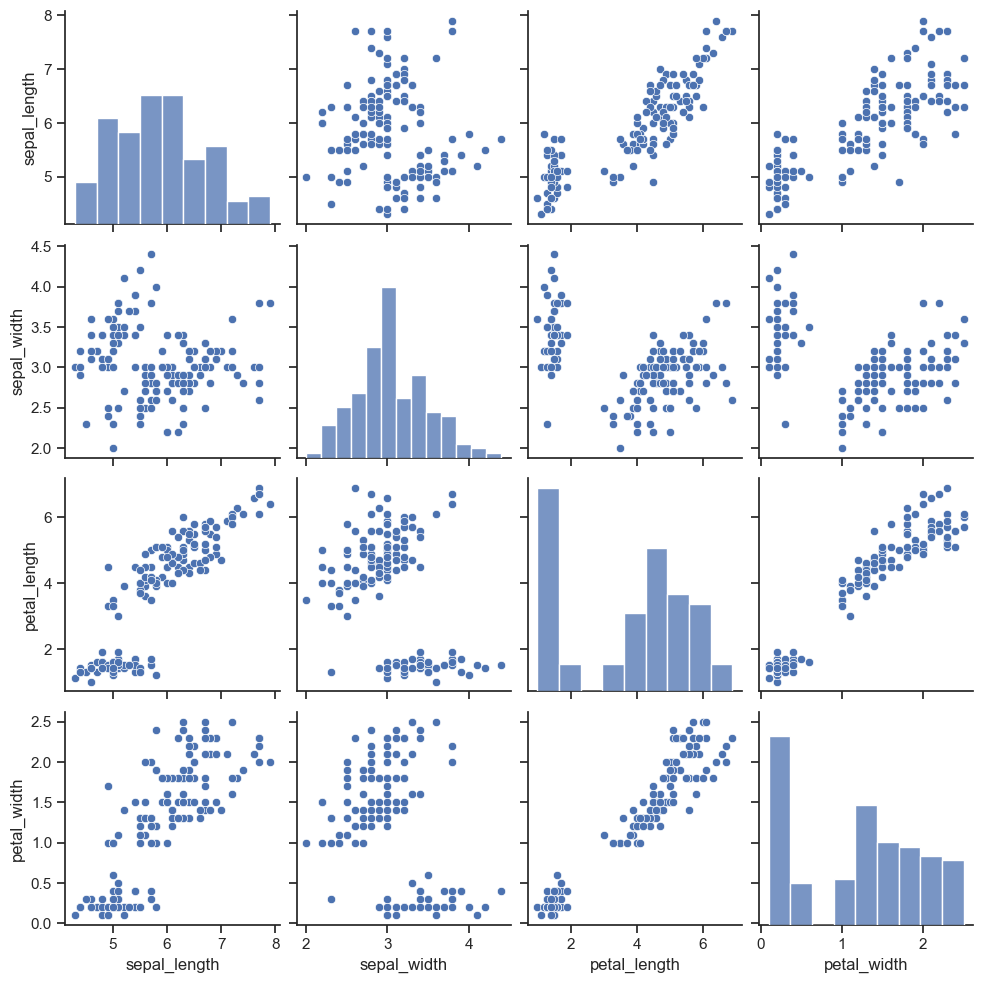
sns.pairplot(iris, hue = 'species') # 특성별 상관관계 즉시 파악
plt.show()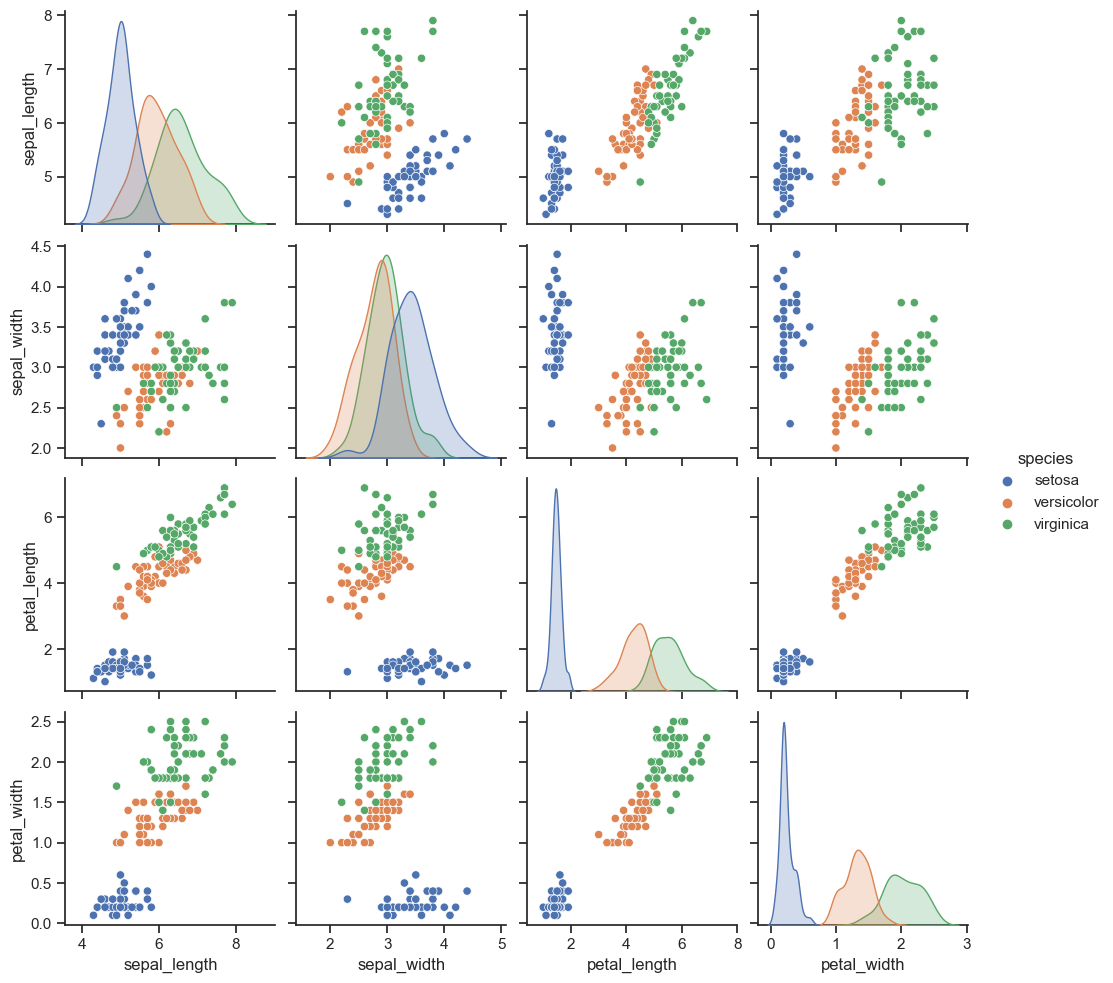
- 원하는 컬럼만 pairplot 가능
sns.pairplot(iris, x_vars = ['sepal_width', 'sepal_length'], y_vars = ['petal_width', 'petal_length'], hue = 'species') # 특성별 상관관계 즉시 파악
plt.show()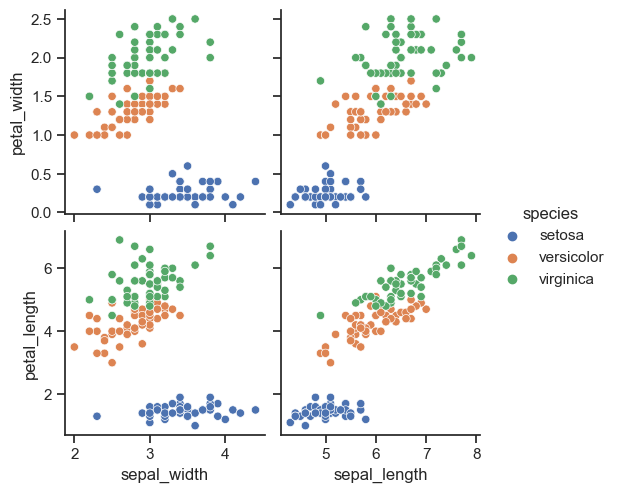
anscombe
Data
anscombe = sns.load_dataset('anscombe')
anscombe.head()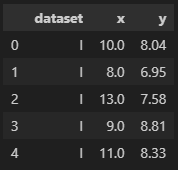
sns.set_style('darkgrid')
sns.lmplot(x = 'x', y='y', data = anscombe.query('dataset == "I"'), ci = None)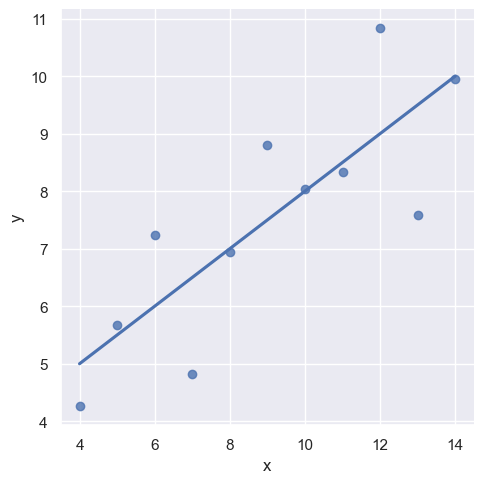
sns.set_style('darkgrid')
sns.lmplot(x = 'x', y='y', data = anscombe.query('dataset == "I"'), ci = None, scatter_kws={'s':80}) # scatter_kws : 마커사이즈 변경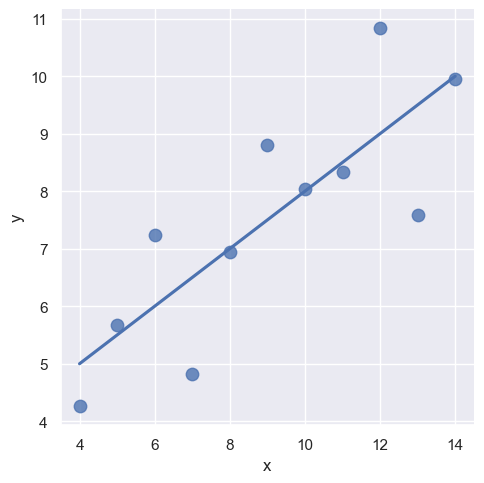
sns.set_style('darkgrid')
sns.lmplot(x = 'x', y='y', data = anscombe.query('dataset == "II"'), ci = None, order = 2, scatter_kws={'s':80}) # order : n차식 변경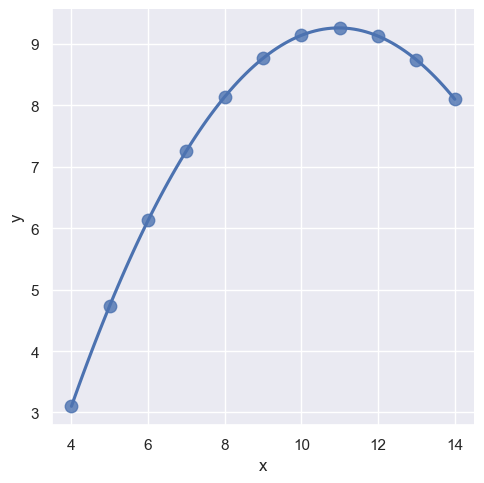
sns.set_style('darkgrid')
sns.lmplot(x = 'x', y='y', data = anscombe.query('dataset == "III"'), ci = None, order = 2, scatter_kws={'s':80}) # order : n차식 변경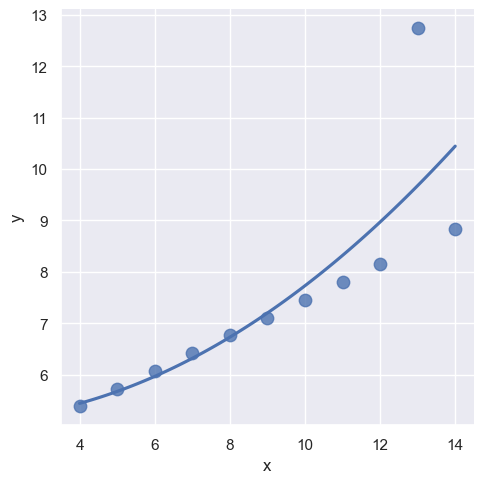

Start