🍩 도넛을 그려보자
최근 프로젝트 하다가 도넛을 그리고 싶어졌다. div블록을 깎아서 만들까 하다가 opgg데스크톱 앱의 이 아름다운 차트를 보자니 div로는 분명 한계가 명확했다. 특히 저 뭉툭한 스트로크..가능할까?

차트 라이브러리를 써볼까 했지만 공부하는 사람 입장에서 뭐든 최대한 네이티브한(?) 구현이 좋지 않겠는가....
아래 자료들이 도움이 많이 되었다.
https://a11y.gitbook.io/graphics-aria/svg-graphics/svg-basic-shapes
https://wit.nts-corp.com/2021/04/23/6338
환경은 typescript/react이다.
svg로 동그라미를 그릴때는 svg태그와 circle태그를 쓰거나, svg내에 path로 직접 그어주는 방법이 있다. path방식은 많이 복잡하기도 하고 필요해보이지는 않아서 circle방식을 써보려 한다. 구현해야 할 자료는 대충 다음과 같다.
KDAPerMatch: 0
champUseRatio: 25
deathPerMatch: 0
foreignLanguageRatio: 0
isPrevSeason: 25
maxDeathPerCount: 0
positionRatio: 7.5
userLevel: 23
winRate: 0
얘네는 최고합이 100이고, 점수에 따른 도넛차트를 구하면 된다. 먼저, 각 props 별 색상을 선언했다. index signature가 필요하기 때문에 미리 타입선언도 해준다.
const scoreColor:{[index:string]:string} = {
    deathPerMatch:'red',
    KDAPerMatch:'orange',
    winRate:'yellow',
    maxDeathPerCount:'green',
    foreignLanguageRatio:'blue',
    positionRatio:'navy',
    champUseRatio:'purple',
    userLevel:'black',
    isPrevSeason:'white',
}
무지개색...ㅎ
본격적으로 태그를 입력해준다. 사실 태그 내 property대부분은 그냥 보면 직감적으로 알 수 있다.
 <svg  width={size} height={size} viewBox={"0 0 100 100"} style={{transform:'rotate(-90deg)'}}>
           {Object.keys(offset).length>0 && Object.keys(score).map((prop, index)=>{
               const value = score[prop]
               const color = scoreColor[prop]
               if(typeof value=="number"&& value){
                    console.log(offset)
                    return(
                        <circle
                        stroke={color}
                        cx={50}
                        cy={50}
                        r={45}
                        strokeDasharray={`${2*Math.PI*45*(value/100)} ${2*Math.PI*45*(1-(value/100))}`}
                        strokeDashoffset={`${2*Math.PI*45*(offset[prop])/100}`}
                        fill={'none'} strokeWidth={10} />
                    )
               }

            })
            }
	</svg>
위에서 부터 차례로 보면
- viewBox는 size값에 의해 달라지는 svg박스 값을 100x100사이즈로 통일 시키는 역할을 한다.
- transform은 도넛의 획이 12시 방향에서 시작하도록 한다.
- value는 저렇게 미리 선언해야 타입검사가 가능하므로 상수선언 해놓았다.
- cx, cy, r은 각각 원 중앙의 좌표, 반지름이다.
- fill이 없으면 도넛으로 만들기
- strokeWidth는 선의 굵기이다.
제일 골때리는건 strokeDasharray, strokeDashoffset인데, 이해는 했는데 이상하게 구현에 시간이 많이 걸렸다.
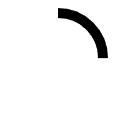
strokeDasharray
흔히 나와있는 자료들을 보면 이 속성은 점선의 점 길이를 의미한다. 값으로는 둘레를 그대로 이용하므로 2πr이라는 원의 둘레 공식을 계속 기억해두면 좋다. 중요한 부분은 속성값을 하나 쓰면 반복적으로 찍히는 점선의 길이만을 정의하지만, 속성값을 두개 쓰면 점선 사이의 공백까지 조절 가능하다는 것이다. 이를 이용해서
strokeDasharray = {(내가 원하는 호의 둘레) (원의둘레-1)}
를 입력하면 내가 원하는 만큼만 호를 긋는게 가능하다.
ex) strokeDasharray = {2πr*0.25 2πr0.75}
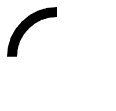
strokeDashoffset
이녀석은 선이 그어지는 시작점을 설정한다. 이것도 간단하게 원의 둘레 값에서 계산해서 넣으면 된다. 위의 그림에서 같은 호를 9시에서 12시로 긋고 싶다면, 원의 둘레(1/4) 만큼 strokeDashoffset을 설정해주면 된다.
처음에 12시를 기본값으로 하기위해 transform을 했었다. 원래 디폴트는 3시이다.
ex)strokeDasharray = {2πr0.25 2πr0.75} strokeDashoffset={2πr0.25}
이를 활용해서 score마다 strokeDashoffset을 누적합산 한다면 도넛차트를 그릴 수 있을 것이다. 나는 useEffect를 통해서 렌더링 될때 미리 offset값을 모두 구해서 useState 배열에 담아놓는 방식으로 구현했다.
무책임하게 코드를 던져놓을테니 알아서 이해해라 미래의나.....
import React ,{useState, useEffect}from "react";
import { algoScoreType } from "../types/algorithm.type";

type ScoreCircleType = {
    size:number,
    stroke:number,
    score:algoScoreType
}

const scoreColor:{[index:string]:string} = {
    deathPerMatch:'red',
    KDAPerMatch:'orange',
    winRate:'yellow',
    maxDeathPerCount:'green',
    foreignLanguageRatio:'blue',
    positionRatio:'navy',
    champUseRatio:'purple',
    userLevel:'black',
    isPrevSeason:'white',
}

export default function ScoreCircle({size, stroke , score}:ScoreCircleType){
    const [offset, setOffset] = useState<{[index:string]:number}>({});

    useEffect(() => {
        setOffset(getOffset(score))
    }, [score]);

    const getOffset = (score:algoScoreType) =>{
        const arr:{[index:string]:number} = {};
        let prev = 0;
        Object.keys(score).forEach((v:string)=>{
            const value = score[v]
            console.log(prev)
            if(typeof value=="number"&& value){
                arr[v] = value+prev
                prev = value+prev
            }

        })
        console.log(arr)
        return arr
    }
    return(
       <svg  width={size} height={size} viewBox={"0 0 100 100"} style={{transform:'rotate(-90deg)'}}>
           {Object.keys(offset).length>0 && Object.keys(score).map((prop, index)=>{
               const value = score[prop]
               const color = scoreColor[prop]
               if(typeof value=="number"&& value){
                    console.log(offset)
                    return(
                        <circle
                        style={{zIndex:Object.keys(score).length-index}}
                        stroke={color}
                        cx={50}
                        cy={50}
                        r={45}
                        strokeDasharray={`${2*Math.PI*45*(value/100)} ${2*Math.PI*45*(1-(value/100))}`}
                        strokeDashoffset={`${2*Math.PI*45*(offset[prop])/100}`}
                        fill={'none'} strokeWidth={stroke} />
                    )
               }

            })
            }
       </svg>
    )
}
허접하지만...ㅋㅋ

생각해보니 딱히 뭉툭한 스트로크가 필요없네....
뭉툭한 스트로크는
strokeLinecap={"round"}
를 주면 쓸 수 있다.
이를 이해했다면 애니메이션을 주거나, 덧씌우기 등의 응용도 가능하다.