
Prophet 패키지를 가지고 시계열분석을 해보자!
환경설정
-
윈도우에서 사용하기 위해서는 Visual C++ Build Tool을 설치해야함
https://visualstudio.microsoft.com/ko/downloads/conda install pandas-datareader conda install -c conda-forge prophet
사용자 정의 함수:
**kwargs
- parameter 값이 여러개이거나, 초기 값을 설정하고 싶을 때 사용하는 키워드
def plotSinWave(**kwargs): #일반적으로 kwargs로 명명
""" #함수 사용시 나오는 주석
plot sine wave
y = a sin(2 pi f t + t_0) + b
"""
  amp = kwargs.get('amp', 1)
  freq = kwargs.get('freq', 0.1)
  endTime = kwargs.get('endTime', 0)
  sampleTime = kwargs.get('sampleTime', 1)
  startTime = kwargs.get('startTime', 1)
  bias = kwargs.get('bias', 1)
%%writefile: Jupyter Notebook이나 IPython 환경에서 사용되는 기능으로, 특정 코드 블록을 파일로 저장하는 데 사용되는 명령어
- 셀 첫줄에 파일 경로를 지정하고, 나머지 셀의 내용은 파일에 저장될 코드가 됨
- 파이썬 파일 외에도 다른 파일 형식의 저장 가능함
- 기존에 존재하는 파일이 있는 경우 덮어씀
%%writefile hello.py def greet(): print("Hello from the file!") greet()%%writefile example.txt This is a simple text file. It contains multiple lines of text.
1. Freprophet 기초
time = np.linspace(0, 1, 365 * 2)
result = np.sin(2 * np.pi * 12 * time)

ds = pd.date_range('2018-01-01', periods = 365*2, freq = 'D') #2018년도 부터 2년간의 날짜 데이터
df = pd.DataFrame({'ds' : ds, 'y' : result})

df, df['y'].plot();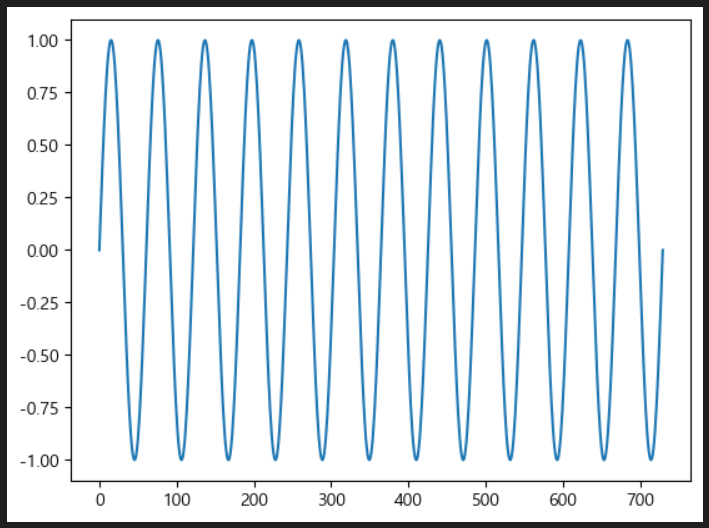
- prophet 객체 생성
- fit 함수의 전달되는 데이터 프레임의 조건: 날짜형 데이터 포함, 숫자형 y열(예측하려는 값)
from prophet import Prophet

#Prophet 모델 초기화 (Prophet 객체 생성)
m = Prophet(yearly_seasonality = True, daily_seasonality = True)

#Prophet 모델을 학습시키는 함수, 모델 객체 자신을 반환하여 체이닝 가능
m.fit(df)

#예측값 생성: 추가적인 미래 날짜를 포함한 데이터 프레임 생성
#사용법: make_future_dataframe(periods, freq = 'D', include_history=True)
future = m.make_future_dataframe(30) #30일치를 예측해봐

#예측 수행: 데이터 프레임에는 최소한 ds(날짜)열을 포함해야 함
forecast = m.predict(future)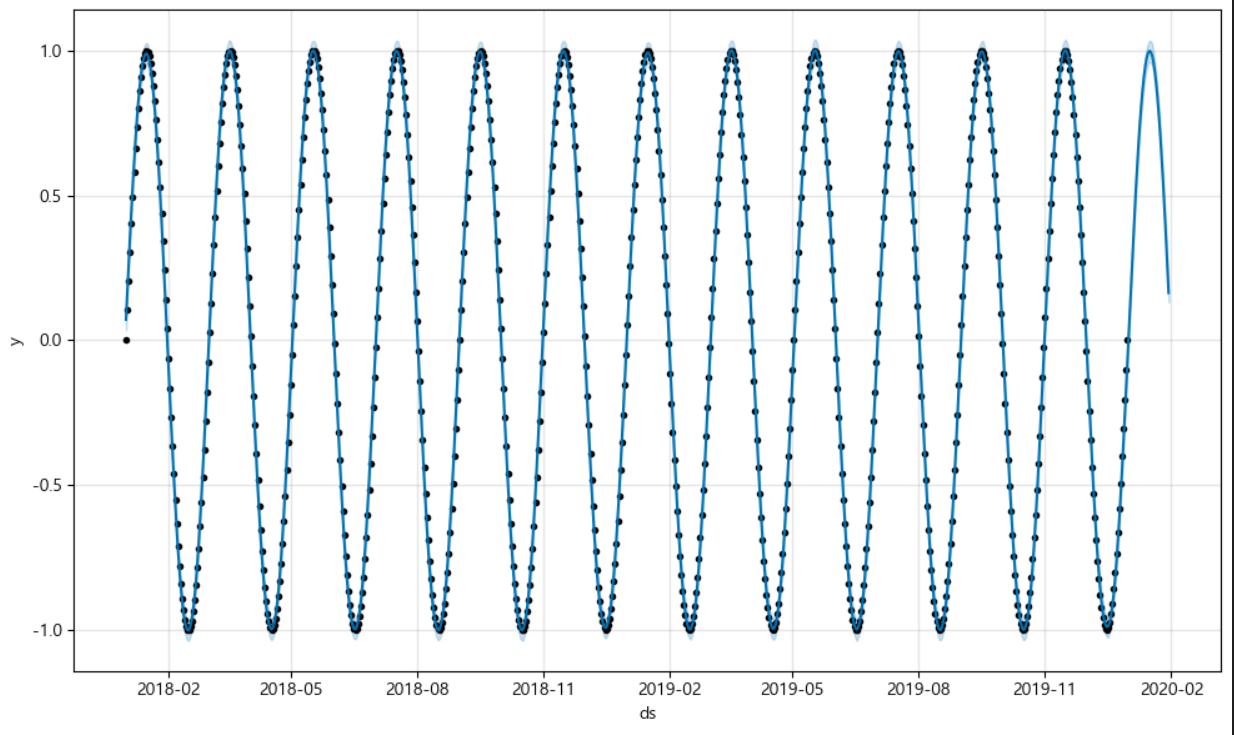
오차항을 추가한 dataframe 사용해보기
time = np.linspace(0, 1, 365 * 2)
result = np.sin(2 * np.pi * 12 * time) + time + np.random.randn(365*2)/4

ds = pd.date_range('2018-01-01', periods = 365*2, freq = 'D')
df = pd.DataFrame({'ds' : ds, 'y' : result})

m = Prophet(yearly_seasonality = True, daily_seasonality = True)
m.fit(df)
future = m.make_future_dataframe(30)
forecast = m.predict(future)
m.plot(forecast);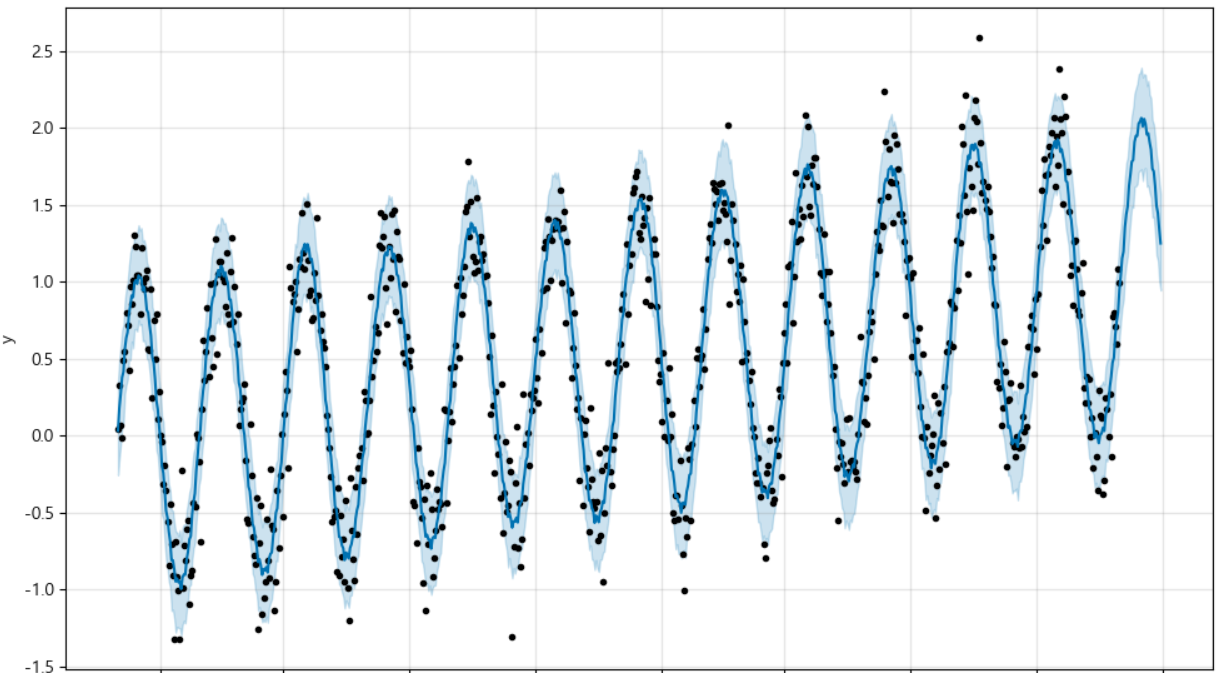
2. 시간대별 홈페이지 방문자 수를 분석해보자
# 전체 데이터 그려보기
pinkwink_web['hit'].plot(figsize=(12,4), grid = True);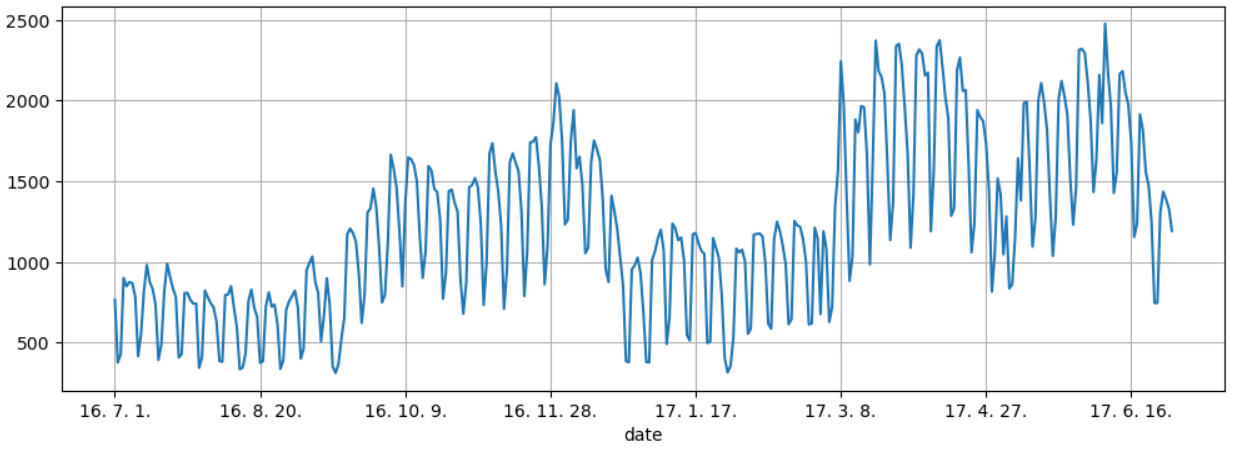
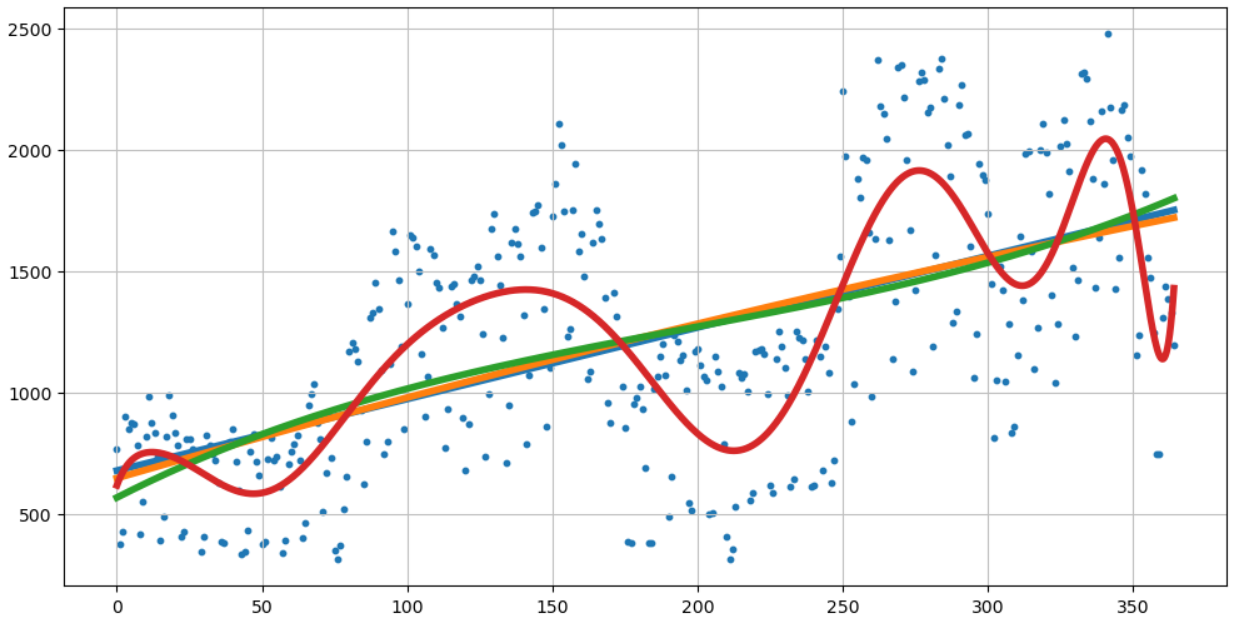
다항회귀식을 통한 trend 분석
# trend분석 시각화를 위한 x축 값 만들기
time = np.arange(0, len(pinkwink_web)) len: 365
traffic = pinkwink_web['hit'].values
fx = np.linspace(0, time[-1], 1000)
fx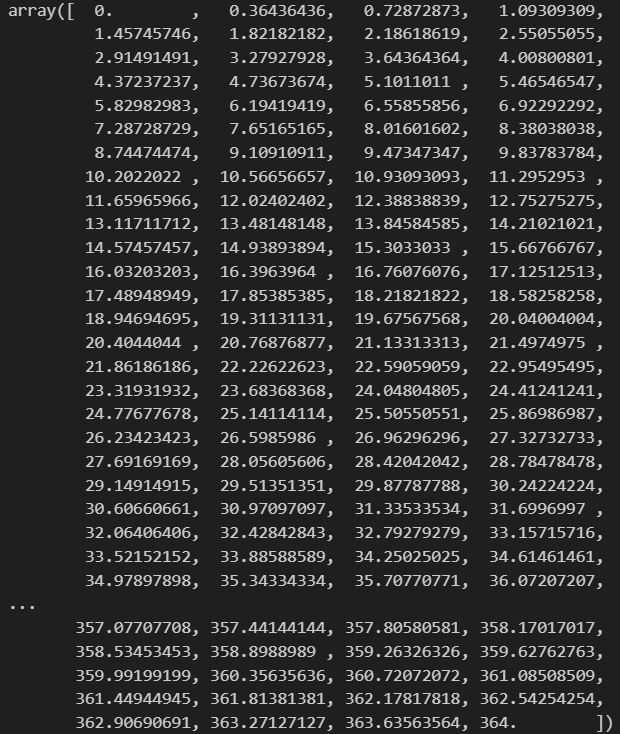
-
numpy의 polyfit 함수를 이용하여 다항회귀식 만들기
	numpy.polyfit(x, y, deg) x: 독립변수 데이터(1차원 배열) / y: 종속변수 데이터(1차원 배열) / deg: 다항식의 차수
	numpy.poly1d(c_or_r) 다항식 객체를 생성하는 데 사용, c_or_r: 다항식 계수 배열 또는 다항식의 근(root) 배열
# 1차원
f1p = np.polyfit(time, traffic, 1)
f1 = np.poly1d(f1p)

# 2차원
f2p = np.polyfit(time, traffic, 2)
f2 = np.poly1d(f2p)

# 3차원
f3p = np.polyfit(time, traffic, 3)
f3 = np.poly1d(f3p)

# 15차원
f15p = np.polyfit(time, traffic, 15)
f15 = np.poly1d(f15p)

plt.figure(figsize=(12,6))
plt.scatter(time, traffic, s=10)
plt.plot(fx, f1(fx), lw=4, label='f1') #fx: np.linspace(0, time[-1], 1000)
plt.plot(fx, f2(fx), lw=4, label='f2')
plt.plot(fx, f3(fx), lw=4, label='f3')
plt.plot(fx, f15(fx), lw=4, label='f15')

plt.grid(True, linestyle = '-', color = '0.75')
plt.show()
Freprophet을 이용한 시계열 분석
# ds 날짜형으로 바꿔주기
df = pd.DataFrame({'ds': pinkwink_web.index, 'y': pinkwink_web['hit']})
df.reset_index(inplace = True)
df['ds'] = pd.to_datetime(df['ds'], format = '%y. %m. %d.')
del df['date']

m = Prophet(yearly_seasonality = True, daily_seasonality=True)
m.fit(df)
future = m.make_future_dataframe(60)
forecast = m.predict(future)
m.plot(forecast);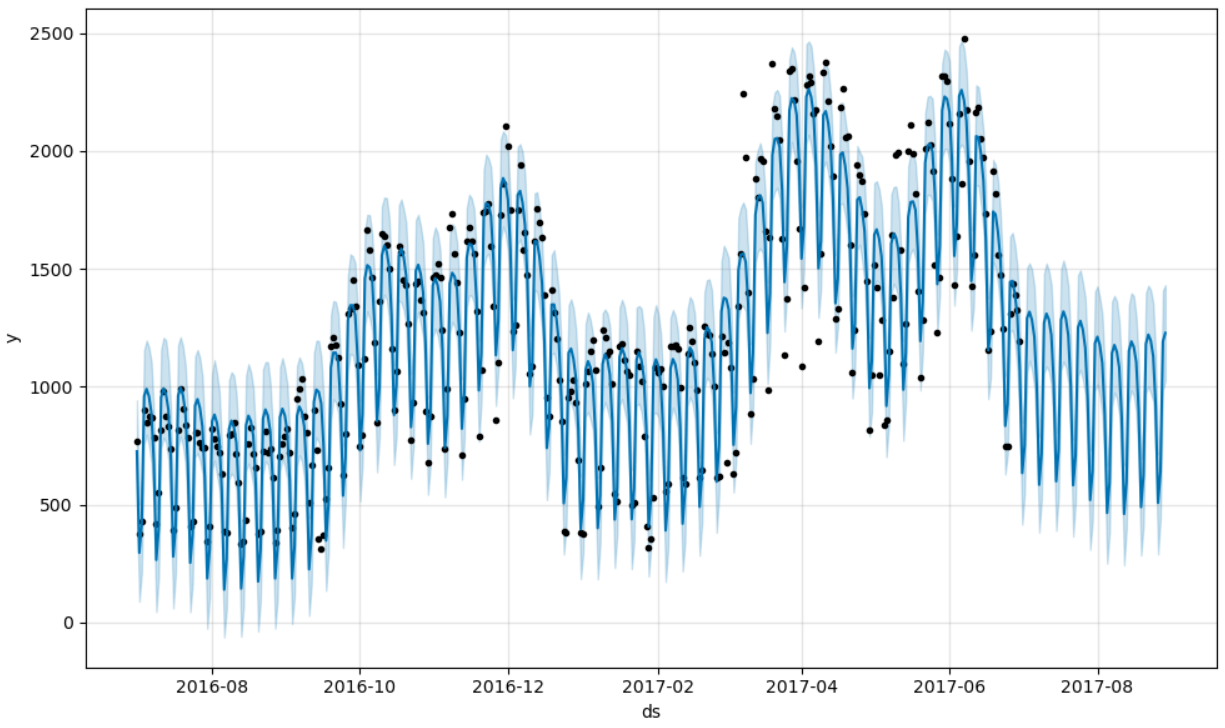
-
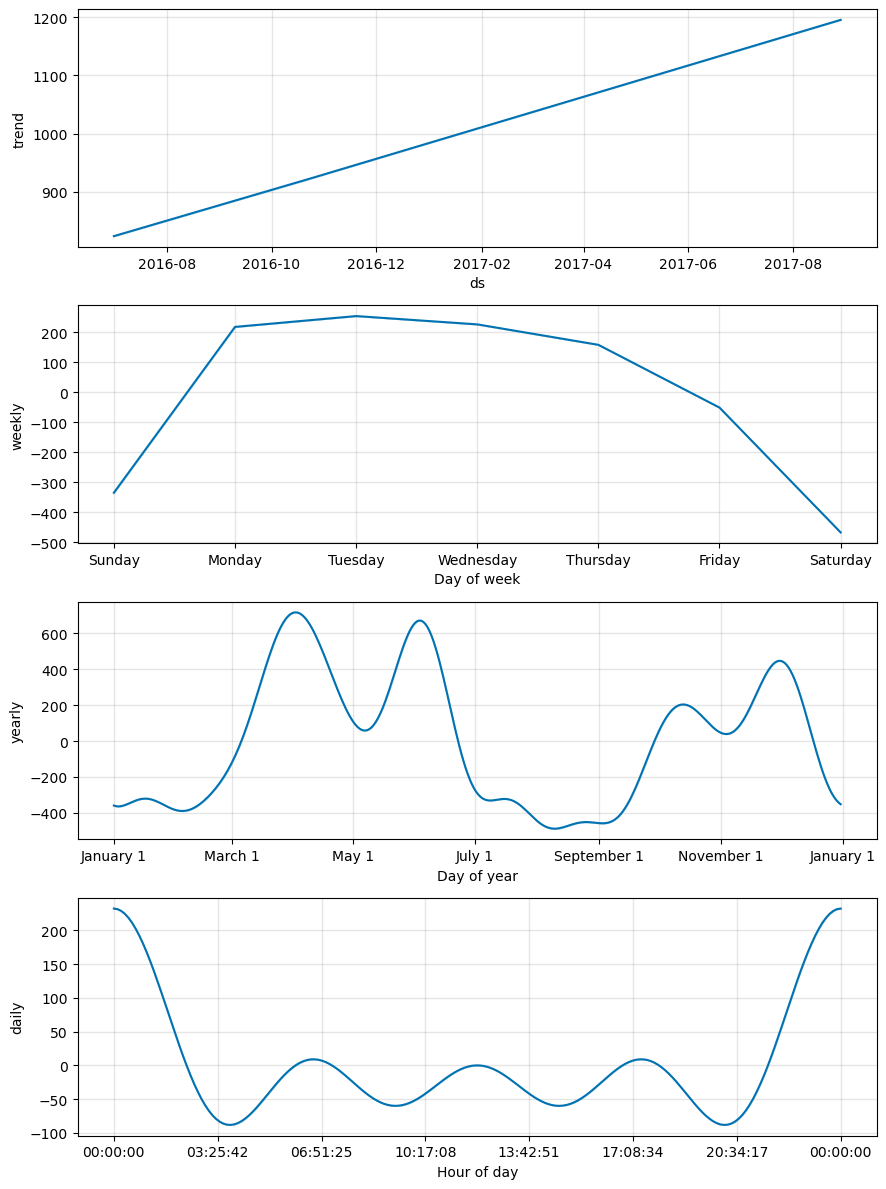
월별, 요일 별, 시간별로 뜯어보자 !
m.plot_components(forecast);

비전공자의 Data Analyst 도전기 🥹✨