클라우드 에이전트 만들기
# install the agent on Amazon Linux 2
sudo yum install amazon-cloudwatch-agent
에이전트 마법사 실행
Amazon CloudWatch Agent 설정 마법사로 CloudWatch Agent의 설절 파일을 생성하는 도구입니다.
이 도구는 사용자가 입력한 정보를 바탕으로 설정파일(config.json)을 자동으로 생성해 줍니다.
대화방식이므로 아래 내용을 참고하세요
# run the wizard
sudo /opt/aws/amazon-cloudwatch-agent/bin/amazon-cloudwatch-agent-config-wizard
================================================================
= Welcome to the Amazon CloudWatch Agent Configuration Manager =
= =
= CloudWatch Agent allows you to collect metrics and logs from =
= your host and send them to CloudWatch. Additional CloudWatch =
= charges may apply. =
================================================================
On which OS are you planning to use the agent?
1. linux
2. windows
3. darwin
default choice: [1]:
1
Trying to fetch the default region based on ec2 metadata...
I! imds retry client will retry 1 timesAre you using EC2 or On-Premises hosts?
1. EC2
2. On-Premises
default choice: [1]:
1
Which user are you planning to run the agent?
1. cwagent
2. root
3. others
default choice: [1]:
2
Do you want to turn on StatsD daemon?
1. yes
2. no
default choice: [1]:
1
Which port do you want StatsD daemon to listen to?
default choice: [8125]
8125
What is the collect interval for StatsD daemon?
1. 10s
2. 30s
3. 60s
default choice: [1]:
1
What is the aggregation interval for metrics collected by StatsD daemon?
1. Do not aggregate
2. 10s
3. 30s
4. 60s
default choice: [4]:
4
Do you want to monitor metrics from CollectD? WARNING: CollectD must be installed or the Agent will fail to start
1. yes
2. no
default choice: [1]:
2
Do you want to monitor any host metrics? e.g. CPU, memory, etc.
1. yes
2. no
default choice: [1]:
1
Do you want to monitor cpu metrics per core?
1. yes
2. no
default choice: [1]:
1
Do you want to add ec2 dimensions (ImageId, InstanceId, InstanceType, AutoScalingGroupName) into all of your metrics if the info is available?
1. yes
2. no
default choice: [1]:
1
Do you want to aggregate ec2 dimensions (InstanceId)?
1. yes
2. no
default choice: [1]:
1
Would you like to collect your metrics at high resolution (sub-minute resolution)? This enables sub-minute resolution for all metrics, but you can customize for specific metrics in the output json file.
1. 1s
2. 10s
3. 30s
4. 60s
default choice: [4]:
4
Which default metrics config do you want?
1. Basic
2. Standard
3. Advanced
4. None
default choice: [1]:
1
Current config as follows:
{
"agent": {
"metrics_collection_interval": 60,
"run_as_user": "root"
},
"metrics": {
"aggregation_dimensions": [
[
"InstanceId"
]
],
"append_dimensions": {
"AutoScalingGroupName": "${aws:AutoScalingGroupName}",
"ImageId": "${aws:ImageId}",
"InstanceId": "${aws:InstanceId}",
"InstanceType": "${aws:InstanceType}"
},
"metrics_collected": {
"disk": {
"measurement": [
"used_percent"
],
"metrics_collection_interval": 60,
"resources": [
"*"
]
},
"mem": {
"measurement": [
"mem_used_percent"
],
"metrics_collection_interval": 60
},
"statsd": {
"metrics_aggregation_interval": 60,
"metrics_collection_interval": 10,
"service_address": ":8125"
}
}
}
}
Are you satisfied with the above config? Note: it can be manually customized after the wizard completes to add additional items.
1. yes
2. no
default choice: [1]:
1
Do you have any existing CloudWatch Log Agent (http://docs.aws.amazon.com/AmazonCloudWatch/latest/logs/AgentReference.html) configuration file to import for migration?
1. yes
2. no
default choice: [2]:
2
Do you want to monitor any log files?
1. yes
2. no
default choice: [1]:
1
Log file path:
/var/log/httpd/access_log
Log group name:
default choice: [access_log]
Log group class:
1. STANDARD
2. INFREQUENT_ACCESS
default choice: [1]:
1
Log stream name:
default choice: [{instance_id}]
Log Group Retention in days
1. -1
2. 1
3. 3
4. 5
5. 7
6. 14
7. 30
8. 60
9. 90
10. 120
11. 150
12. 180
13. 365
14. 400
15. 545
16. 731
17. 1096
18. 1827
19. 2192
20. 2557
21. 2922
22. 3288
23. 3653
default choice: [1]:
5
Do you want to specify any additional log files to monitor?
1. yes
2. no
default choice: [1]:
1
Log file path:
/var/log/httpd/error_log
Log group name:
default choice: [error_log]
Log group class:
1. STANDARD
2. INFREQUENT_ACCESS
default choice: [1]:
1
Log stream name:
default choice: [{instance_id}]
Log Group Retention in days
1. -1
2. 1
3. 3
4. 5
5. 7
6. 14
7. 30
8. 60
9. 90
10. 120
11. 150
12. 180
13. 365
14. 400
15. 545
16. 731
17. 1096
18. 1827
19. 2192
20. 2557
21. 2922
22. 3288
23. 3653
default choice: [1]:
5
Do you want to specify any additional log files to monitor?
1. yes
2. no
default choice: [1]:
2
Do you want the CloudWatch agent to also retrieve X-ray traces?
1. yes
2. no
default choice: [1]:
1
Do you have an existing X-Ray Daemon configuration file to import for migration?
1. yes
2. no
default choice: [1]:
1
What is the file path for the existing X-Ray Daemon configuration file?
There was an error reading X-Ray Daemon config file. Using default traces configurations
Current Traces Configurations:
{
"traces": {
"traces_collected": {
"xray": {
"bind_address": "127.0.0.1:2000",
"tcp_proxy": {
"bind_address": "127.0.0.1:2000"
}
}
},
"concurrency": 8,
"buffer_size_mb": 3,
"insecure": false
}
}
Enter a number of the field you would like to update (or 0 to exit)
0: Keep this configuration and exit
1: UDP BindAddress
2: TCP BindAddress
3: concurrency
4: buffer_size_mb
5: resource_arn
6: local_mode
7: insecure
8: role_arn
9: endpoint_override
10: region_override
11: proxy_override
Existing config JSON identified and copied to: /opt/aws/amazon-cloudwatch-agent/etc/backup-configs
Saved config file to /opt/aws/amazon-cloudwatch-agent/bin/config.json successfully.
Current config as follows:
{
"agent": {
"metrics_collection_interval": 60,
"run_as_user": "root"
},
"logs": {
"logs_collected": {
"files": {
"collect_list": [
{
"file_path": "/var/log/httpd/access_log",
"log_group_class": "STANDARD",
"log_group_name": "access_log",
"log_stream_name": "{instance_id}",
"retention_in_days": 7
},
{
"file_path": "/var/log/httpd/error_log",
"log_group_class": "STANDARD",
"log_group_name": "error_log",
"log_stream_name": "{instance_id}",
"retention_in_days": 7
}
]
}
}
},
"metrics": {
"aggregation_dimensions": [
[
"InstanceId"
]
],
"append_dimensions": {
"AutoScalingGroupName": "${aws:AutoScalingGroupName}",
"ImageId": "${aws:ImageId}",
"InstanceId": "${aws:InstanceId}",
"InstanceType": "${aws:InstanceType}"
},
"metrics_collected": {
"disk": {
"measurement": [
"used_percent"
],
"metrics_collection_interval": 60,
"resources": [
"*"
]
},
"mem": {
"measurement": [
"mem_used_percent"
],
"metrics_collection_interval": 60
},
"statsd": {
"metrics_aggregation_interval": 60,
"metrics_collection_interval": 10,
"service_address": ":8125"
}
}
},
"traces": {
"buffer_size_mb": 3,
"concurrency": 8,
"insecure": false,
"traces_collected": {
"xray": {
"bind_address": "127.0.0.1:2000",
"tcp_proxy": {
"bind_address": "127.0.0.1:2000"
}
}
}
}
}
Please check the above content of the config.
The config file is also located at /opt/aws/amazon-cloudwatch-agent/bin/config.json.
Edit it manually if needed.
Do you want to store the config in the SSM parameter store?
1. yes
2. no
default choice: [1]:
1
What parameter store name do you want to use to store your config? (Use 'AmazonCloudWatch-' prefix if you use our managed AWS policy)
default choice: [AmazonCloudWatch-linux]
Trying to fetch the default region based on ec2 metadata...
I! imds retry client will retry 1 timesWhich region do you want to store the config in the parameter store?
default choice: [ap-northeast-2]
Which AWS credential should be used to send json config to parameter store?
1. ASIA2OAJT4RICOQKSZ4H(From SDK)
2. Other
default choice: [1]:
1
Successfully put config to parameter store AmazonCloudWatch-linux.실행 방법
SSM Patameter Store를 사용하는 경우
# options
/opt/aws/amazon-cloudwatch-agent/bin/amazon-cloudwatch-agent-ctl -a fetch-config -m ec2 -c ssm:AmazonCloudWatch-linux -s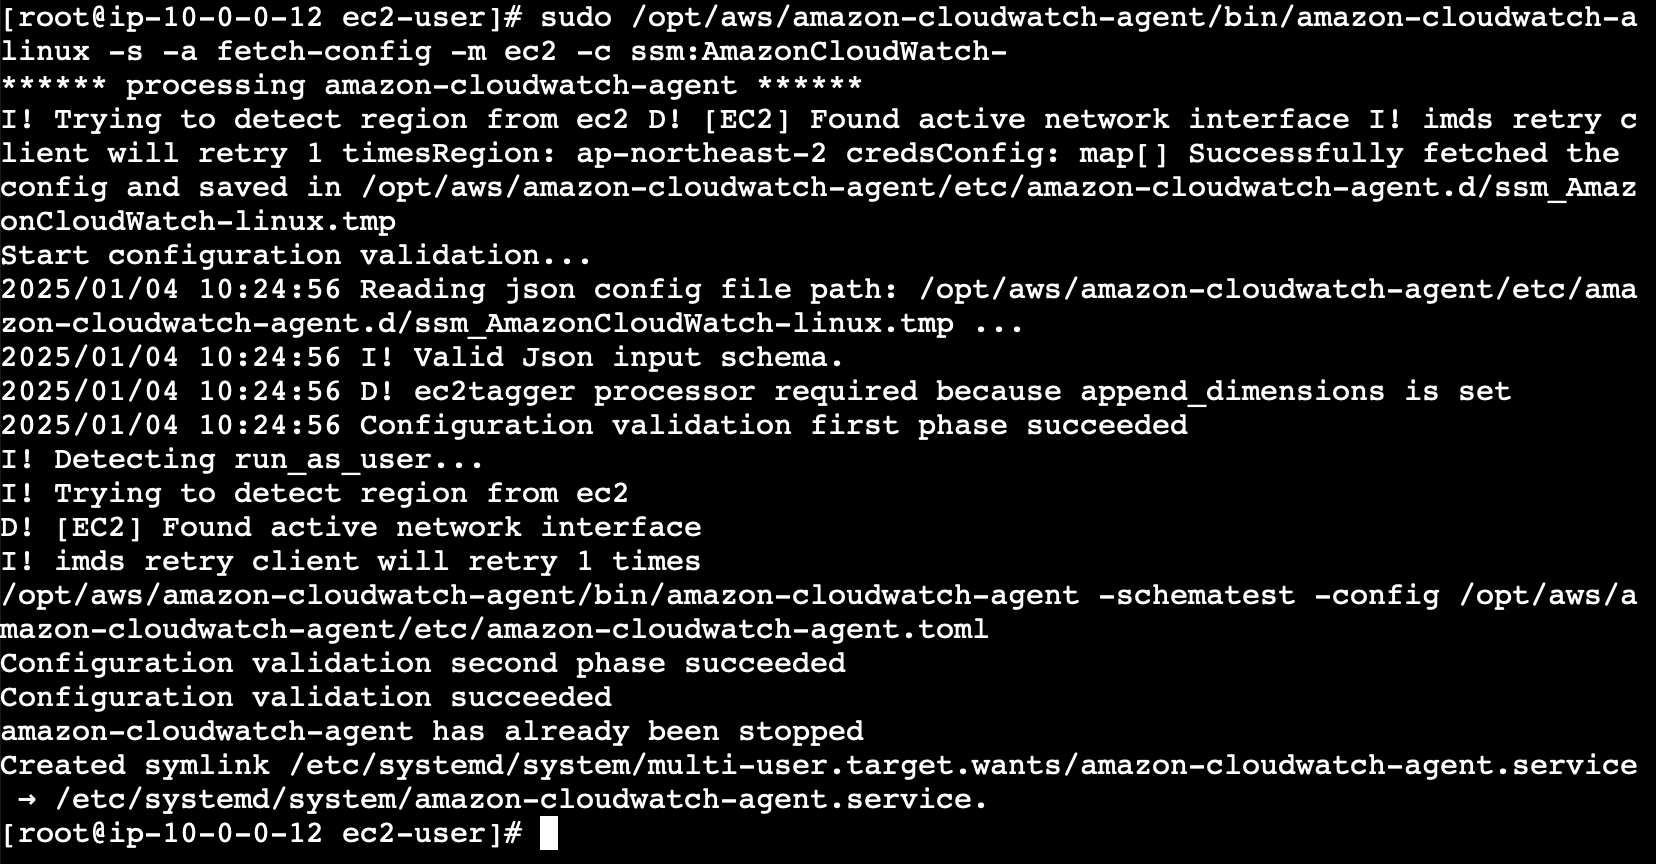
로컬 파일을 사용하는 경우
sudo /opt/aws/amazon-cloudwatch-agent/bin/amazon-cloudwatch-agent-ctl -a fetch-config -m ec2 -c file:/opt/aws/amazon-cloudwatch-agent/bin/config.json -s결과
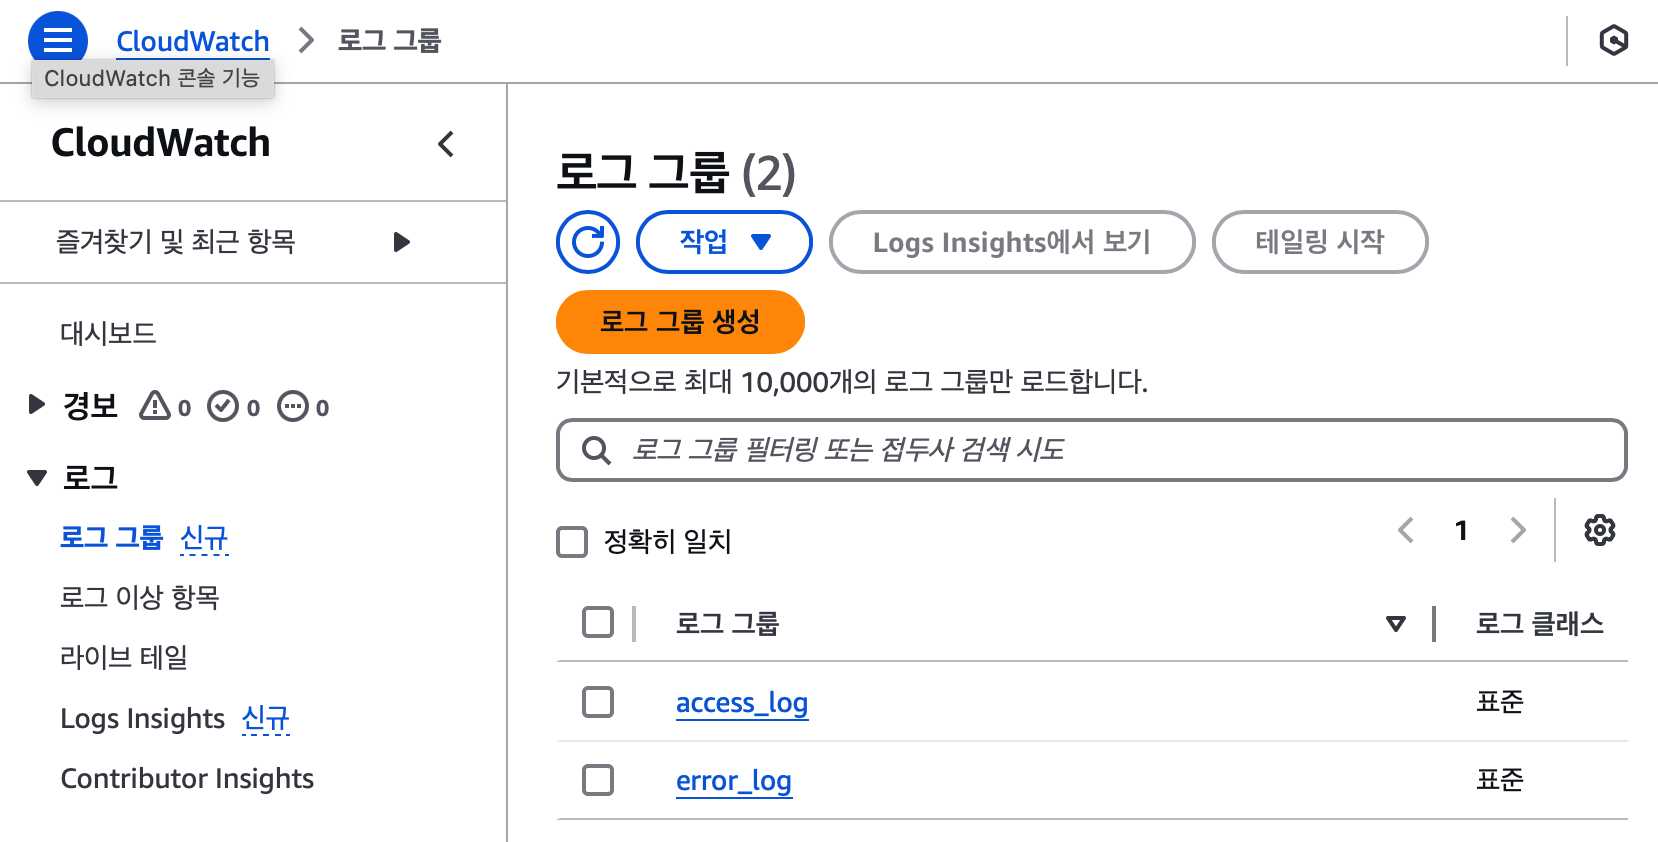
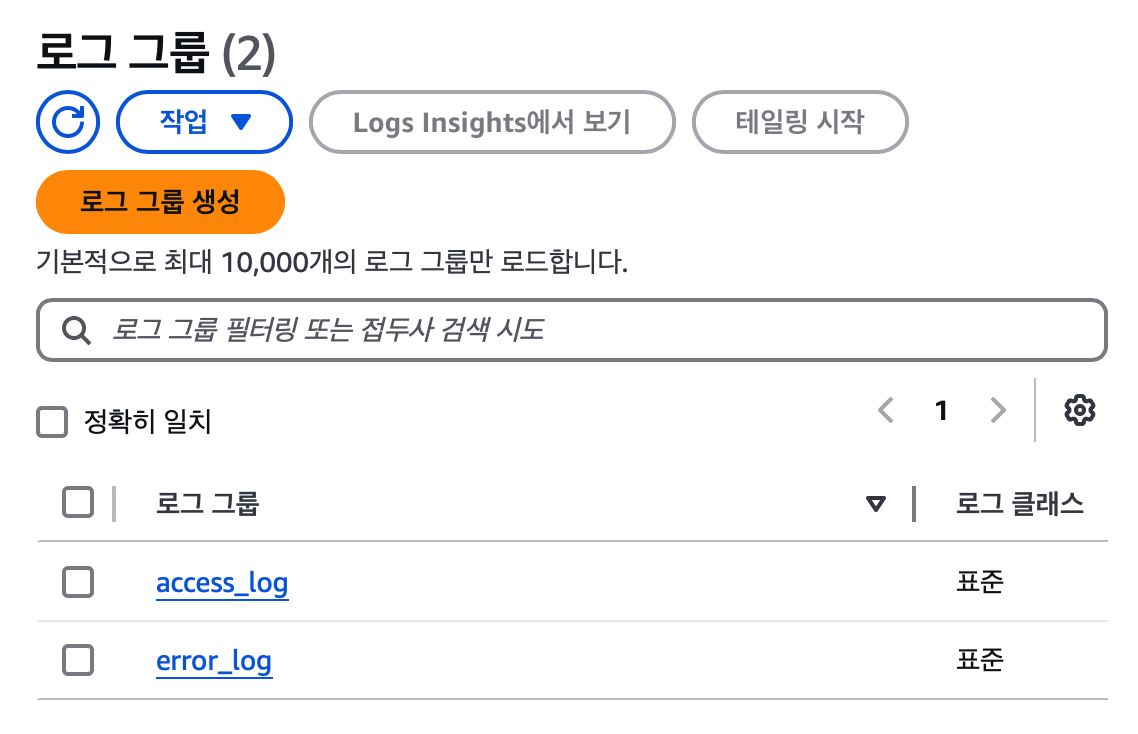
이제 AWS 콘솔에서 로그 그룹이 생성되었습니다. EC2 인스턴스 개별 로그를 중앙화된 로그 및 메트릭 수집이 가능하게 되었습니다.

아는 만큼 보인다