Plotting
PyPlot 등을 이용한 plot 그리기
using Pkg
Pkg.add("Plots")
using Plot
globaltemperatures = [14.4, 14.5, 14.8, 15.2, 15.5, 15.8]6-element Array{Float64,1}:
14.4
14.5
14.8
15.2
15.5
15.8numpirates = [45000, 20000, 15000, 5000, 400, 17]6-element Array{Int64,1}:
45000
20000
15000
5000
400
17# try the GR backend - 실제로 플롯을 그리는 library
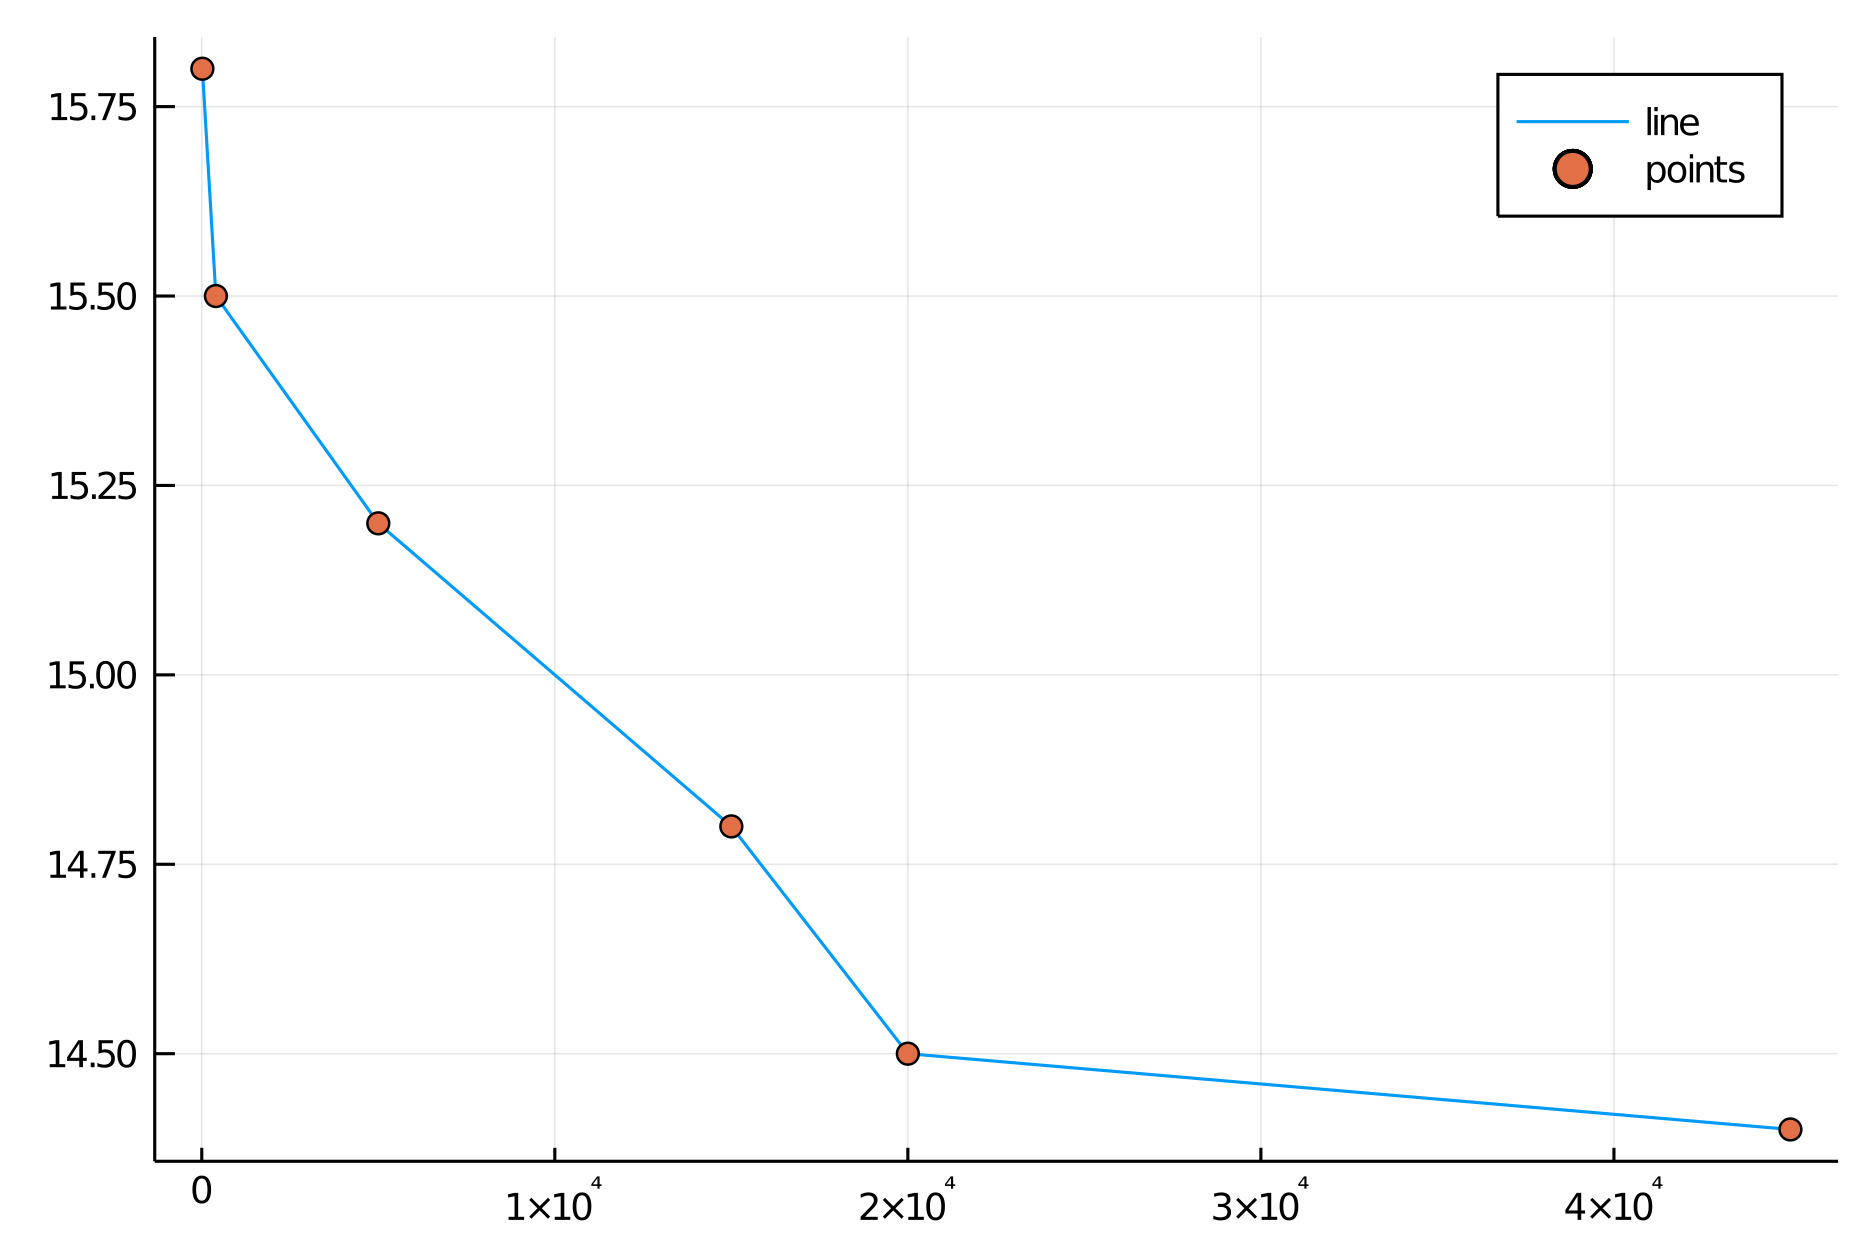
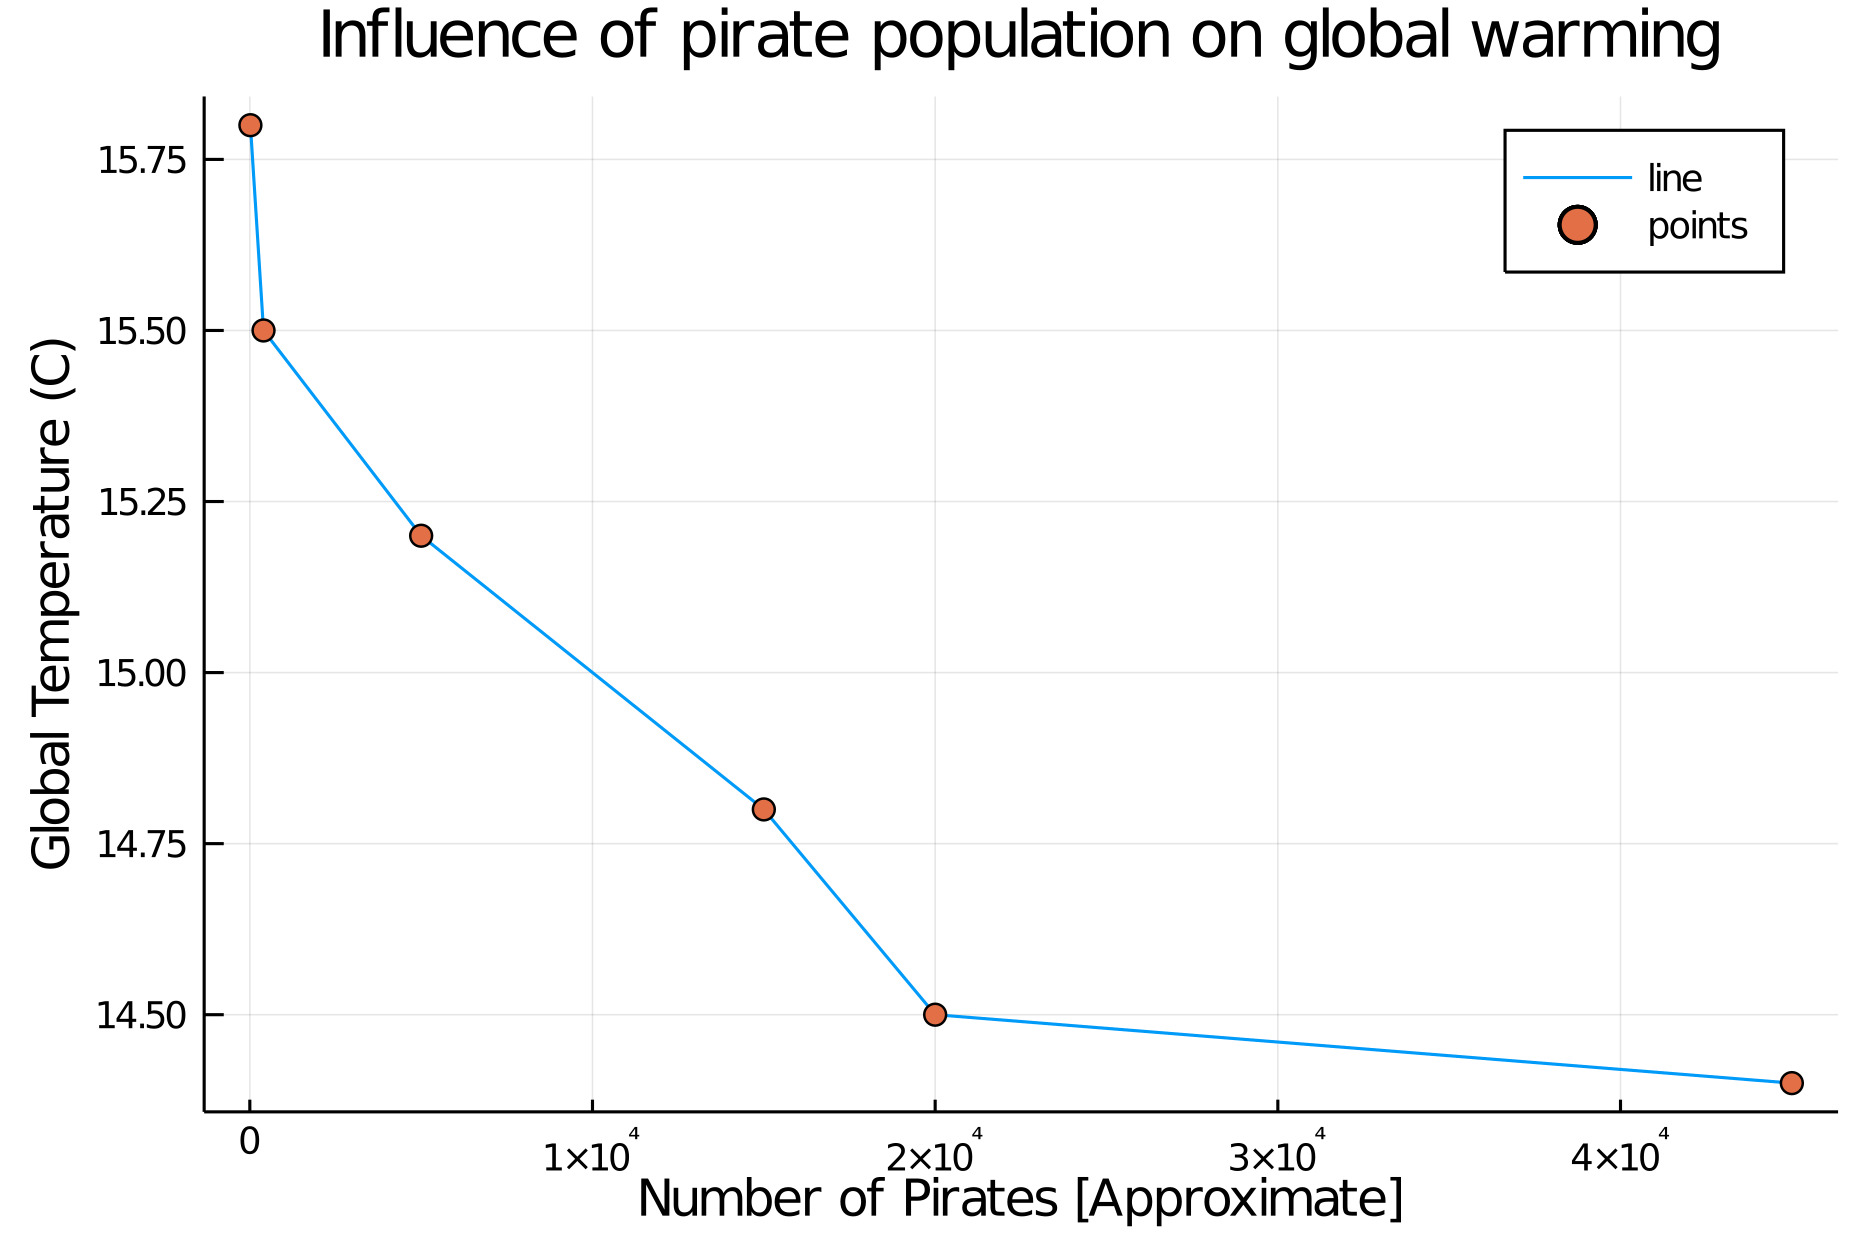
gr()Plots.GRBackend()plot(numpirates, globaltemperatures, label="line")
# scattered points가 위의 plot에 추가될 수 있도록 한다.
scatter!(numpirates, globaltemperatures, label="points")
xlabel!("Number of Pirates [Approximate]")
ylabel!("Global Temperature (C)")
title!("Influence of pirate population on global warming")
# syntax를 바꾸지 않고도 backend를 바꿔 plot을 그릴 수 있다.
Pkg.add("UnicodePlots")
unicodeplots()
plot(numpirates, globaltemperatures, label="line")
scatter!(numpirates, globaltemperatures, label="points")
xlabel!("Number of Pirates [Approximate]")
ylabel!("Global Temperature (C)")
title!("Influence of pirate population on global warming") Influence of pirate population on global warming
+------------------------------------------------------------+
15.842 | | | line
| | | points
| | |
| || |
| || |
| |". |
| | \. |
| | '. |
| | `. |
Global Temperature (C) | | "\. |
| | ".. |
| | '`. |
| | "\. |
| | ".. |
| | '. |
| | \. |
| | ". |
| | \. |
| | """"""`-------._______ |
14.358 | | """""""\--/ |
+------------------------------------------------------------+
-1332.49 46349.49
Number of Pirates [Approximate]