안녕하세요, 시각화 장인 Hangnii 입니다😁😆
오늘은 시각화로 쓰이는 그래프 중 하나인 레이더차트(Radar Chart)를
파이썬 코드로 구현하는 법에 대해 알아볼게요!
📡 레이더 차트(Radar Chart) 🕸
레이더 차트는 어떤 측정 목표에 대한 평가항목이 여러 개일 때,
항목 수에 따라 원을 같은 간격으로 나누고
중심으로부터 일정 간격으로 동심으로 척도를 재는 칸을 나누어,
각 평가항목의 정량화된 점수에 따라 그 위치에 점을 찍고
평가항목간 점을 이어 선으로 만든 그래프입니다 :)
여러 측정 목표를 함께 겹쳐 놓아 비교하기에도 편리하고,
각 항목 간 비율뿐만 아니라 균형과 경향을 직관적으로 알 수 있다는 장점이 있으며,레이다의 표시장치와 닮아서 레이다 도표라고 하며 레이다 차트, 레이다 그래프 혹은 스파이더 차트🕸, 스타 차트🌠라고도 합니다.
(출처: 위키백과)
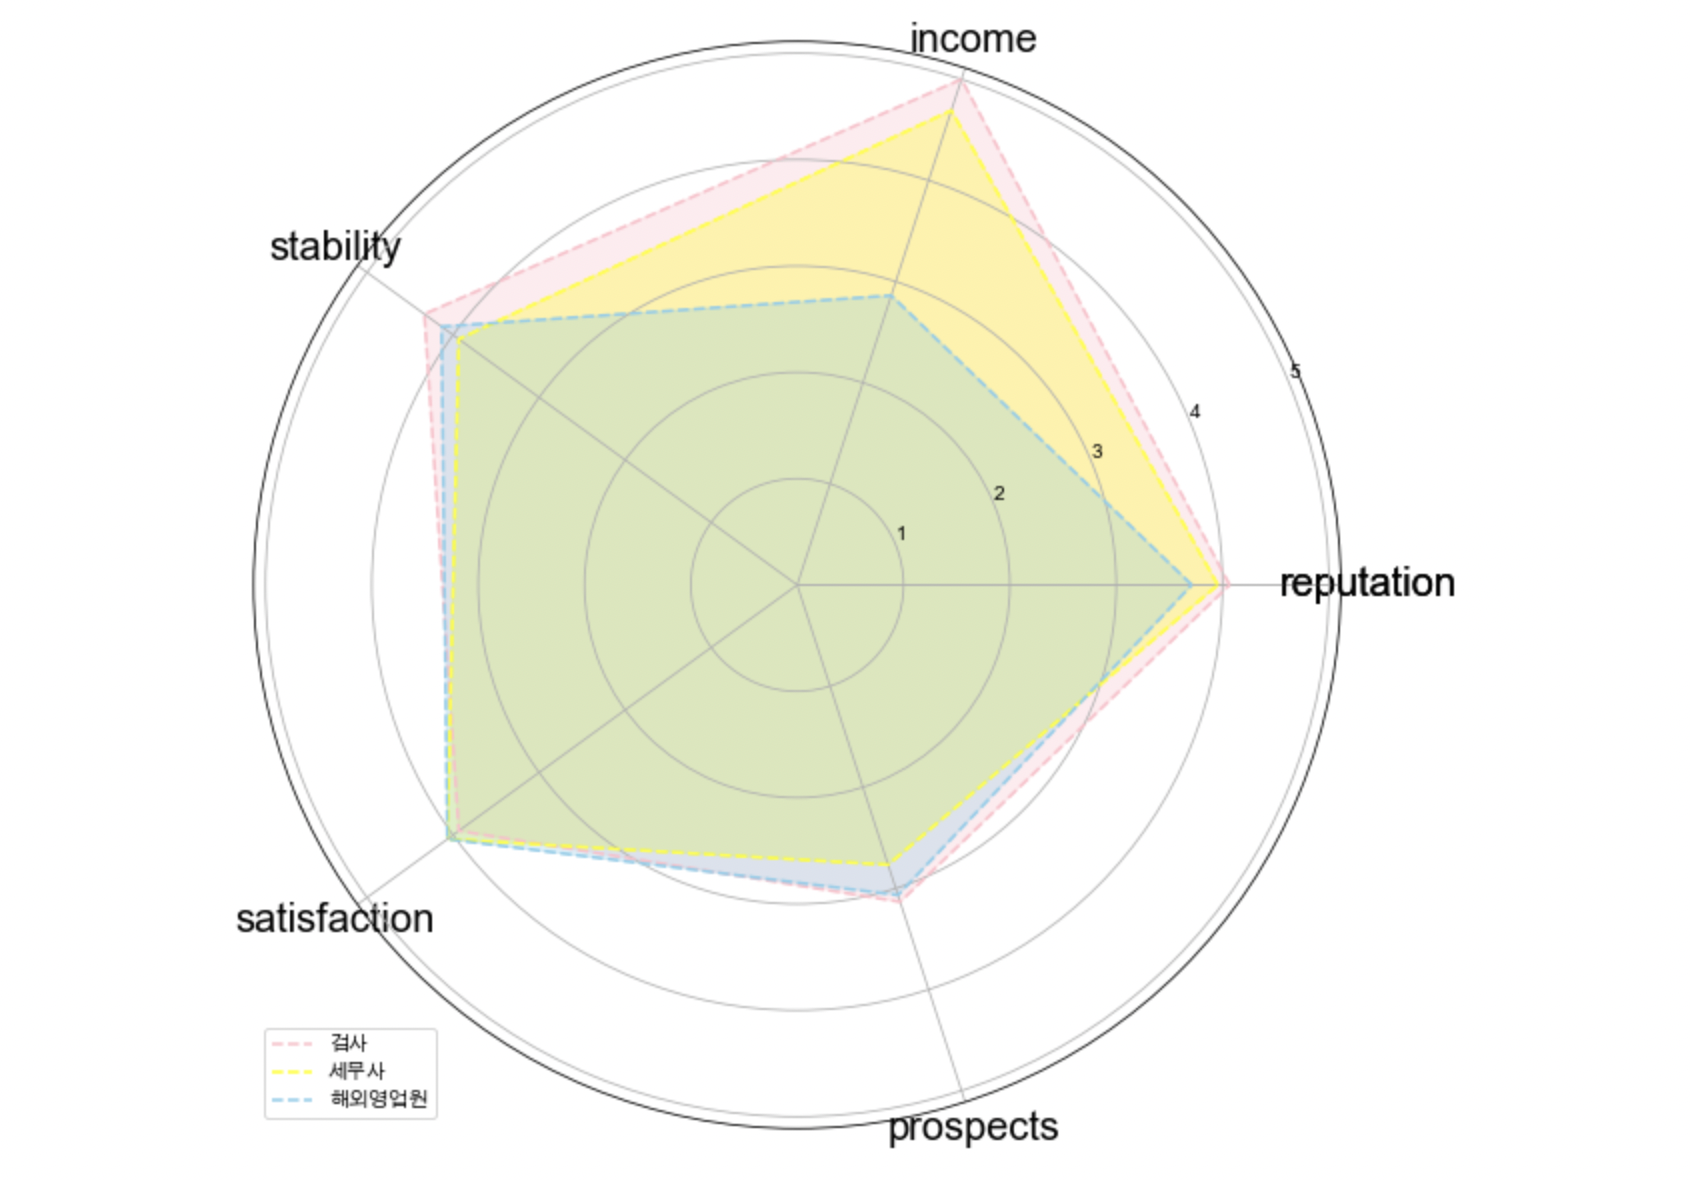
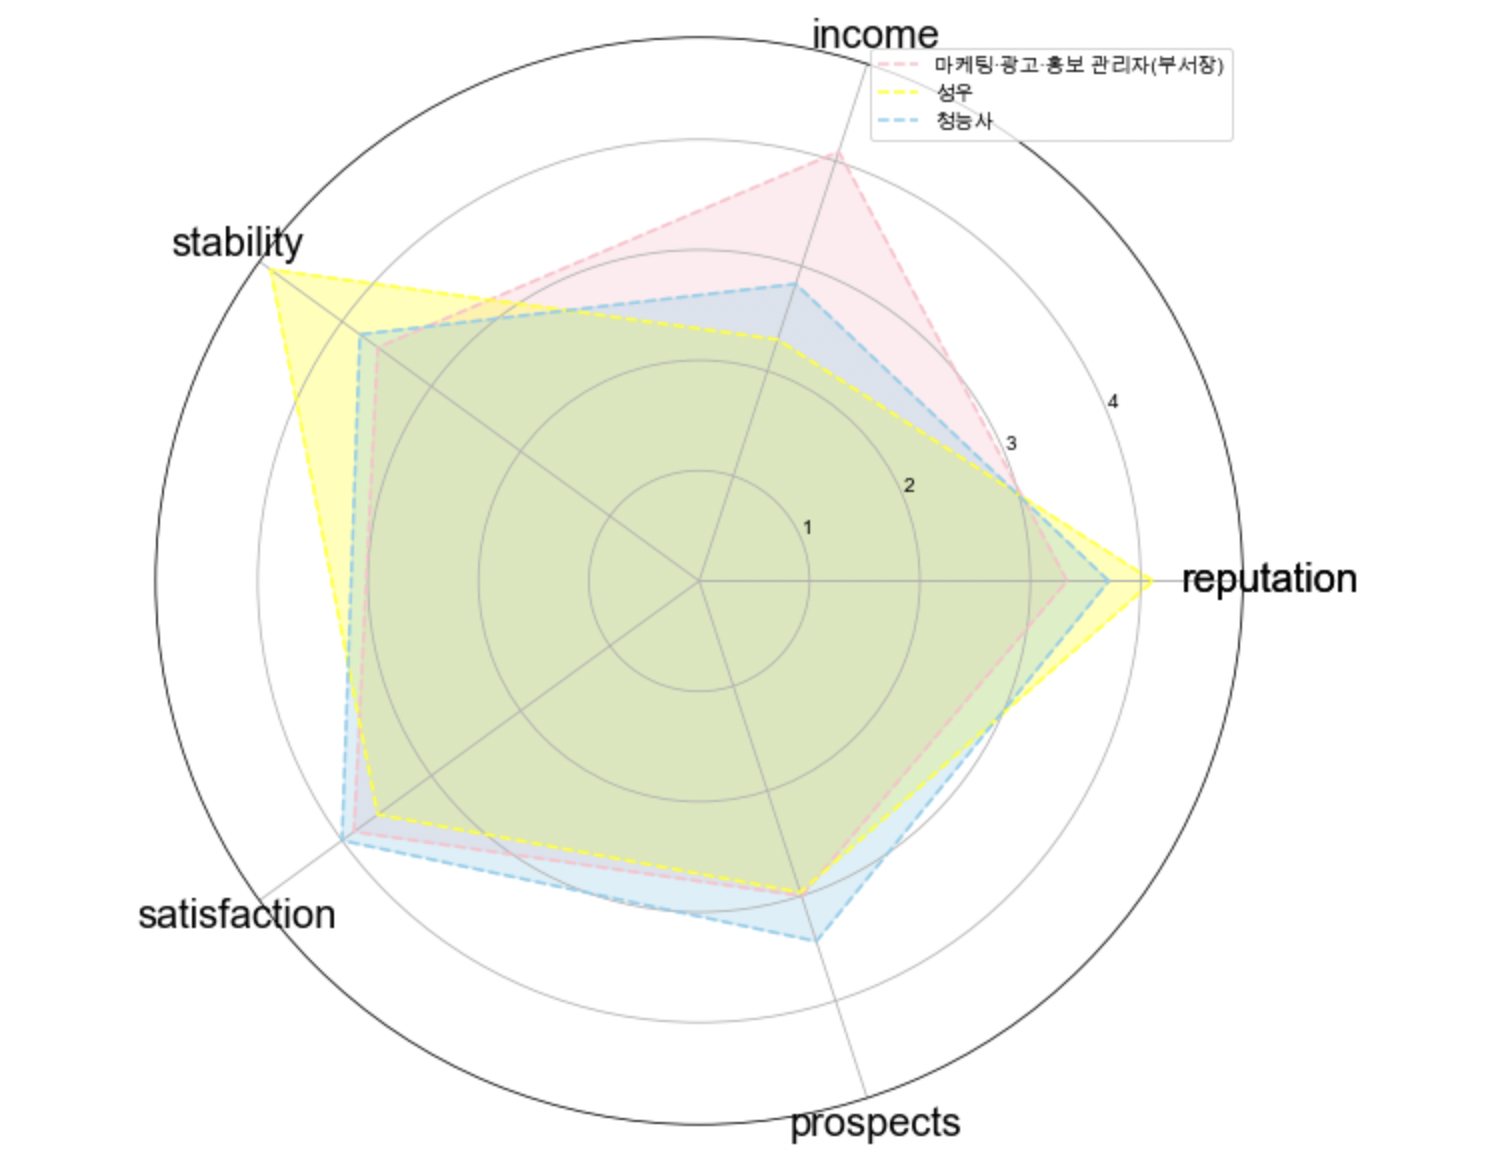
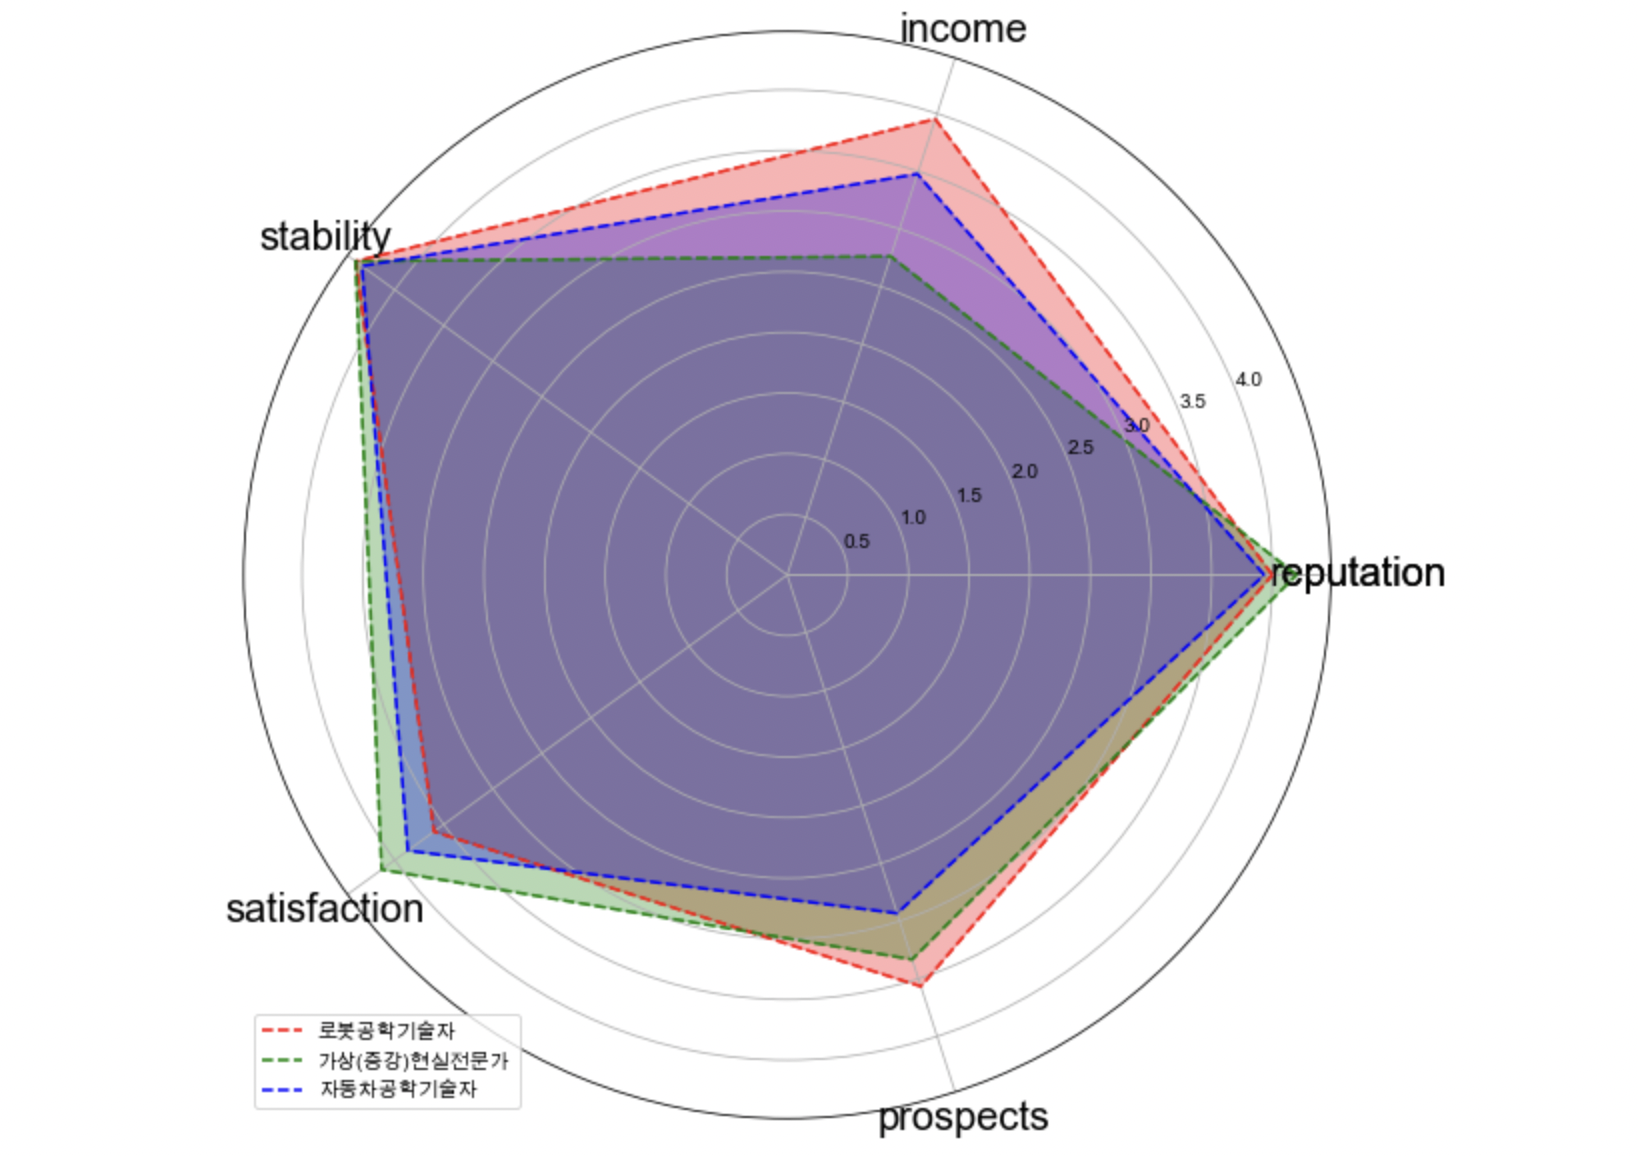
저는 이번에 <직업 추천 시스템>을 만드는 머신러닝 프로젝트를 진행하면서 직무만족도, 사회적 평판, 평균 연봉, 직업 안정성, 직업 전망 등의 지표들을 종합한 순위를 반영하여 나에게 맞는 추천 직업 Best3! 를 보여주는 시각화 도구로 이 레이더 차트가 가장 먼저 떠올라서 파이썬 matplotlib 라이브러리를 사용해 구현을 해보았답니다😎
dict1={'reputation':result_3.iloc[0,0],
       'income': result_3.iloc[0,1],
       'stability': result_3.iloc[0,2],
       'satisfaction': result_3.iloc[0,3],
       'prospects': result_3.iloc[0,4] }
dict2={'reputation':result_3.iloc[1,0],
       'income': result_3.iloc[1,1],
       'stability': result_3.iloc[1,2],
       'satisfaction': result_3.iloc[1,3],
       'prospects': result_3.iloc[1,4] }
dict3={'reputation':result_3.iloc[2,0],
       'income': result_3.iloc[2,1],
       'stability': result_3.iloc[2,2],
       'satisfaction': result_3.iloc[2,3],
       'prospects': result_3.iloc[2,4] }

categories1=list(dict1.keys()) #xticks 설정을 위한 기본값
categories1=[*categories1, categories1[0]]

numbers1=list(dict1.values())
numbers1=[*numbers1, numbers1[0]]

numbers2=list(dict2.values())
numbers2=[*numbers2, numbers2[0]]

numbers3=list(dict3.values())
numbers3=[*numbers3, numbers3[0]]

label_loc=np.linspace(start=0, stop=2*np.pi, num=len(numbers1))
plt.figure(figsize=(10,10))
ax=plt.subplot(polar=True)
plt.xticks(label_loc, labels=categories1, fontsize=20)

ax.plot(label_loc, numbers1, label=jobdict[result_idx[0]], linestyle='dashed', color='pink')
ax.fill(label_loc, numbers1, color='pink', alpha=0.3)

ax.plot(label_loc, numbers2, label=jobdict[result_idx[1]], linestyle='dashed', color='yellow')
ax.fill(label_loc, numbers2, color='yellow', alpha=0.3)

ax.plot(label_loc, numbers3, label=jobdict[result_idx[2]], linestyle='dashed', color='skyblue')
ax.fill(label_loc, numbers3, color='skyblue', alpha=0.3)

ax.legend()
plt.show()
과연... 결과는!?!?!?!!?
Ta-da-!


예쁘지 않나요?! 😆😋
확실히 직접 만든 시각화 결과물들은 애정이 갈수밖에 없는 거 같아요ㅎㅎ
이렇게 시각화 기법들을 하나씩 구현해나가는 재미가 쏠쏠하답니닿ㅎ
저는 데이터 분석 과정 중에 시각화 할 때가 가장 재미있는 것 같아요 ㅋㅋㅋ
Visualization Master가 되는 그날까지! 화이팅!
