Pixie 소개
2022.03. 한승호 📧 tmdgh663@gmail
📓 https://grizzled-yoke-68e.notion.site/Pixie-9c778eead02f42a5a17f2e58290257c5
1. Pixie
1.1 Pixie 소개
- Pixie는 eBPF (Berkeley Packet Filter)를 기반으로 쿠버네티스 환경의 디버깅을 제공하는 관측성 도구(observability tool)입니다.
- Pixie를 배포하면 쿠버네티스 리소스나 애플리케이션 레벨의 자동 원격 측정이 가능해지며, 스크립트 언어(PxL)를 통해 사용자 정의 리소스를 측정할 수 있습니다.
- Pixie는 경량화된 도구로 클러스터 CPU의 5% 미만을 사용합니다.
- 아직 정식 출시버전이 아닌 베타 버전임을 참고해주세요!
- 베타 버전으로 특정 언어(Go, C, Rust) 에서만 제공하는 디버깅 기능들이 존재합니다.
1.2 아키텍처 소개
.png)
https://docs.pixielabs.ai/about-pixie/what-is-pixie/
- Pixie Edge Module(PEM) : 노드별로 설치된 Pixie의 에이전트. PEM은 eBPF를 사용하여 노드에 로컬로 저장된 데이터를 수집합니다.
- Vizier : 클러스터별로 설치된 Pixie의 수집기. 쿼리 실행 및 PEM 관리를 담당합니다.
- Pixie Cloud : UI를 호스팅하고 계정(사용자, 조직) 및 Kubernetes 제어 데이터(클러스터 이름, 노드 수 등)와 관련된 제한된 메타데이터를 저장합니다.
- Pixie는 원격 측정 도구로 클러스터 내부 데이터가 외부로 전달됩니다. Pixie Cloud와의 모든 통신은 TLS로 암호화됩니다.
- Pixie CLI : Pixie를 배포하는 데 사용됩니다. 쿼리를 실행하고 API 키와 같은 리소스를 관리하는 데 사용할 수도 있습니다.
- Pixie 클라이언트 API : Pixie에 대한 프로그래밍 방식 액세스에 사용됩니다(예: Pixie 데이터를 입력으로 요구하는 통합, Slackbot 및 사용자 정의 사용자 로직)
1.3 BPF/eBPF 소개
Pixie는 eBPF를 사용하여 데이터 수집의 대부분을 수행합니다. eBPF를 쉽게 이해하기 위해서는 리눅스 네트워크 스택과 BPF에 대한 이해가 필요합니다. 쉬운 이해를 위해 KANS 스터디에서 제공해주신 내용을 공유합니다.
- Linux Network Stack : 리눅스 네트워크 스택의 단점은 복잡하고, 변경에 시간이 걸리고, 레이어를 건너뛰기 어렵습니다.
.png)
https://bit.ly/3EiLsU3
- IPtables 단점
.png)
.png)
- 쿠버네티스는 Kube-proxy가 생성한 Iptables를 기반으로 클러스터 노드간 라우팅됩니다.
- Kube-proxy가 Iptables 를 자동으로 관리해주지만, rule 숫자에 따라 통신 Latency가 증가됩니다.
- 일반적으로 파드 배포시 Iptables가 배수로 증가합니다.
- BPF (Berkeley Packet Filter) kernel hooks : BPF는 커널에 삽입하여 패킷을 통제(필터링) 할 수 있으며, 다양한 영역에서 Hook 을 통해서 접근 할 수 있습니다.
.png)
- eBPF(extended Berkeley Packet Filter) - 링크
- BPF(1992년) 를 확장해서 eBPF가 (2014년, Alexei Starovoitov) 가 나왔고, eBPF를 다양한 영역 (보안, 추적, 네트워킹, 모니터링)에서 활용하기 시작하였습니다.
.png)
https://ebpf.io/
.png)
BPF based tail calls (꼬리 물리) : Return 에서 함수 호출 - eBPF는 Linux Kernel에 내장되어 시스템의 변경 없이 단순히 시스템 호출을 통해 요청을 처리 합니다.
- eBPF는 iptables를 사용하지 않고 eBPF를 통해 라우팅을 단순화 시키고, Packet 처리할 수 있게 되었습니다!
- BPF(1992년) 를 확장해서 eBPF가 (2014년, Alexei Starovoitov) 가 나왔고, eBPF를 다양한 영역 (보안, 추적, 네트워킹, 모니터링)에서 활용하기 시작하였습니다.
2. Pixie 배포
🔨 **구성환경** - EKS Kubernetes Worker AMI with AmazonLinux2 image - k8s: 1.21.5 (EKS) - docker: 20.10.7-5.amzn2 - worker node 3대 : t3a.medium(vCPU: 2, GiB :4)-
배포 및 Pixie 클라우드 연동
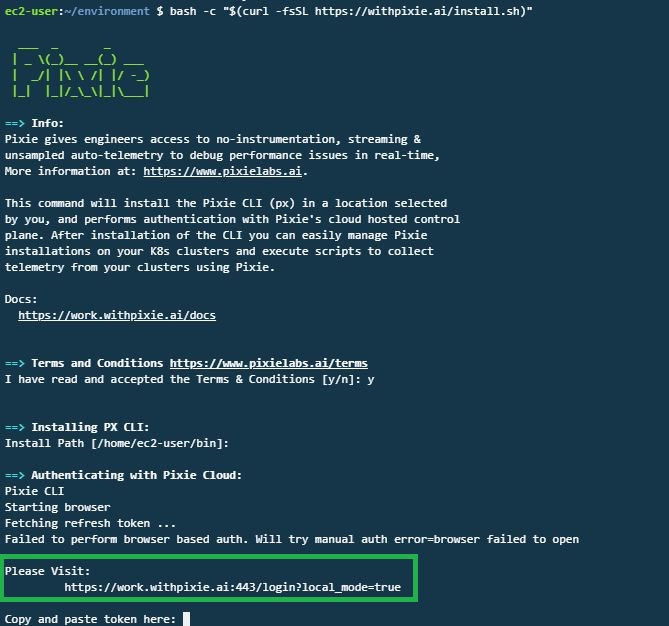
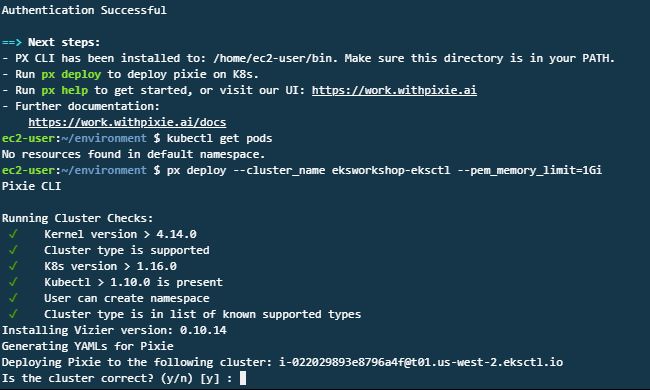
# Pixie CLI 설치
bash -c "$(curl -fsSL https://withpixie.ai/install.sh)"
> # 접근 토큰 입력 필요!
> # 접근 토큰은 Pixie 사이트에서 회원가입시 발급됩니다.

# Pixie 배포
px deploy --cluster_name eksworkshop-eksctl --pem_memory_limit=1Gi
클라우드 연동을 위해 Pixie 사이트로 접속하여 회원가입 후, 접근 토큰을 발급받아 등록합니다.
접근 토큰 등록 후, px cli 를 통해 pixie 배포!
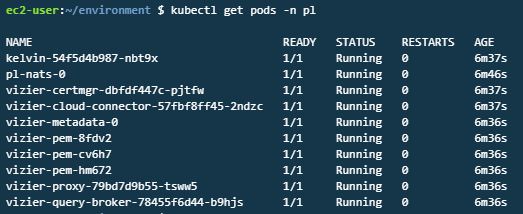
pixie 배포 확인
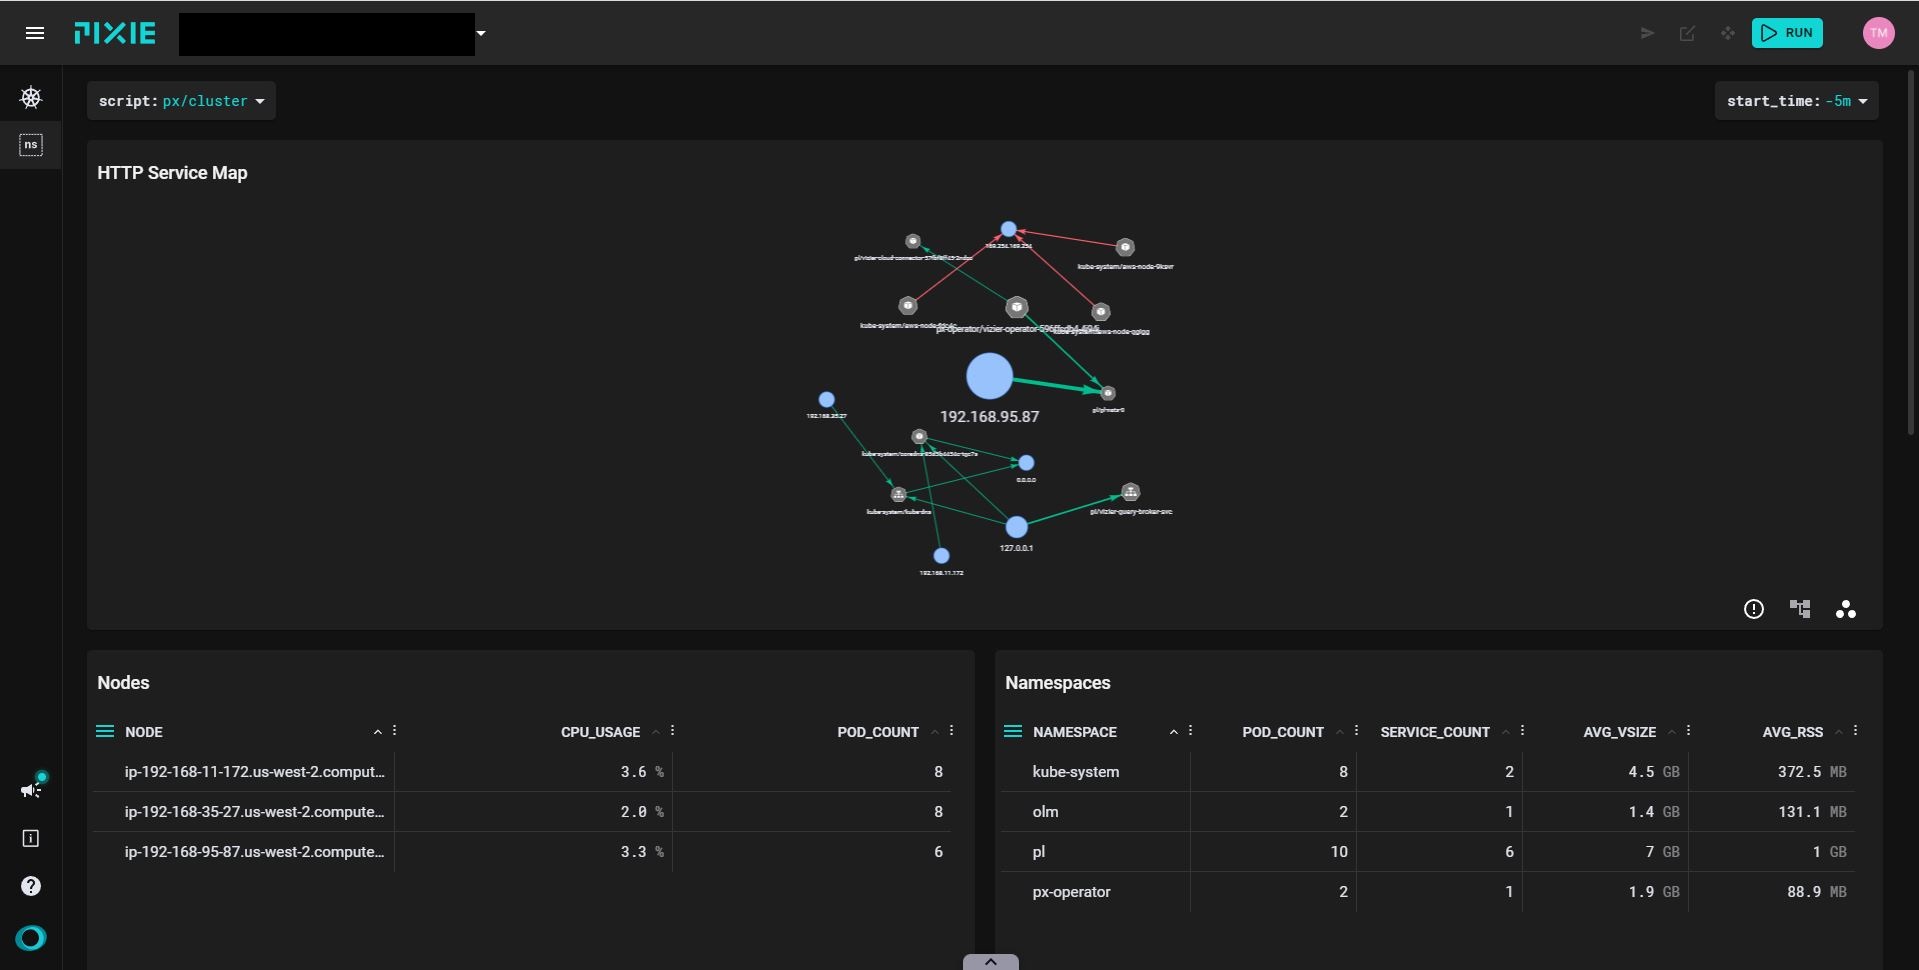
pixie 배포 이후 pixie 사이트(https://work.withpixie.ai:443 )에서 대시보드 확인이 가능합니다.
-
MSA 샘플 예제 배포
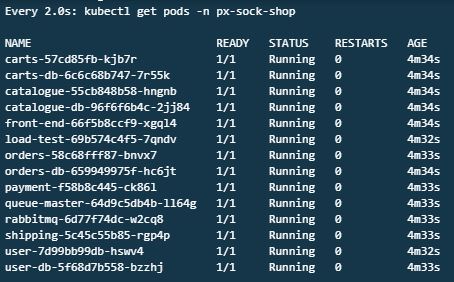
# sock shop yaml 다운 및 배포
curl -O https://raw.githubusercontent.com/pixie-labs/pixie-demos/main/eks-workshop/complete-demo.yaml
kubectl apply -f complete-demo.yaml

# 배포 확인
kubectl get pods -n px-sock-shop

# sock shop 접속
export SERVICE_IP=$(kubectl -n px-sock-shop get svc front-end --template "{{ range (index .status.loadBalancer.ingress 0) }}{{ . }}{{ end }}")
echo http://$SERVICE_IP/
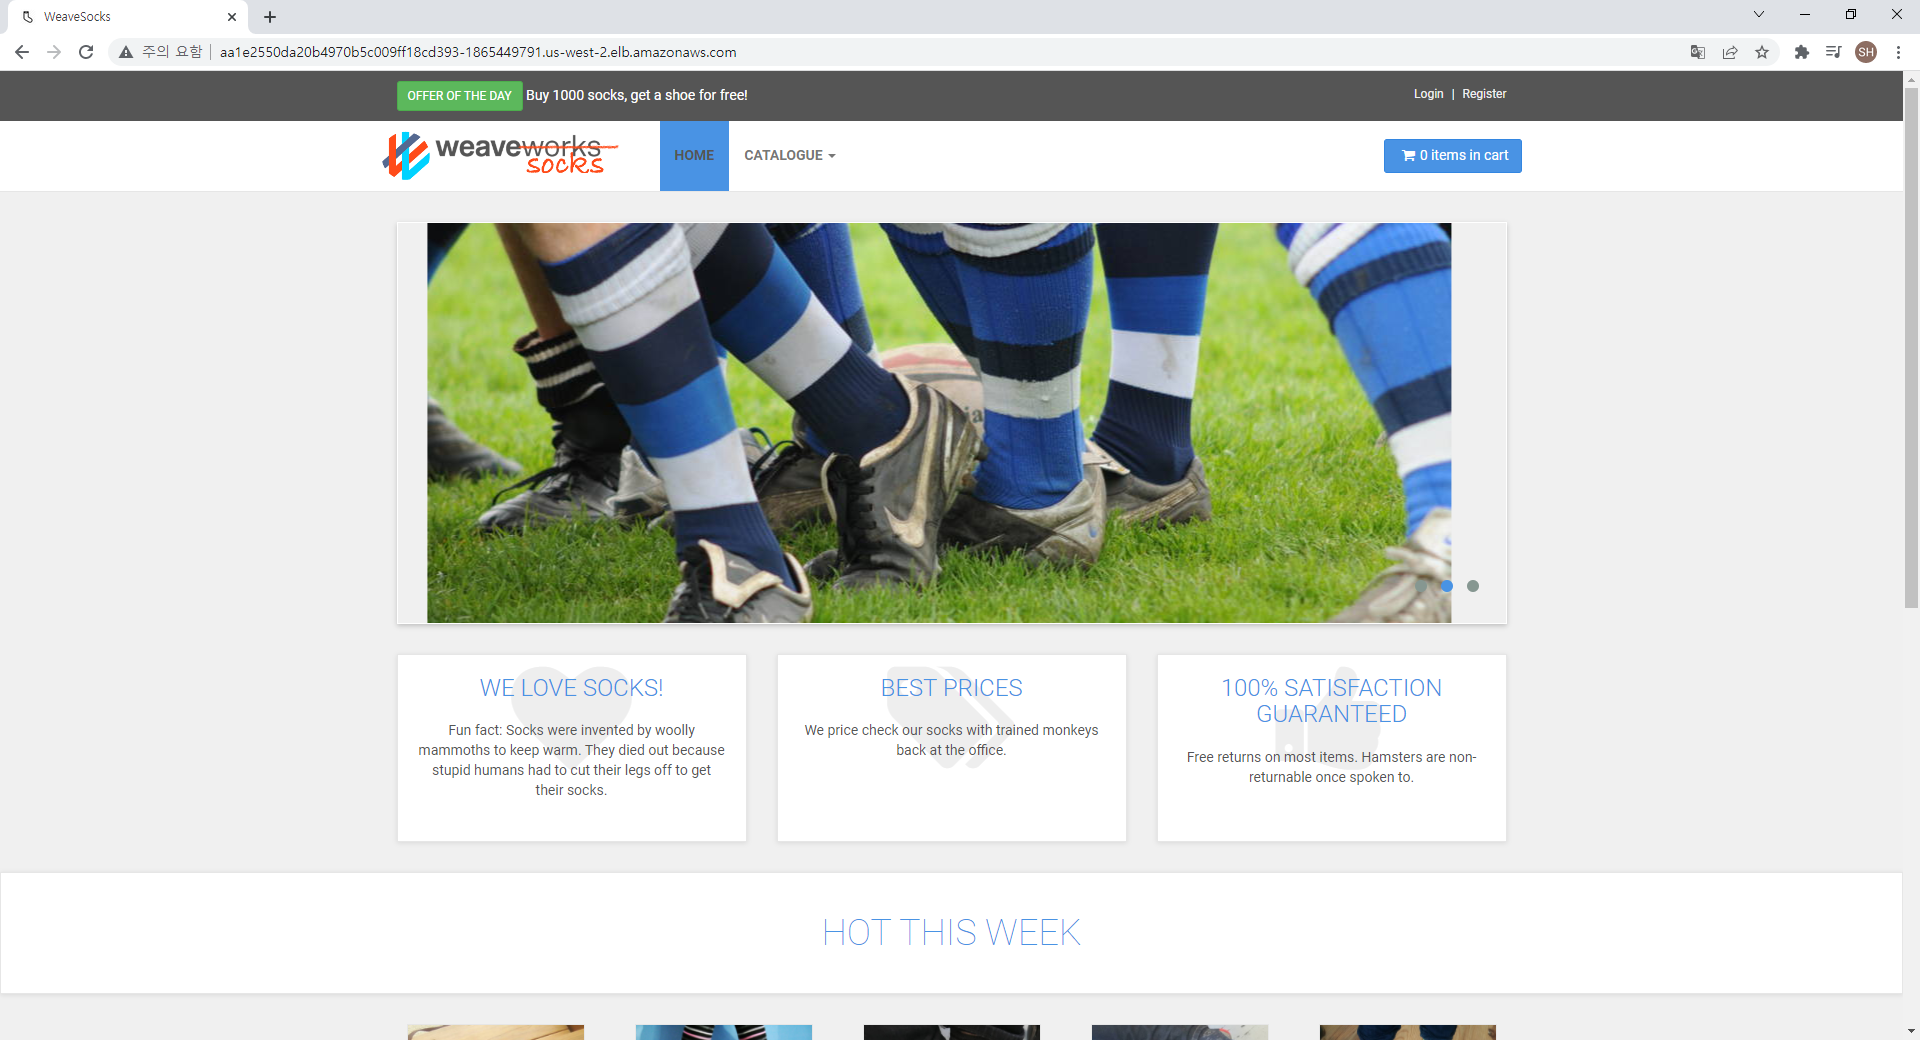
sock 접속 확인3. Auto-telemetry
- Pixie는 eBPF를 사용하여 데이터 수집의 대부분을 자동으로 수행합니다.
.png)
eBPF를 사용한 Pixie 프로토콜 추적([https://docs.pixielabs.ai/about-pixie/pixie-ebpf/](https://docs.pixielabs.ai/about-pixie/pixie-ebpf/)) - 데이터를 자동으로 수집하는 범위는 프로토콜 추적, 리소스 메트릭, 네트워크 메트릭, JVM 메트릭, 애플리케이션 CPU 프로필(Go, Rust, C/C++) 입니다.
- 사용자 정의의 PxL 스크립트를 통해 수집한 원격 측정 데이터(DNS 이벤트, HTTP 이벤트 등)를 쿼리할 수 있으며, 새 데이터 소스(기본적으로 수집하는 데이터 소스 외에)를 수집할 수 있습니다.
- Pixie 대시보드에 다양한 메트릭을 확인할 수 있는 PxL 스크립트를 기본적으로 제공합니다. 스크립트 기능 확인 및 코드는 Pixie 깃허브에서 확인이 가능합니다.
.png)
기본 PxL 스크립트 제공
- 인프라 모니터링
-
클러스터 리소스 대시보드
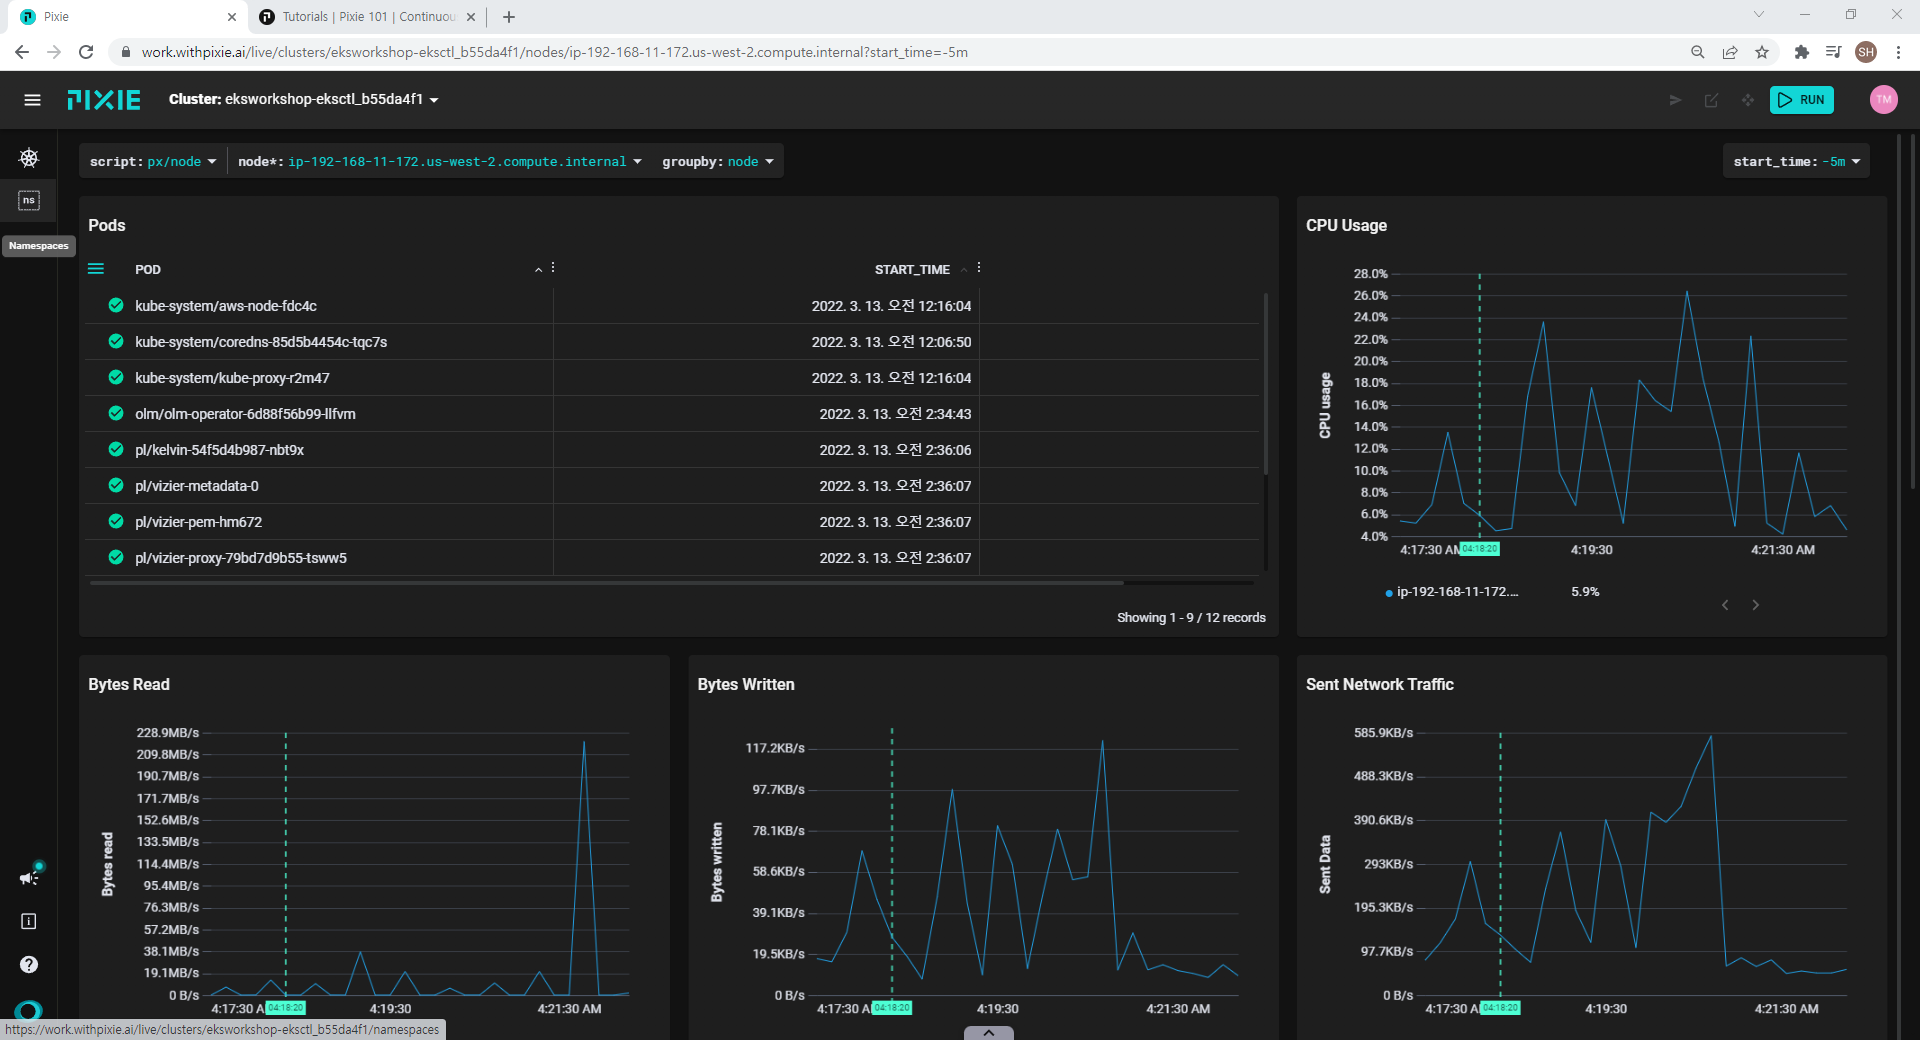
노드 대시보드
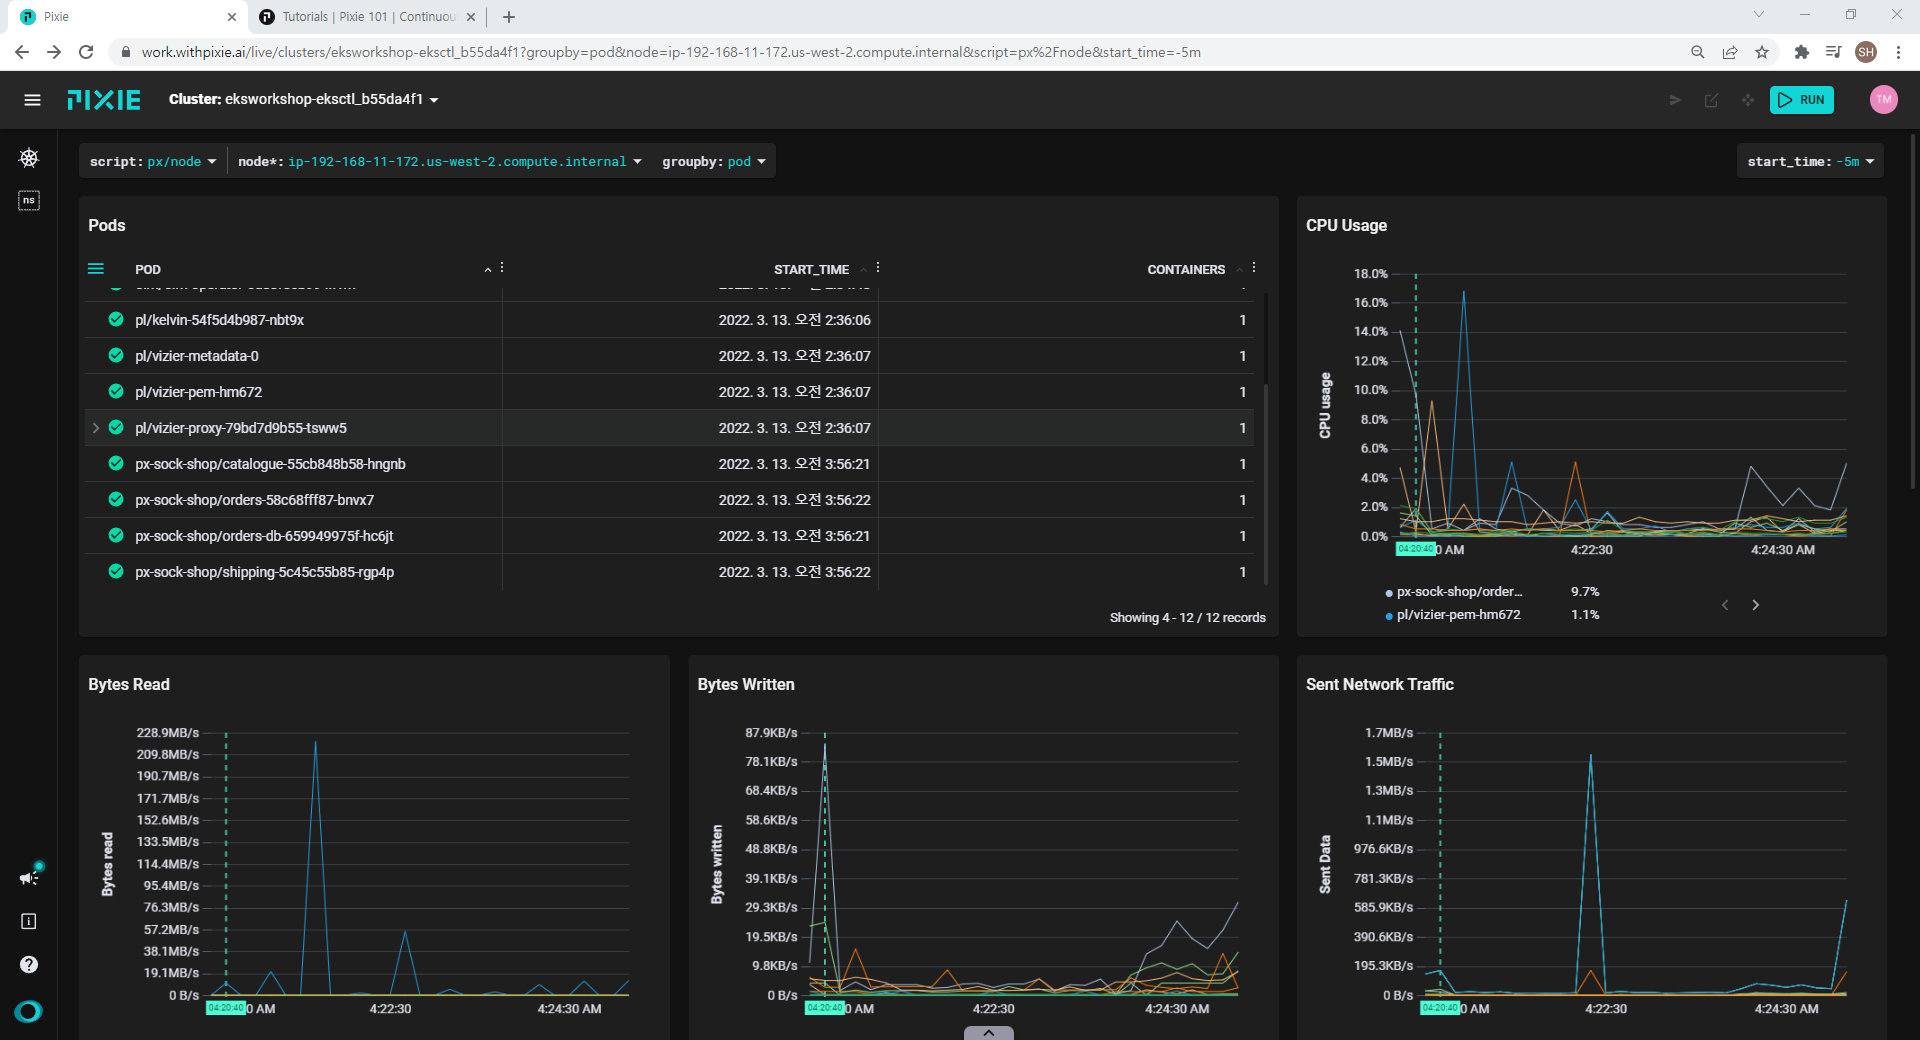
파드 대시보드
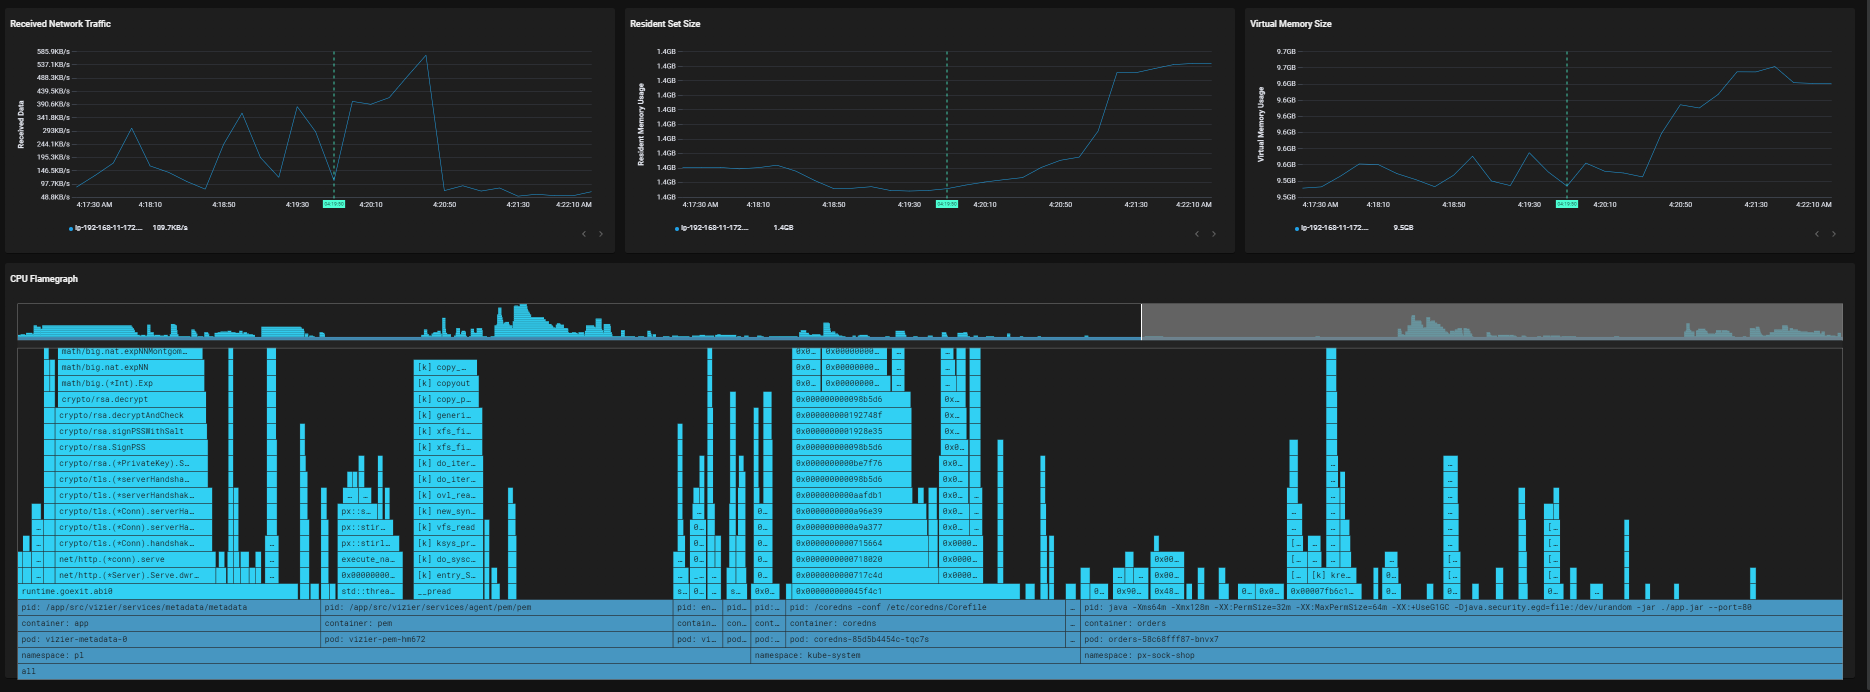
노드 대시보드 내 애플리케이션 프로파일링 기능 제공 (C++, Go, Rust 언어만 지원)
-
네트워크 대시보드
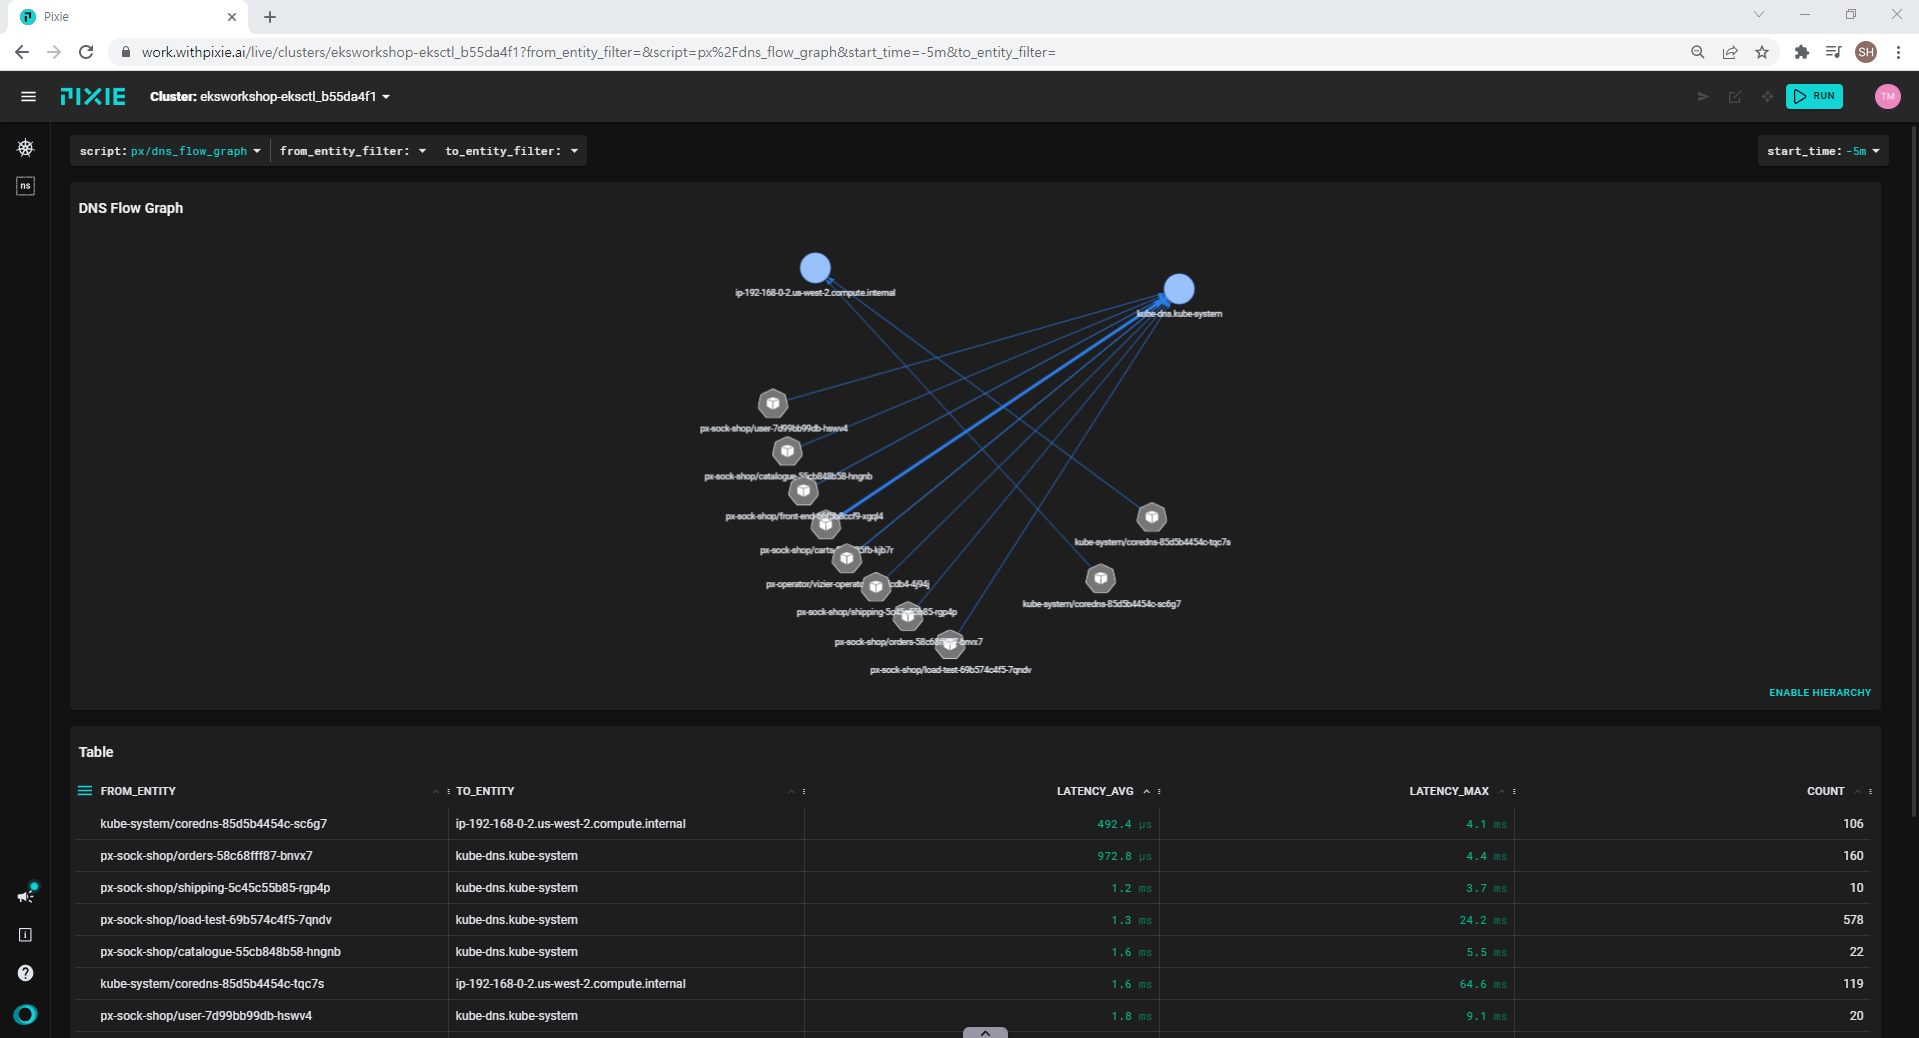
DNS 플로우 대시보드
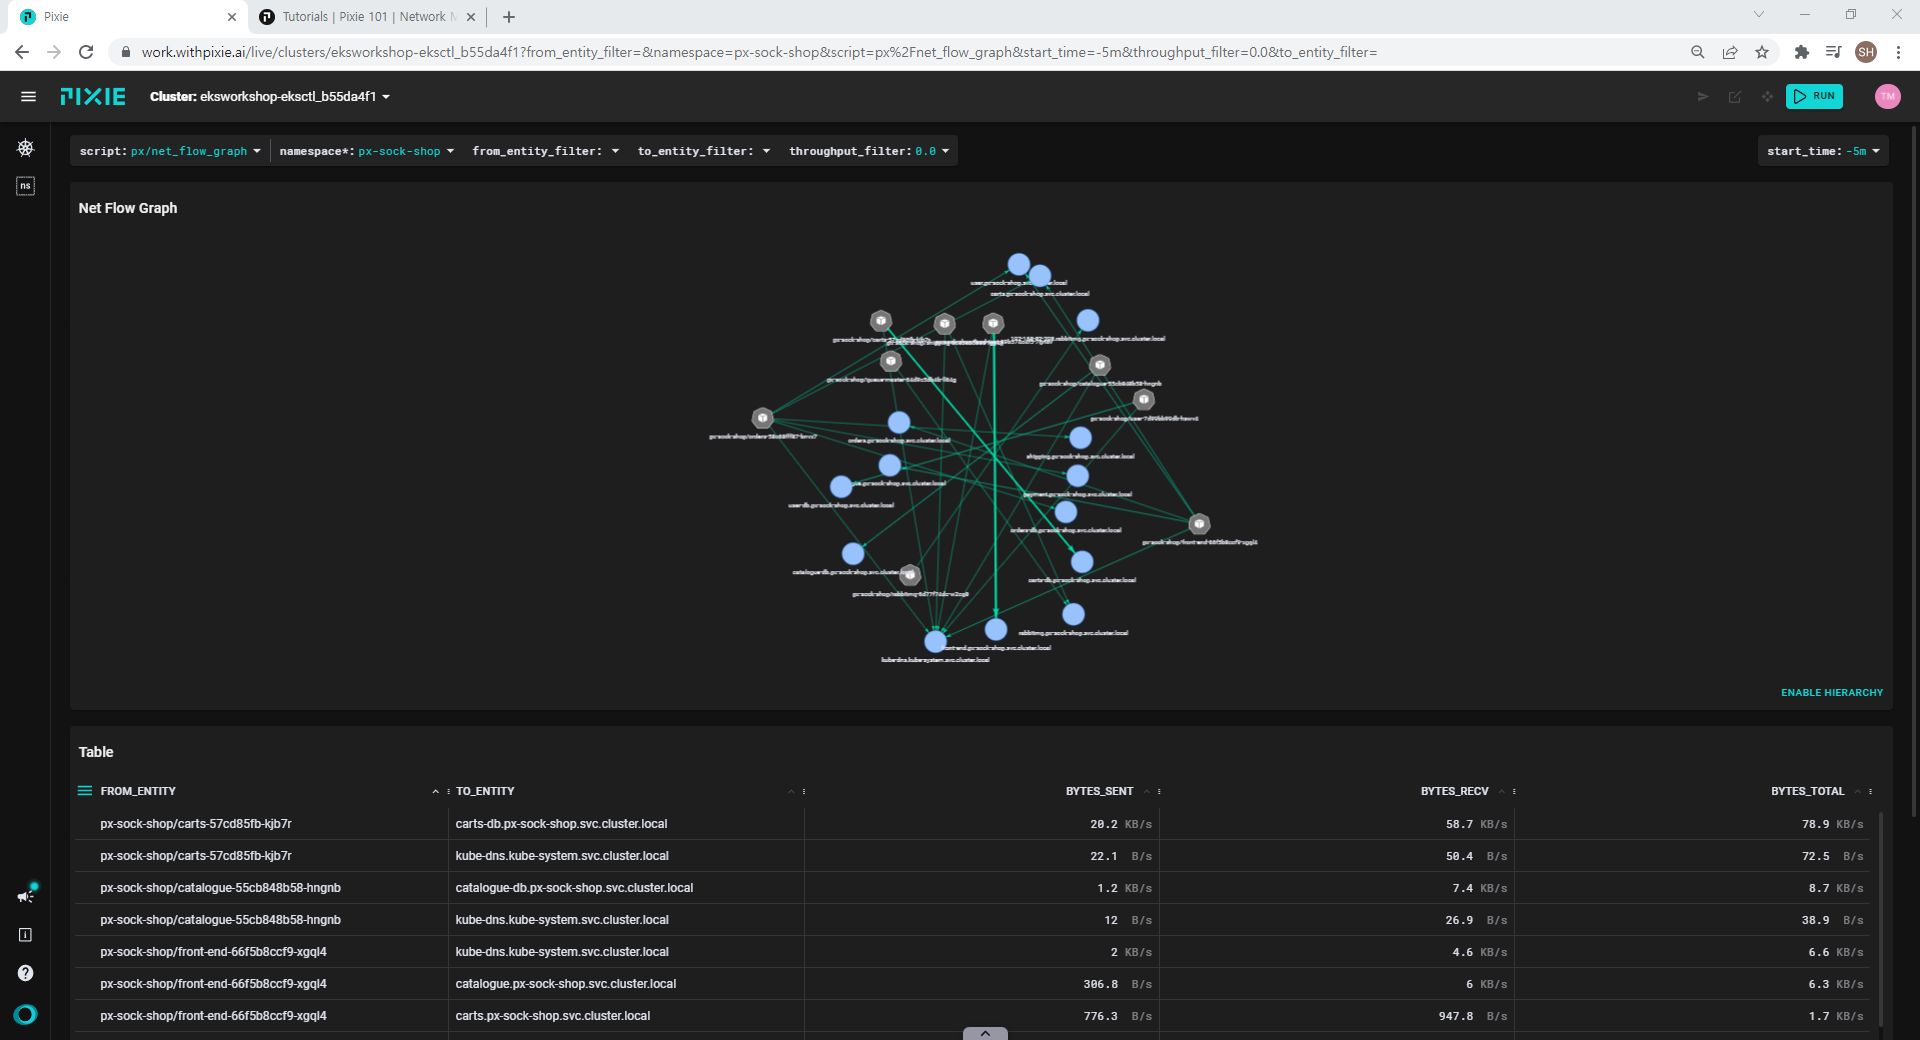
네트워크 플로우 대시보드
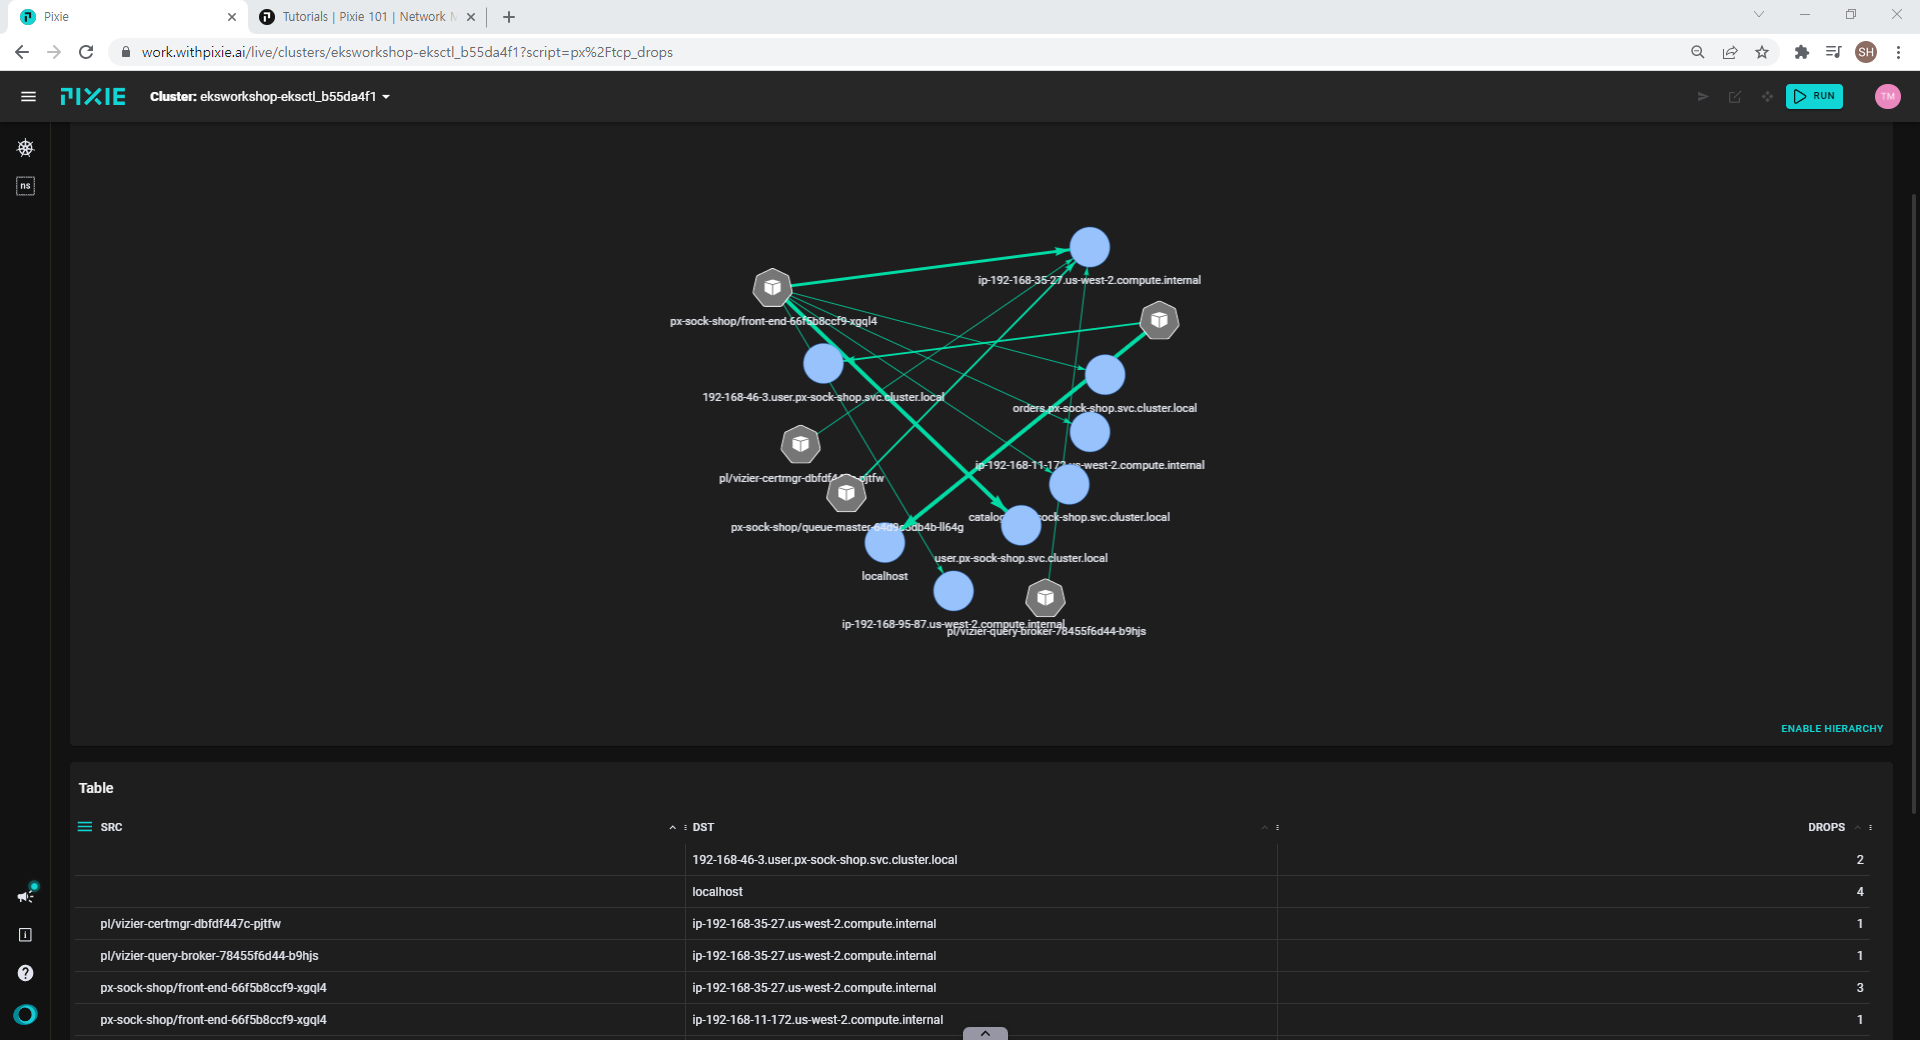
tcp drop 대시보드
-
- 네트워크 트레이싱
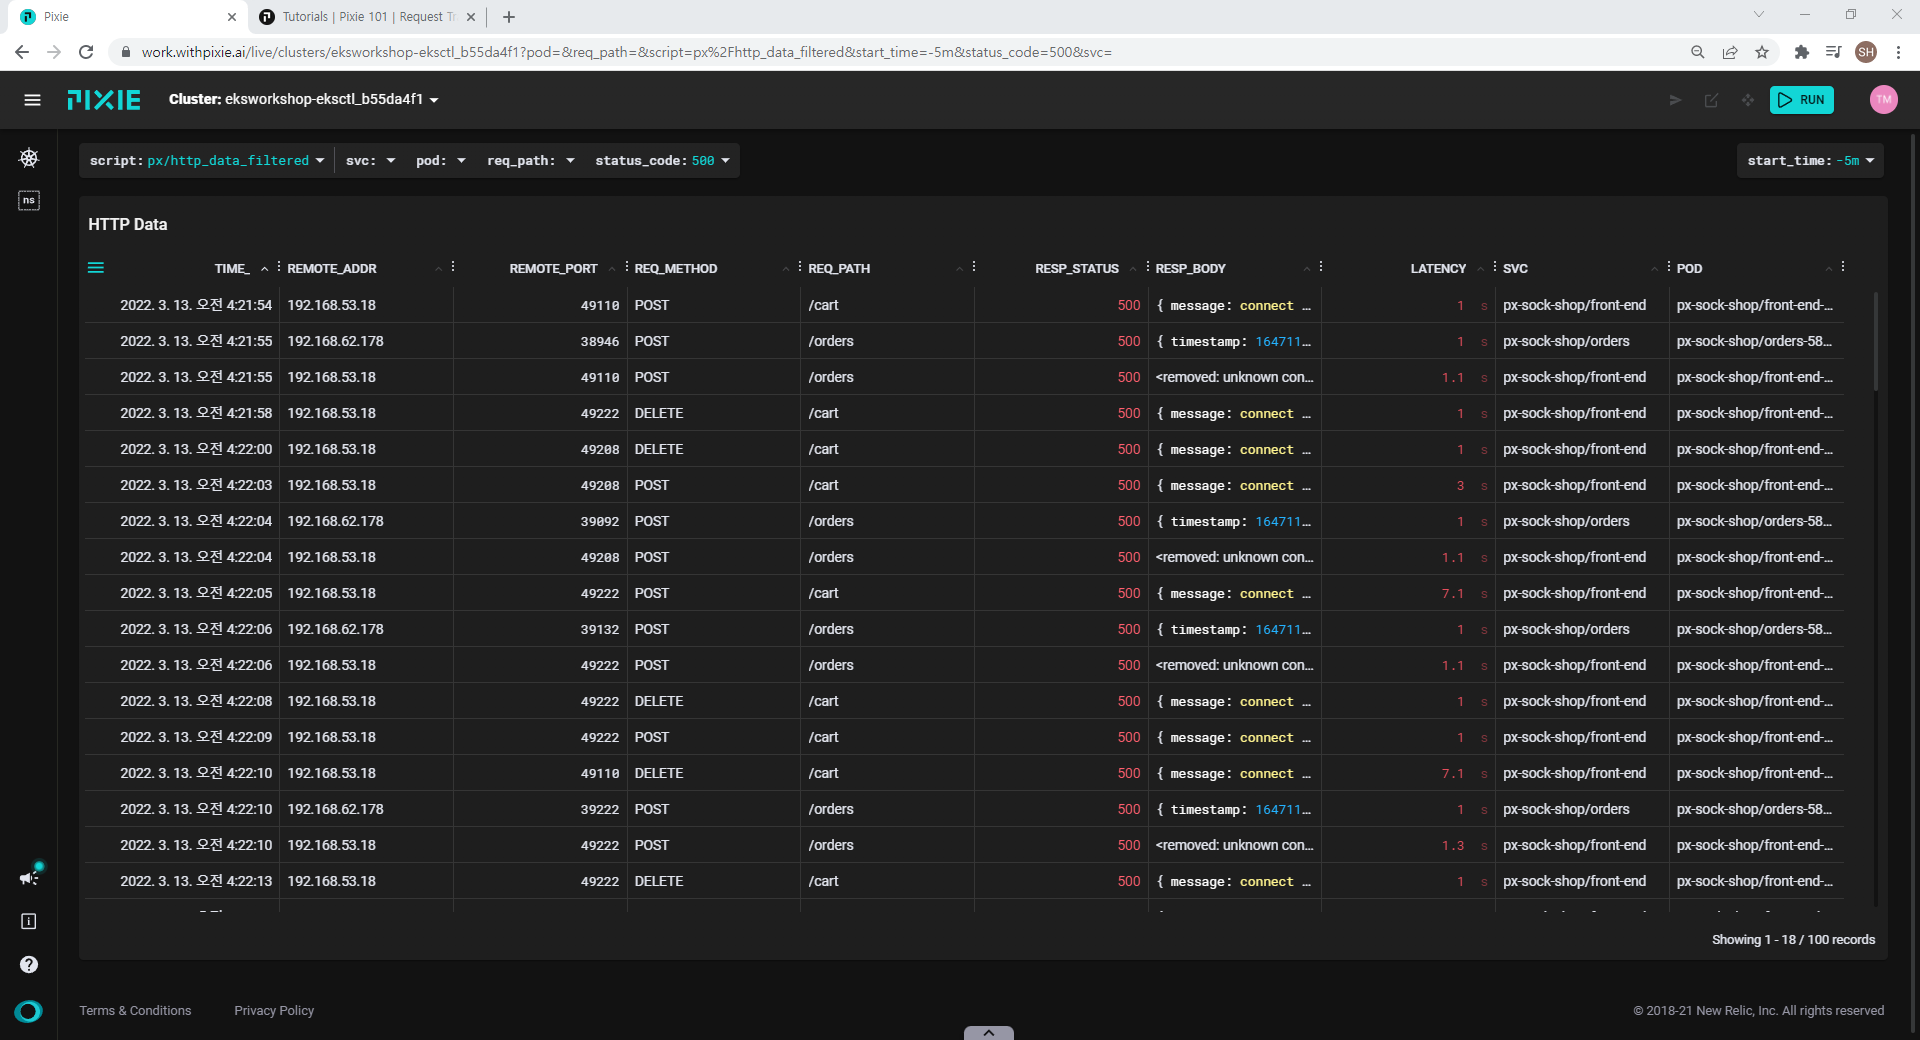 net-filter 대시보드
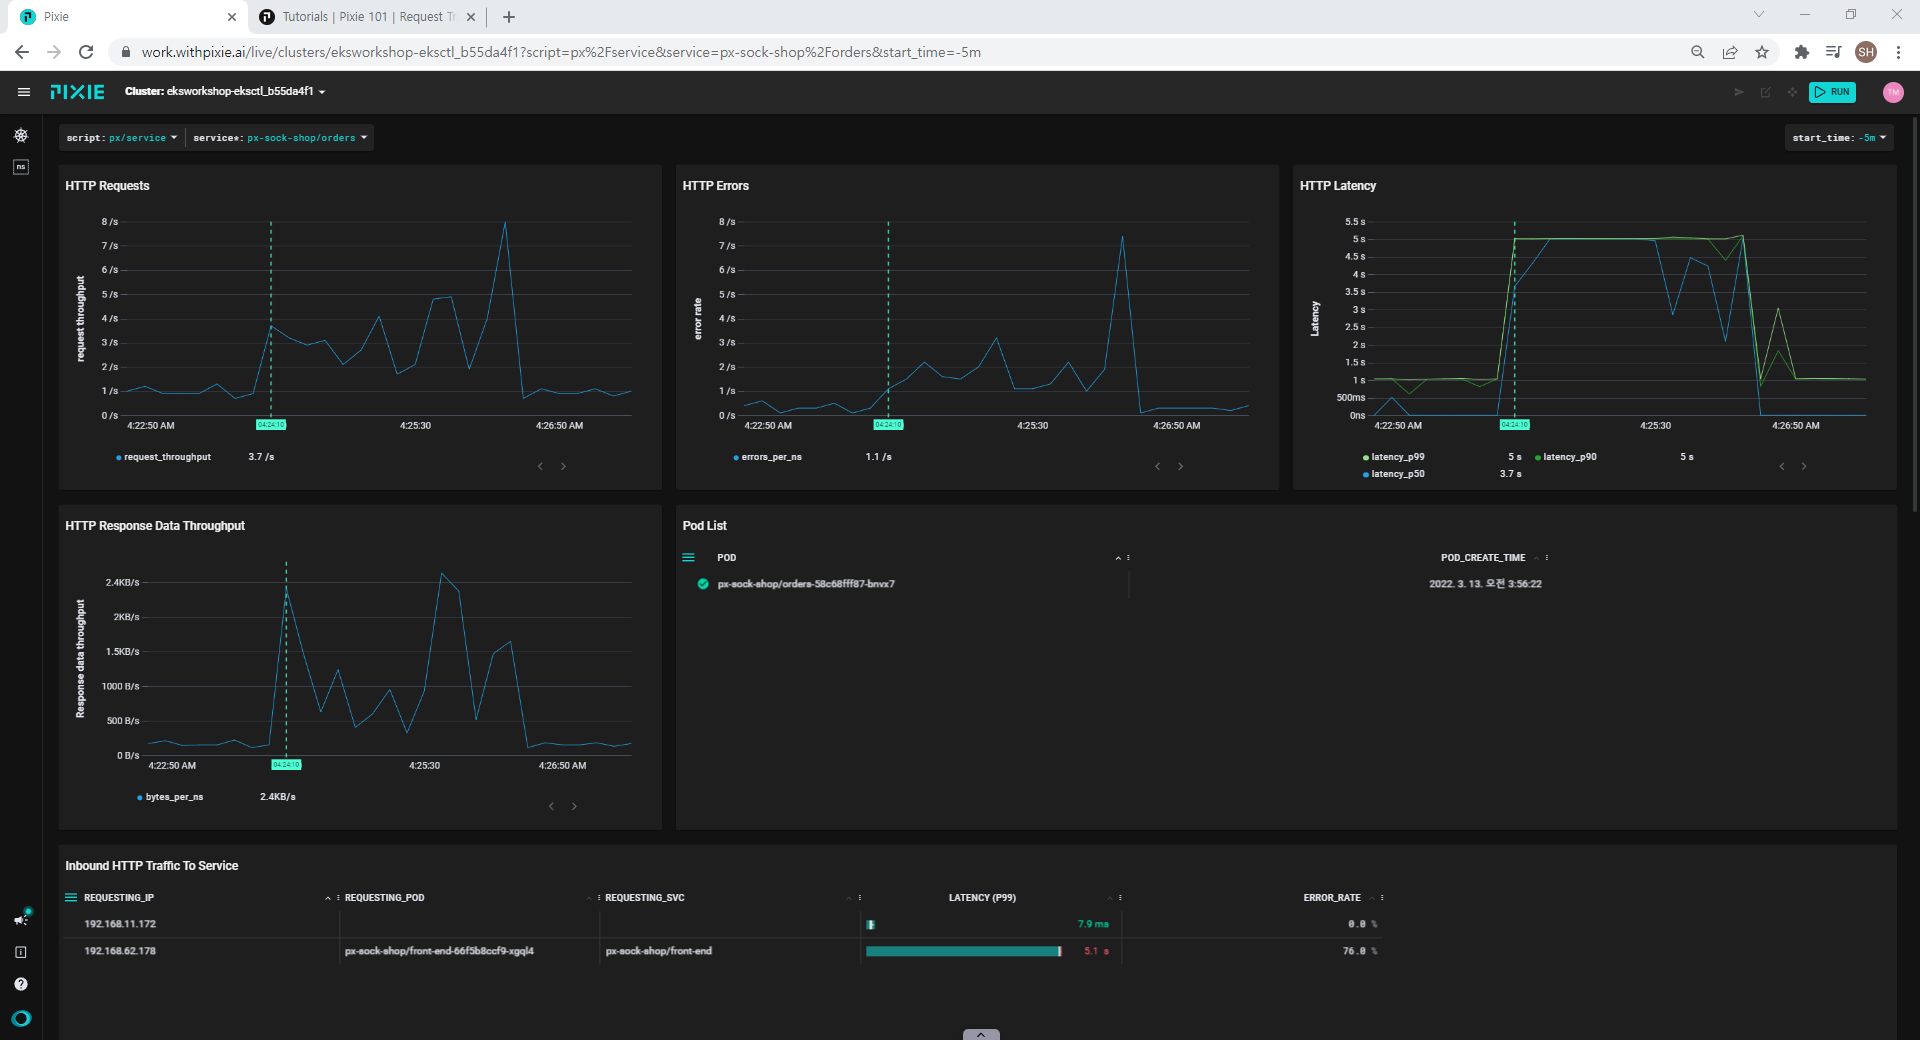
서비스 대시보드(p50, p99 지표 제공)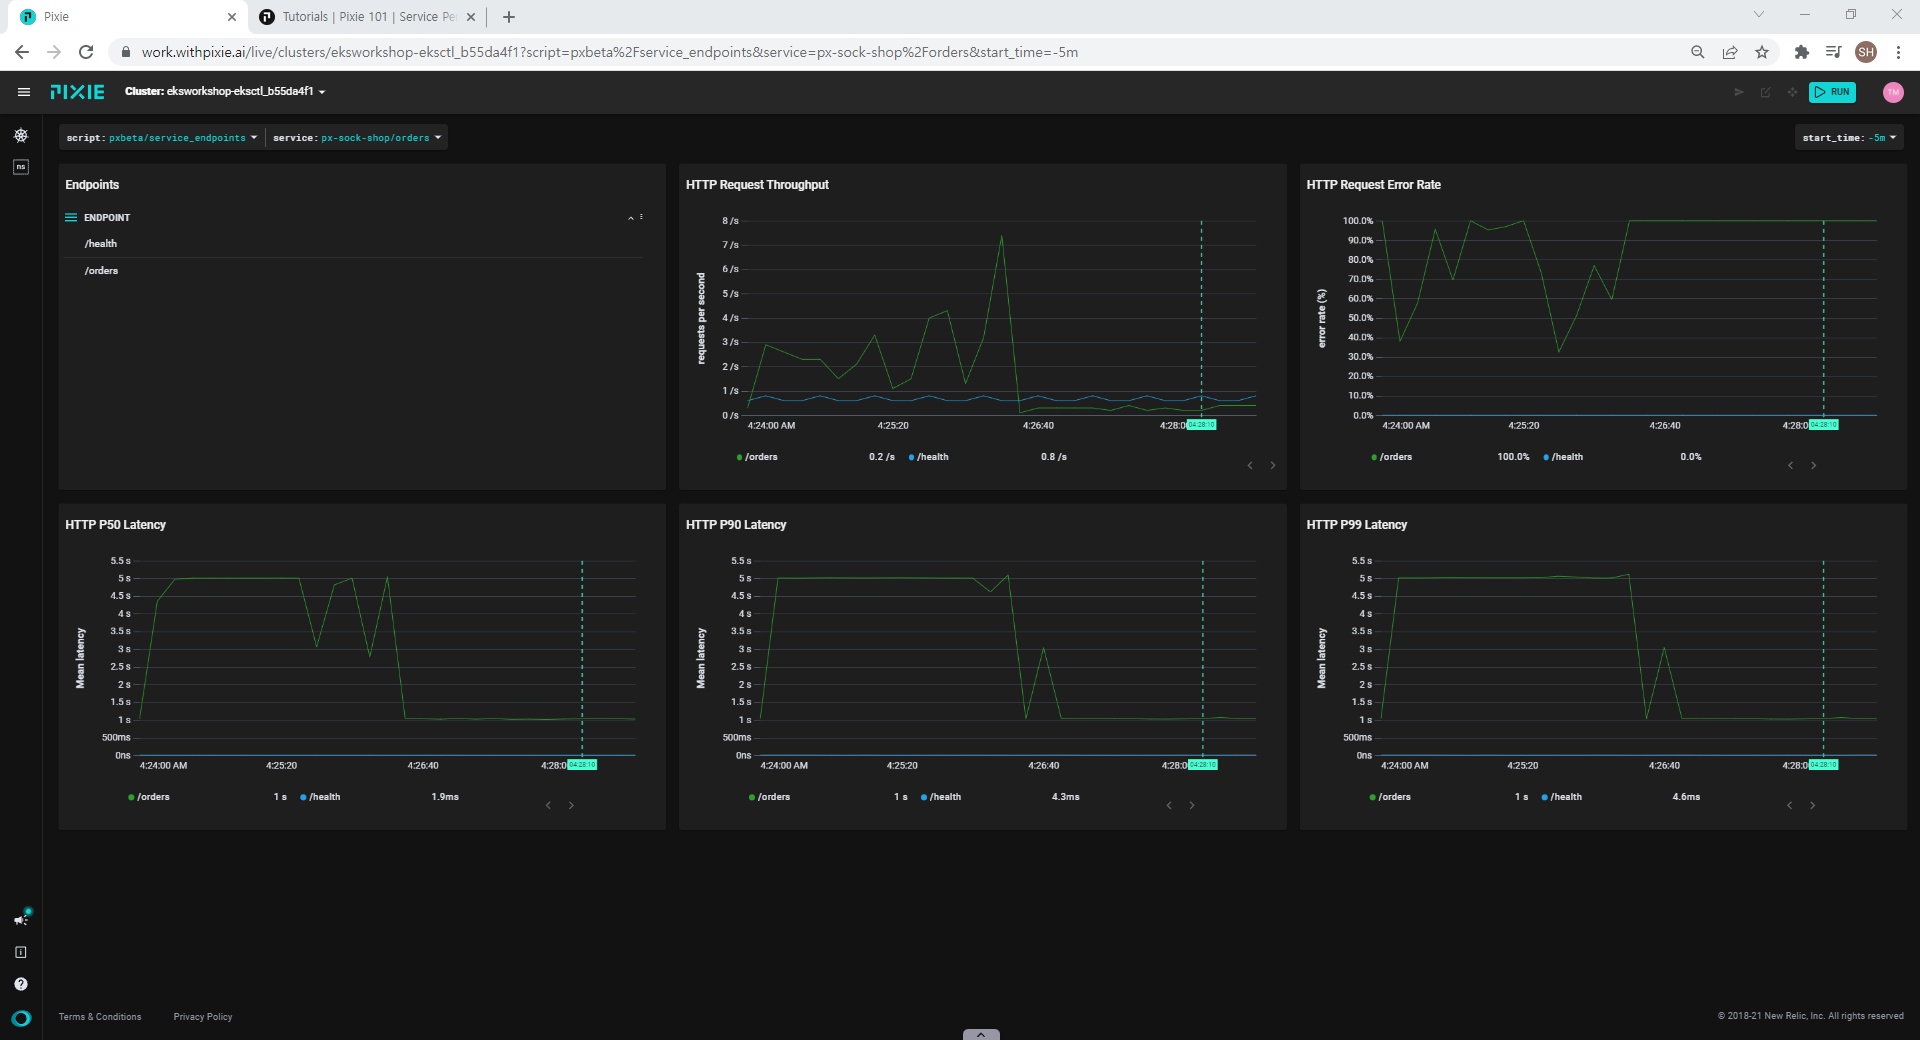
endpoint 대시보드
- Kafka 모니터링
# Kafka 데모 MSA 예제 배포
px demo deploy px-kafka
#파드 확인
kubectl get pods -n px-kafka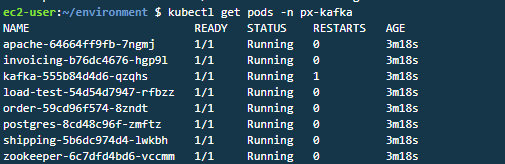
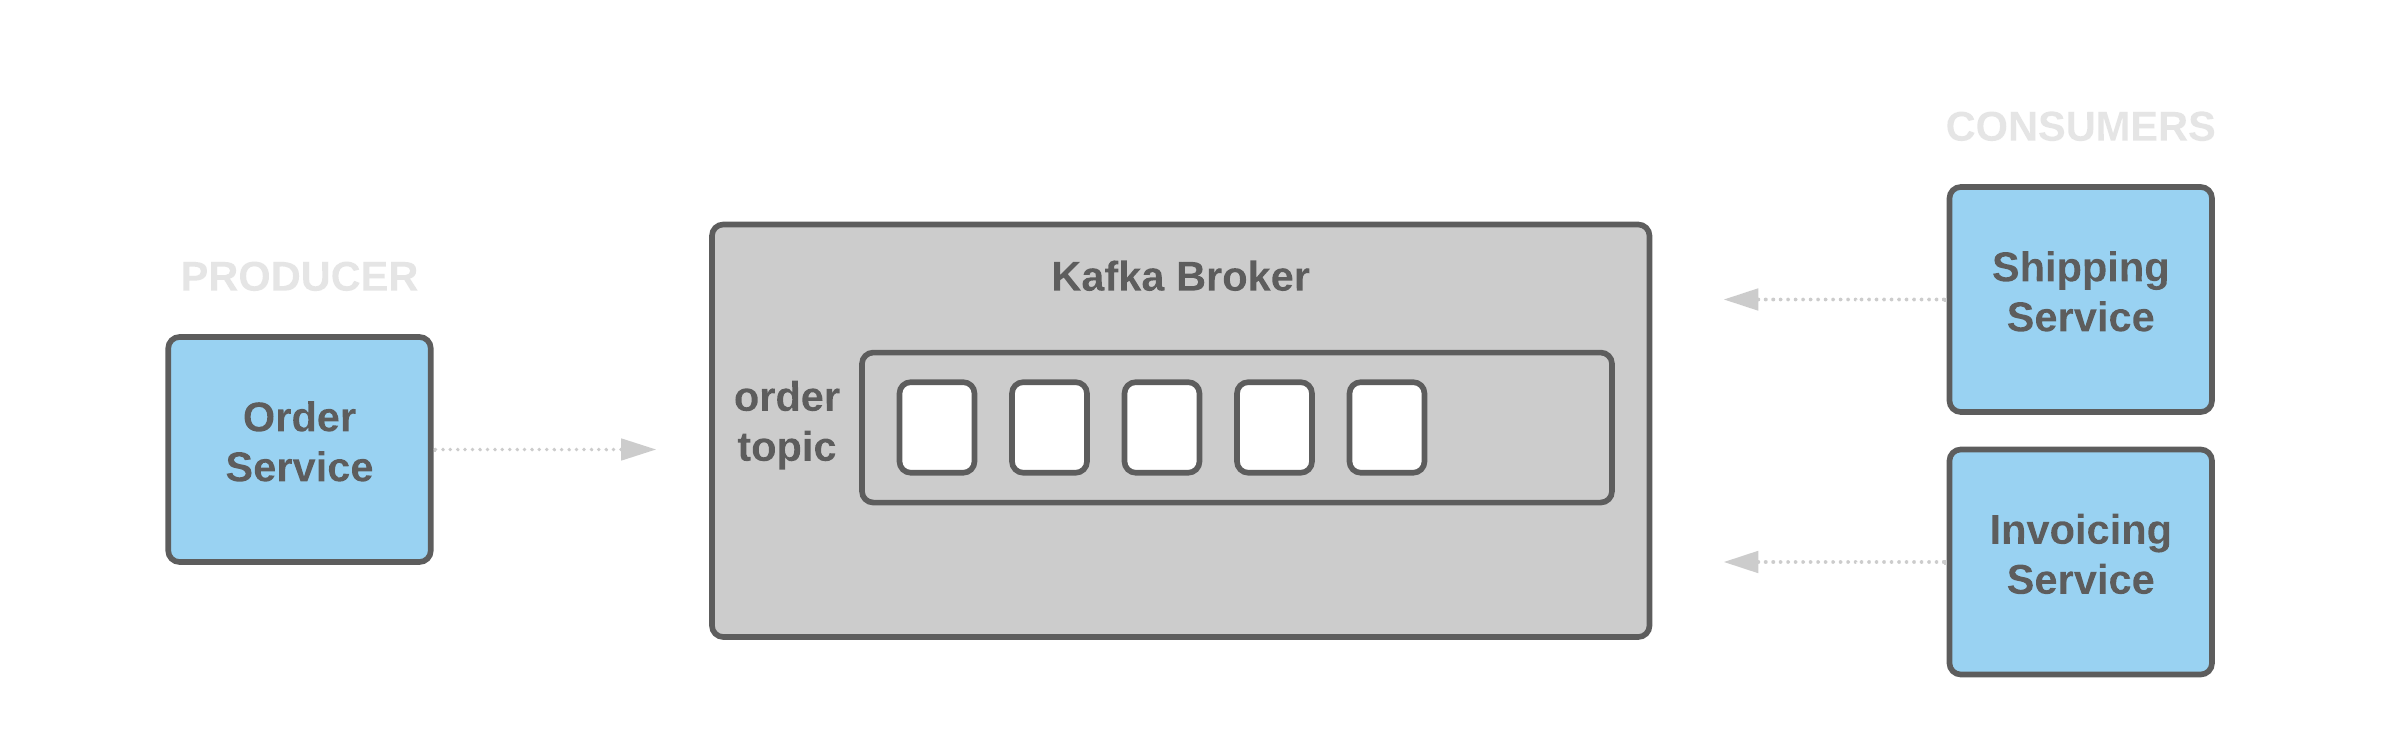 Kafka 예제 Broker 목록
 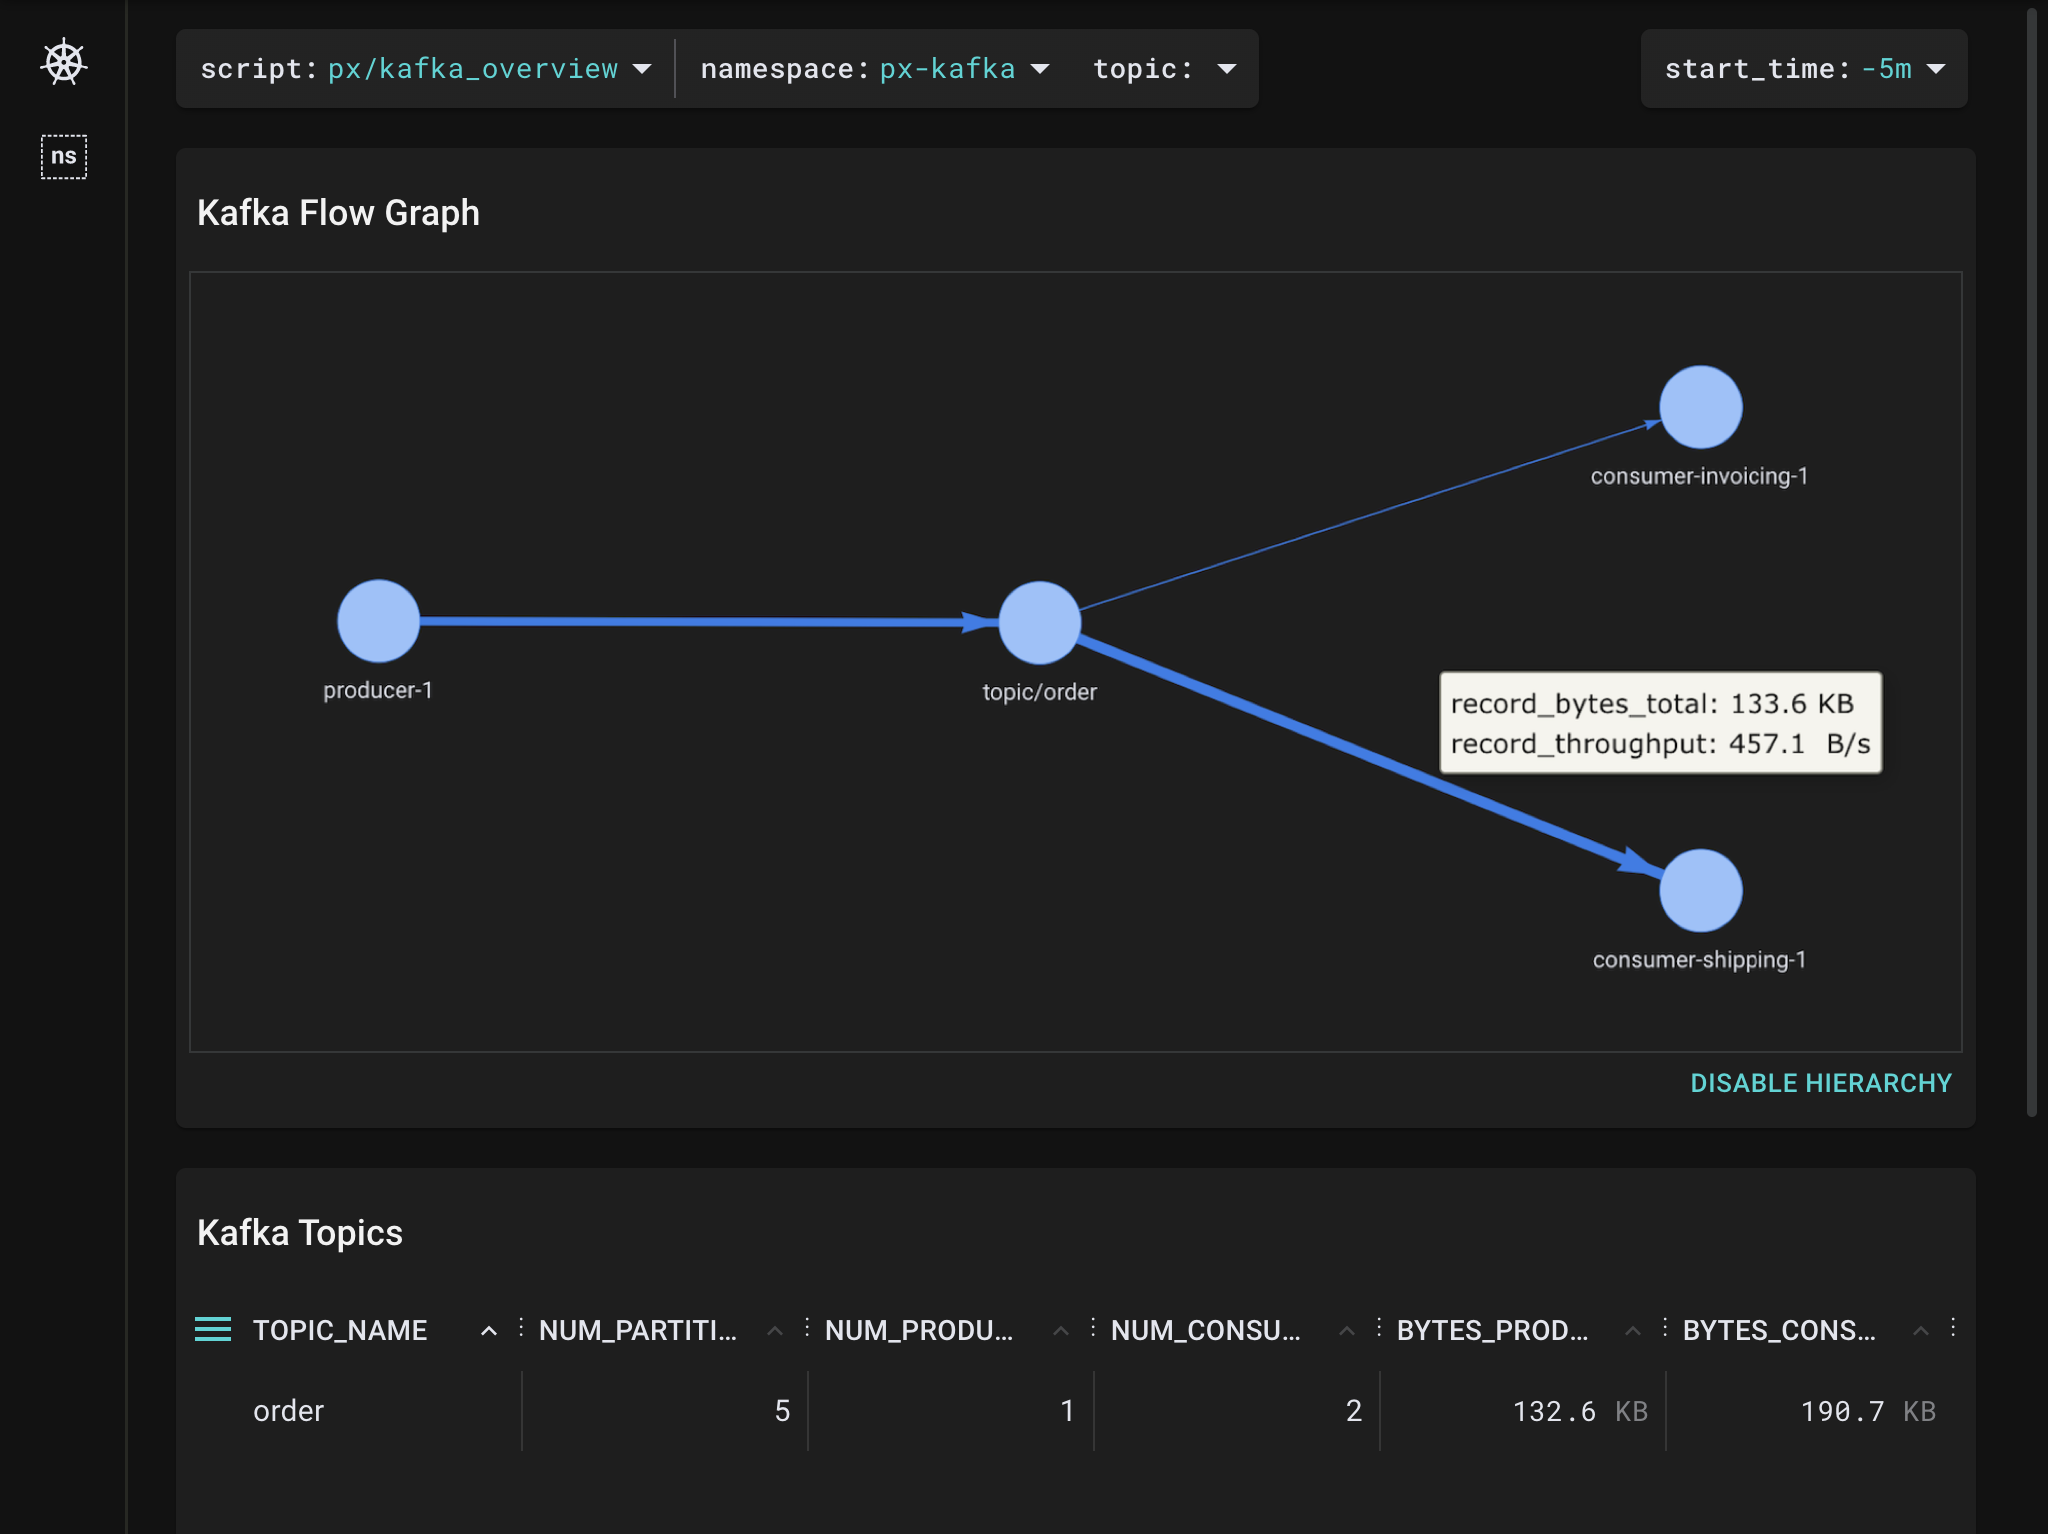 Kafka 대시보드
 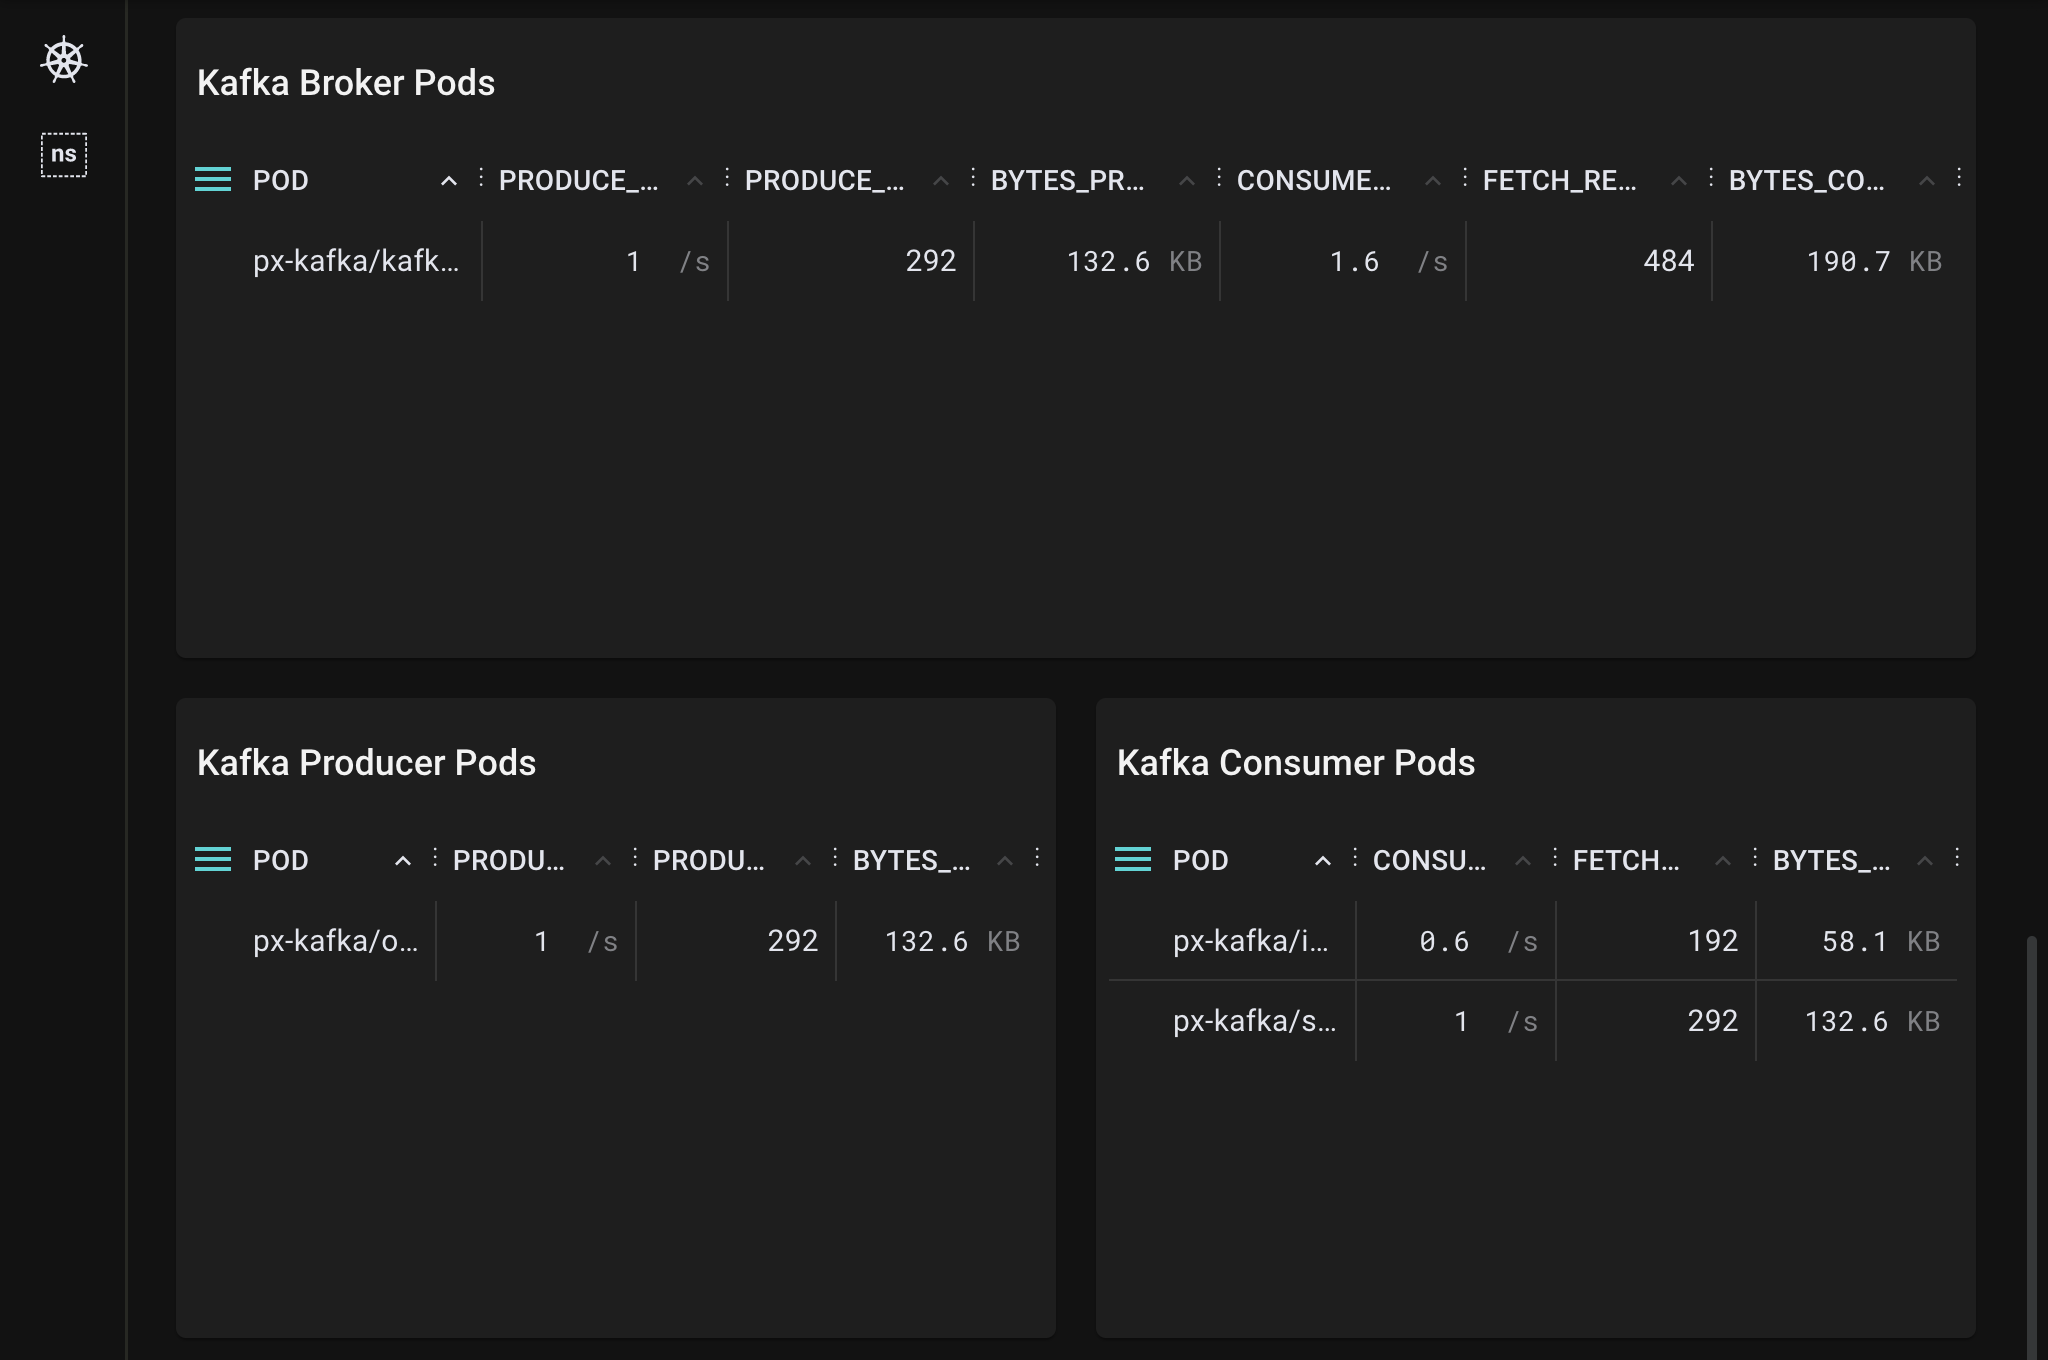 브로커, 생산자 및 소비자 포드 확인
5. 그라파나 플러그인
- Pixie Cloud를 통해 제공되는 대시보드로 메트릭을 확인할 수 있지만, 실시간으로 메트릭을 확인할 수 없습니다.
- 그라파나 플러그인으로 그라파나 내에서 PxL 스크립트를 이용하여 일부 메트릭을 그라파나 대시보드로 출력할 수 있습니다.
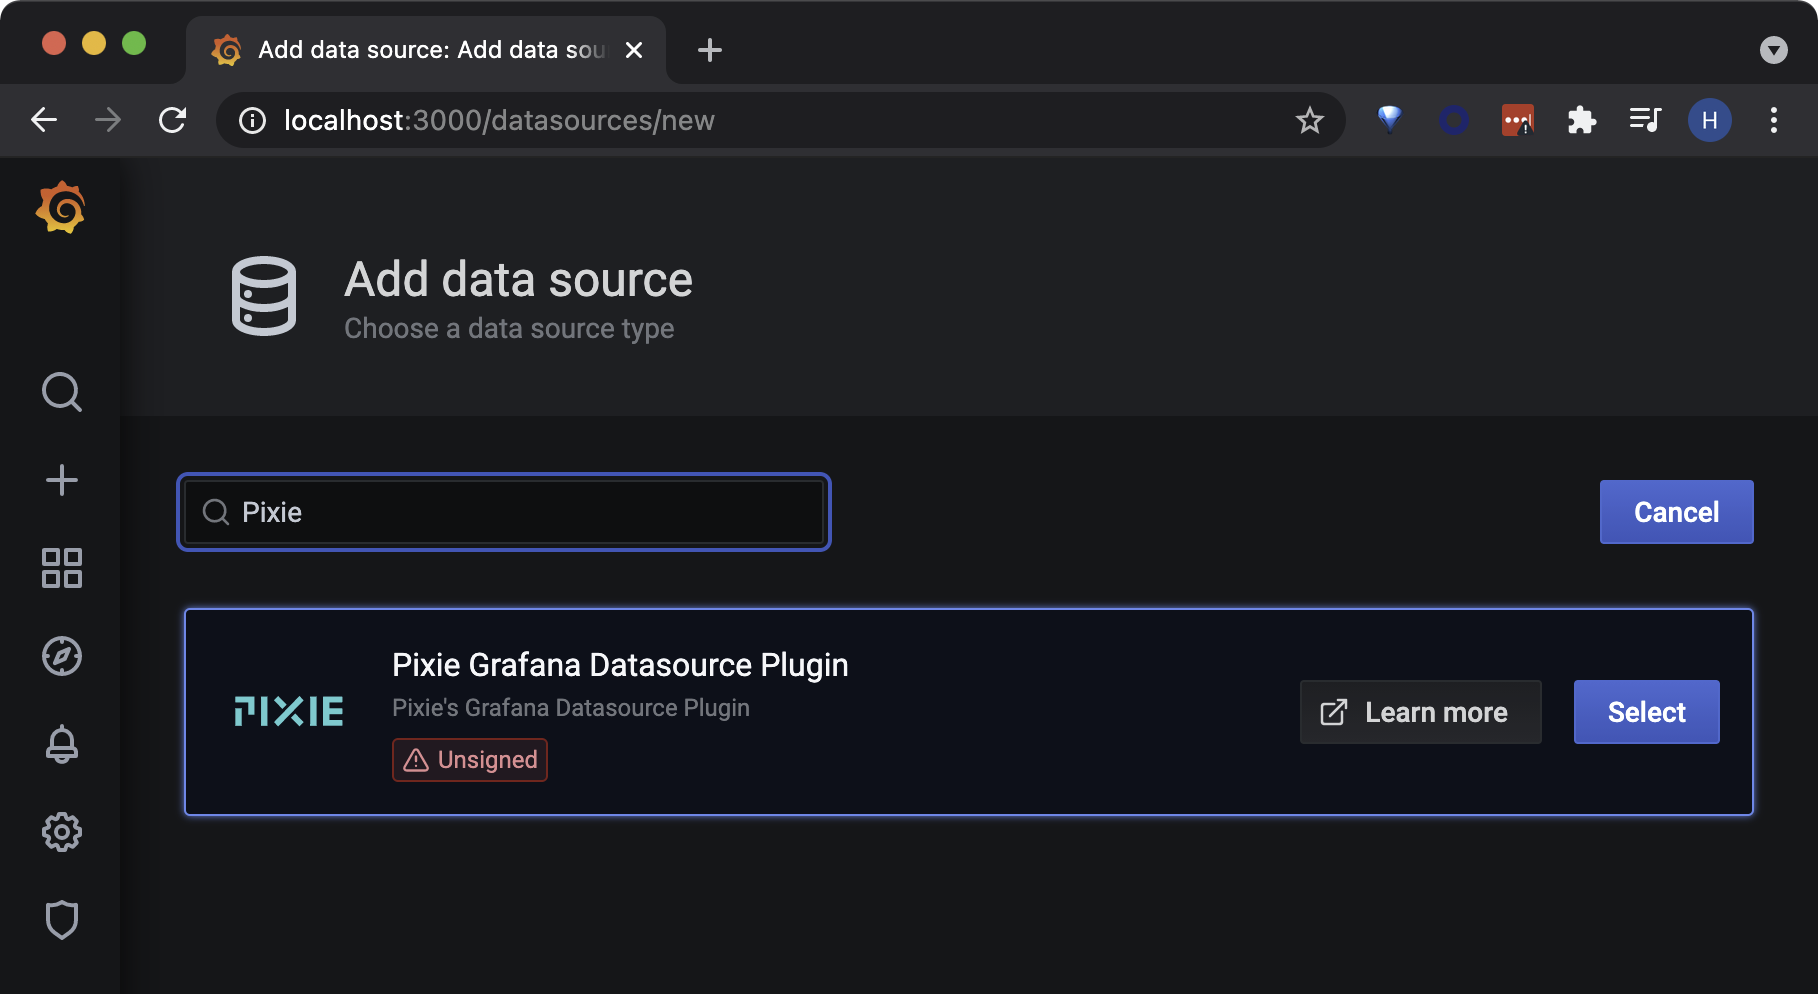
- 그라파나 배포 및 Pixie 플러그인 설치
# helm 설치 curl -fsSL -o get_helm.sh https://raw.githubusercontent.com/helm/helm/main/scripts/get-helm-3 chmod 700 get_helm.sh ./get_helm.sh # grafana repo 추가 helm repo add grafana https://grafana.github.io/helm-charts helm repo update # pixie 플러그인 추가 helm show values grafana/grafana > grafana_chart.yaml vi grafana_chart.yaml >> . . . ## Additional grafana server volume mounts # Defines additional volume mounts. extraVolumeMounts: [] # - name: extra-volume-0 # mountPath: /mnt/volume0 # readOnly: true # existingClaim: volume-claim # - name: extra-volume-1 # mountPath: /mnt/volume1 # readOnly: true # hostPath: /usr/shared/ ## Pass the plugins you want installed as a list. ## plugins: - pixie-pixie-datasource # 추가 # - digrich-bubblechart-panel # - grafana-clock-panel . . . # grafana 배포 helm install my-release grafana/grafana --values grafana_chart.yaml - 그라파나 대시보드 연동
# 대시보드 접속
export POD_NAME=$(kubectl get pods --namespace default -l "app.kubernetes.io/name=grafana,app.kubernetes.io/instance=my-release" -o jsonpath="{.items[0].metadata.name}")
kubectl --namespace default port-forward $POD_NAME 3000

# 로그인 정보
ID : admin
## Password 확인
kubectl get secret --namespace default my-release-grafana -o jsonpath="{.data.admin-password}" | base64 --decode ; echo
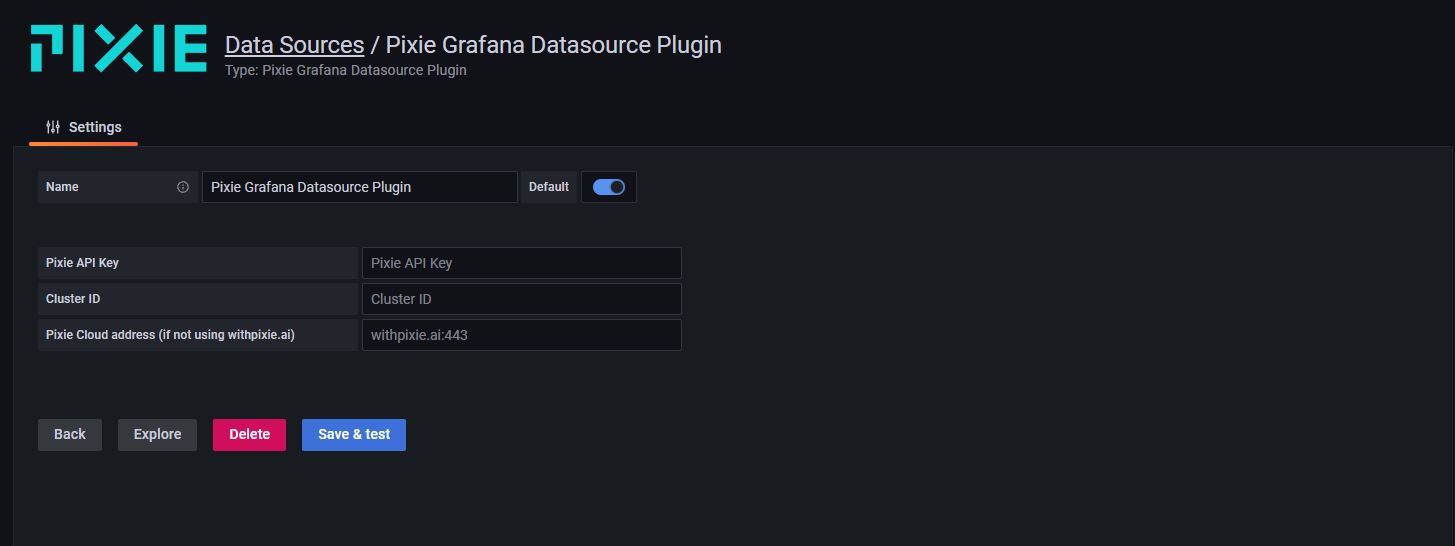
입력 정보 연동까지 20분정도 걸립니다# Cluster ID 확인 px get viziers # API Key 확인 px api-key create
 Cluster ID 확인
 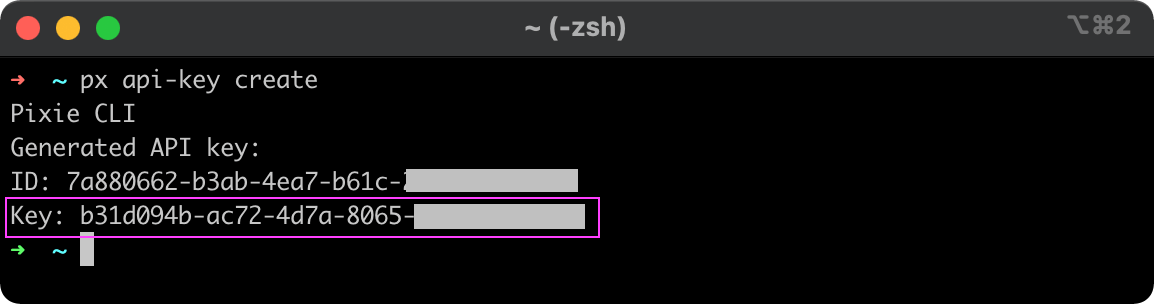 Key 확인
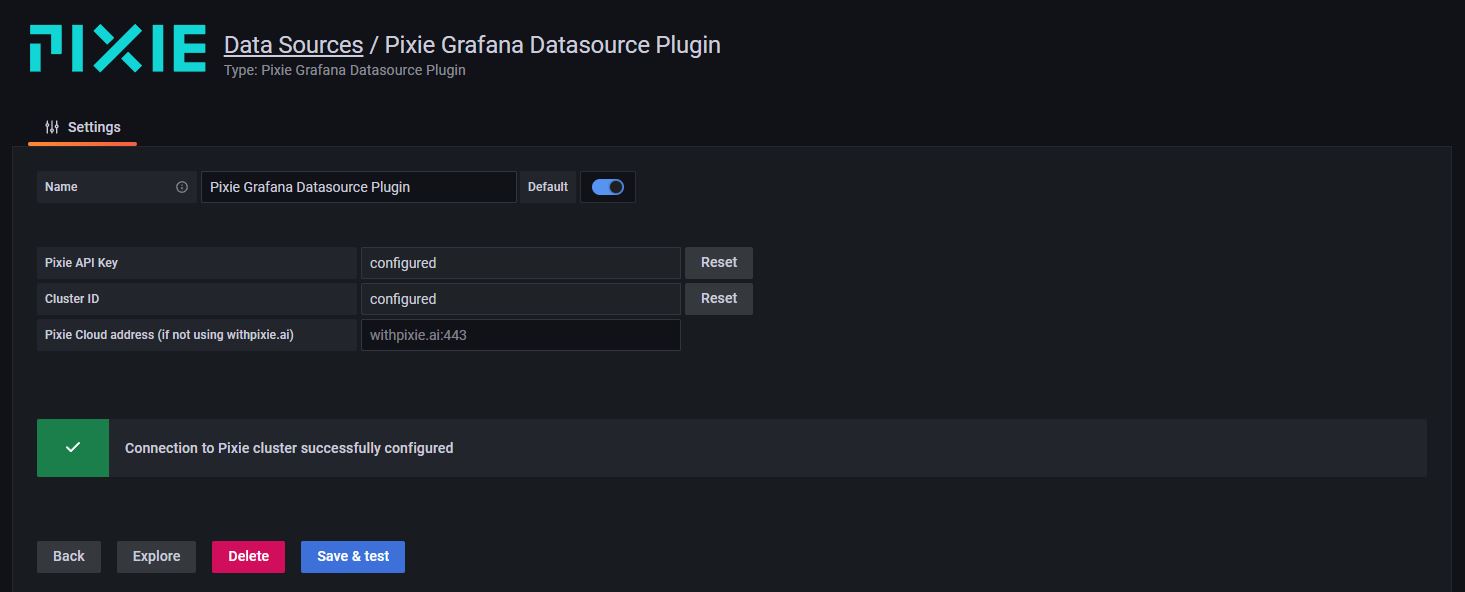
API Key & Cluster ID 입력 필요# Import Pixie's module for querying data. import px # Load data from Pixie's `http_events` table into a Dataframe. df = px.DataFrame(table='http_events', start_time=__time_from) # Bin the 'time_' column using the interval provided by Grafana. df.timestamp = px.bin(df.time_, __interval) # Group data by unique 'timestamp' and count the total number of # requests per unique timestamp. per_ns_df = df.groupby(['timestamp']).agg( throughput_total=('latency', px.count) ) # Calculate throughput by dividing # of requests by the time interval. per_ns_df.request_throughput = per_ns_df.throughput_total / __interval # Rename 'timestamp' column to 'time_'. The Grafana plugin expects a 'time_' # column to display data in a Graph or Time series. per_ns_df.time_ = per_ns_df.timestamp per_ns_df.request_throughput = per_ns_df.request_throughput * 1e9 # Output select columns of the DataFrame. px.display(per_ns_df['time_', 'request_throughput'])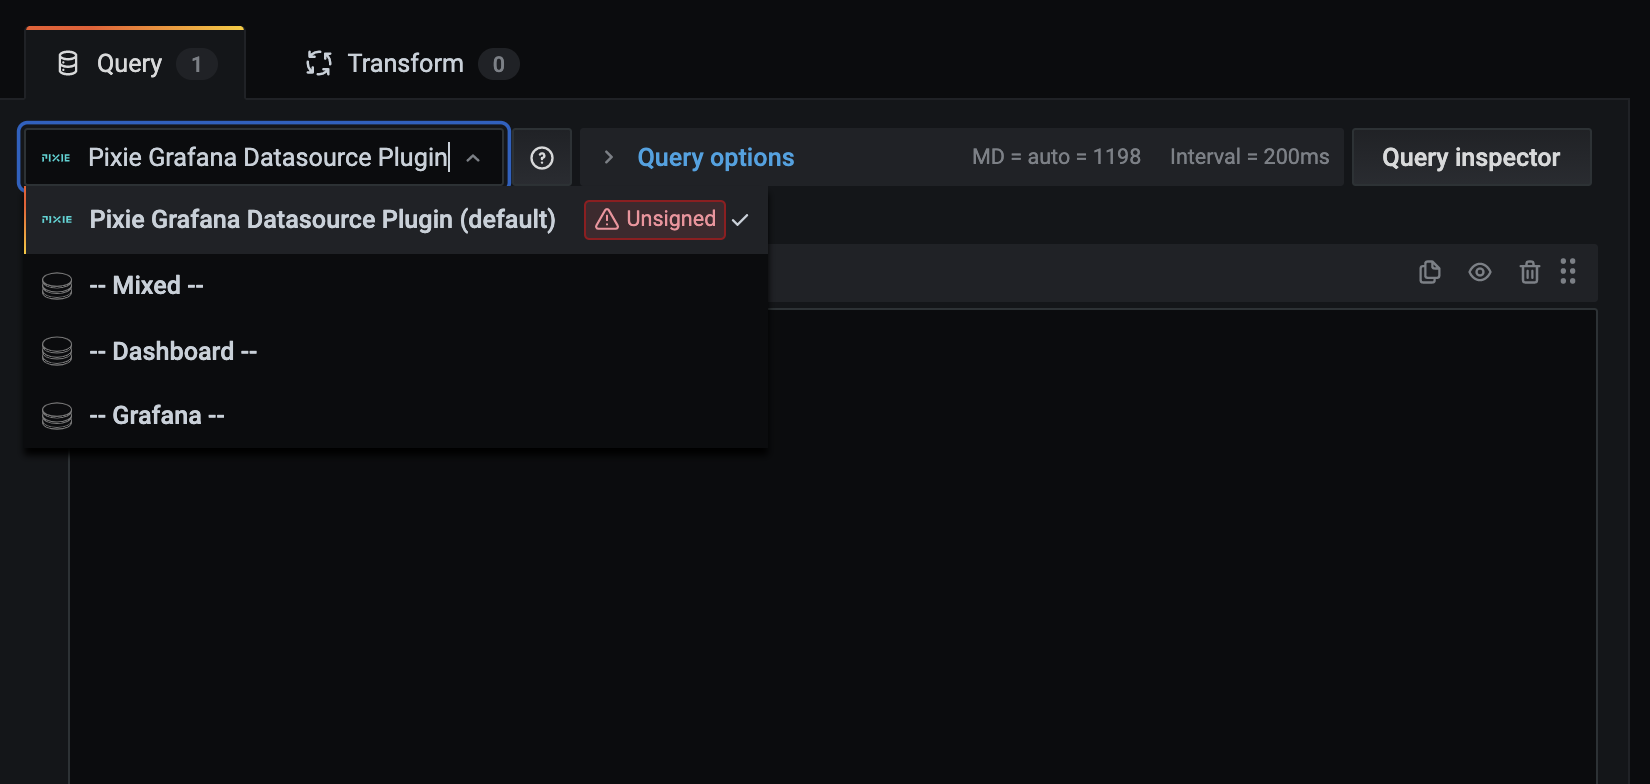
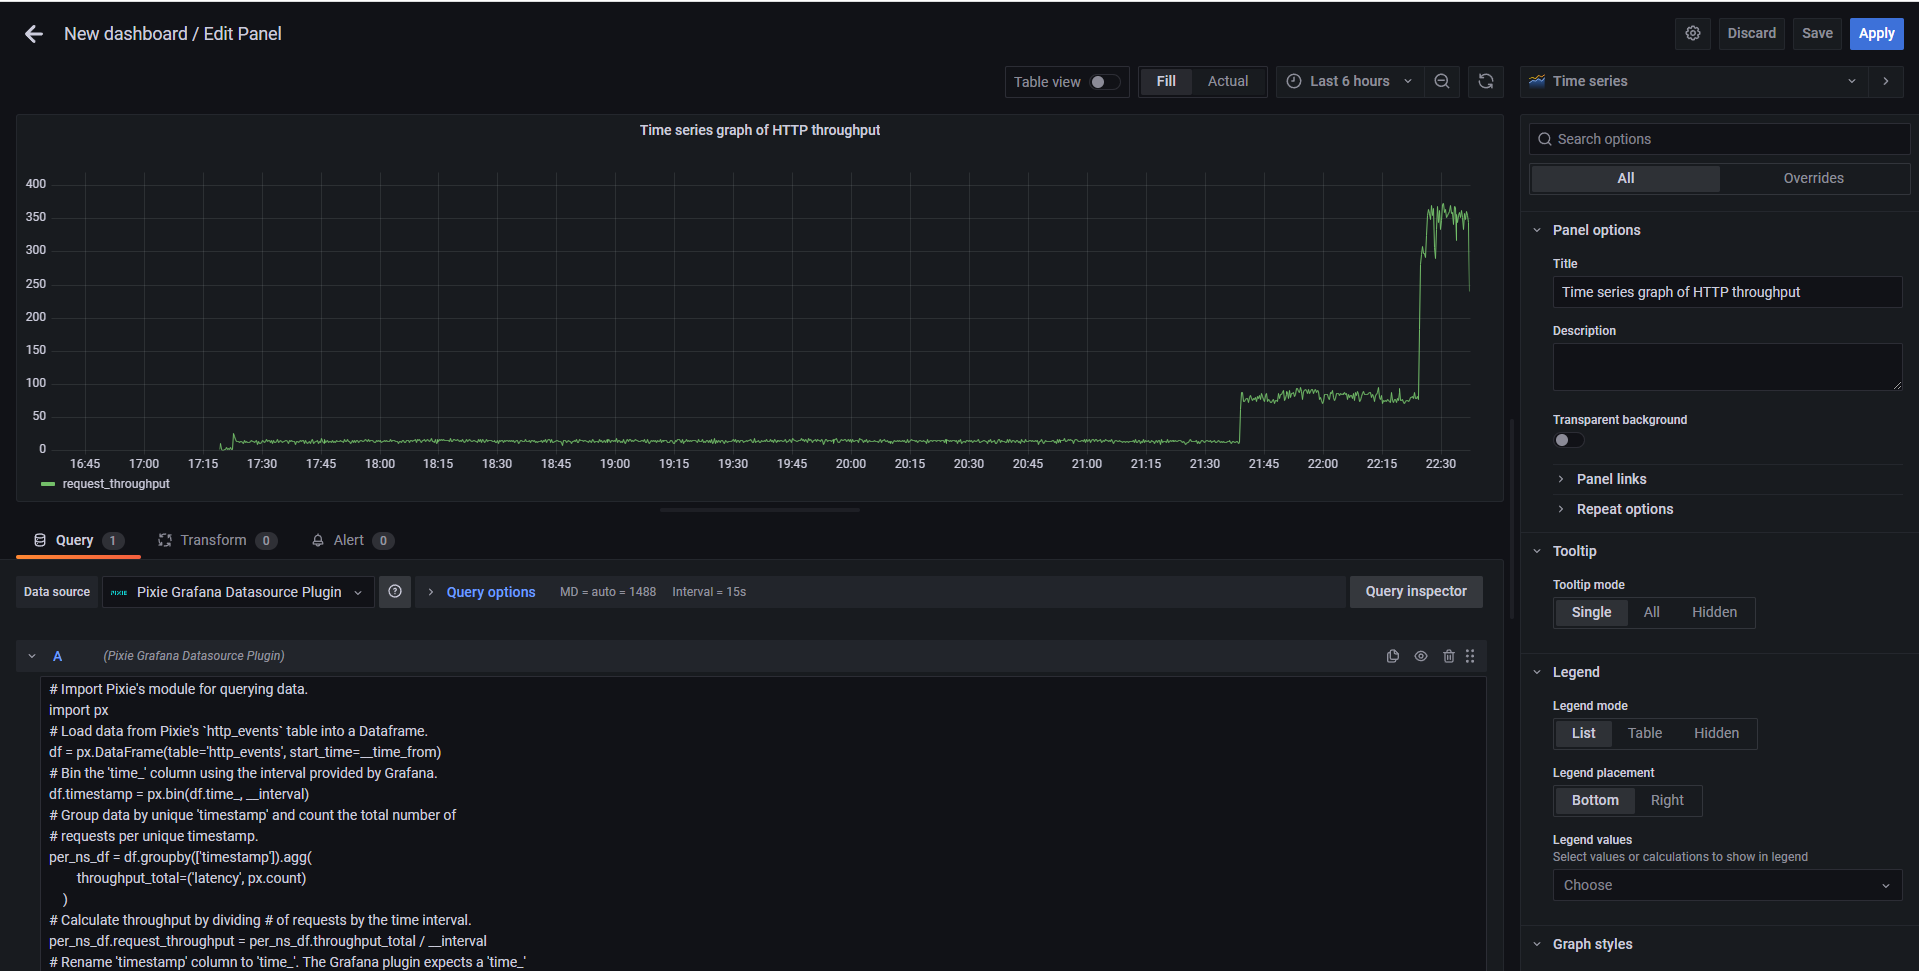 PxL 스크립트 입력 후 대시보드 연동 확인
5. 마치며
개인적으로 강력한 디버깅 기능을 제공하므로 매력적으로 느껴집니다. 하지만, 베타 버전으로 대시보드 회원 관리, 민감데이터 측면에서 한계가 존재합니다. 이 부분은 엔터프라이즈를 구매하면 해결할 수 있다고 생각합니다. 베타 버전을 운영 레벨로 사용함에 있어 버전 업데이트를 지켜봐야 하지만, 개발 레벨에서 디버깅 모니터링으로 활용하면 좋을 것 같습니다. 😀
- 참고 링크
- Pixie 공식사이트 https://docs.pixielabs.ai/
- Pixie 스크립트 참고 깃 https://github.com/pixie-io/pixie/tree/main/src/pxl_scripts
- Pixie 그라파나 플러그인 https://github.com/pixie-io/grafana-plugin/blob/main/README.md
- EKS WorkShop https://www.eksworkshop.com/
- [Kubernetes/Networking] eBPF Basic https://blog.naver.com/kangdorr/222593265958
- KANS 스터디 https://gasidaseo.notion.site/c9cd413265ea4ea1b1ae38eb36dfda94
- 악분님 7주차 Clinum 자료 https://malwareanalysis.tistory.com/288