1. 구글맵 띄우기
google map 을 띄우기 위해서는 API-key를 발급받아야 한다.
api key 발급 받는거는 google map platform을 살펴보면 받을 수 있다.
- CSS / div 생성
<div>요소 안에google map을 띄우는 방식이기 때문에width,height를 설정해주어야 한다.
 <style>
        #map {
            height: 100%;
        }

        html, body {
            height: 100%;
            margin: 0;
            padding: 0;
        }
    </style>
<body>
<div id="map" style="width: 100%; height: 100%"></div>


</body>
-
div요소에google map올리기
google map을 담을 요소를 선택해서option을 설정해준다. 자세한건 공식 문서를 보는게 좋을듯 -
여기서는 d3.js를 사용하고 있어서
d3.select()로 dom에 접근 하였다.
    let map;
    function initMap() {
        map = new google.maps.Map(d3.select("#map").node(), {
            zoom: 8,
            center: new google.maps.LatLng(37.556059, 126.91009),
            mapTypeId: google.maps.MapTypeId.ROADMAP,
        });
    }
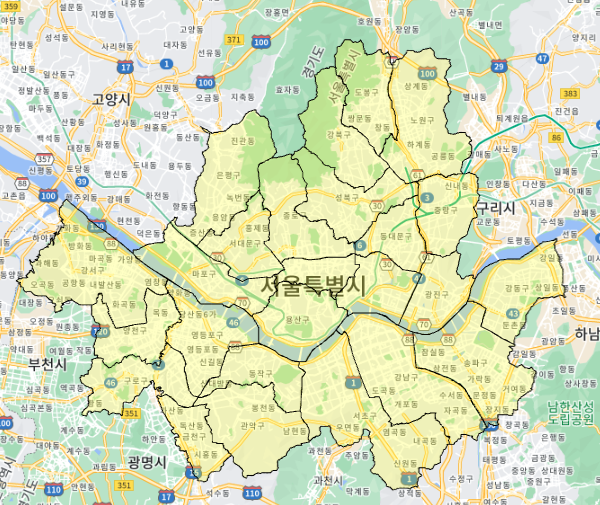
2. 구글맵에 geojson 올리기
이전 글에서 qgis 를 이용해 서울시 지리 데이터를 geojson으로 변환을 해두었다.
해당 데이터를 google map위에 올려 보자. 올려보면 좌표계가 잘 맞는지 확인 할 수있다.
-
google map위에geojson올리기
여기서 사용되는 option들은 여기 에서 확인 가능
    map.data.loadGeoJson('./data/geoData/seoul.geojson');

    // option
    map.data.setStyle({
        fillColor: 'yellow',
        strokeWeight : 1
})- 결과
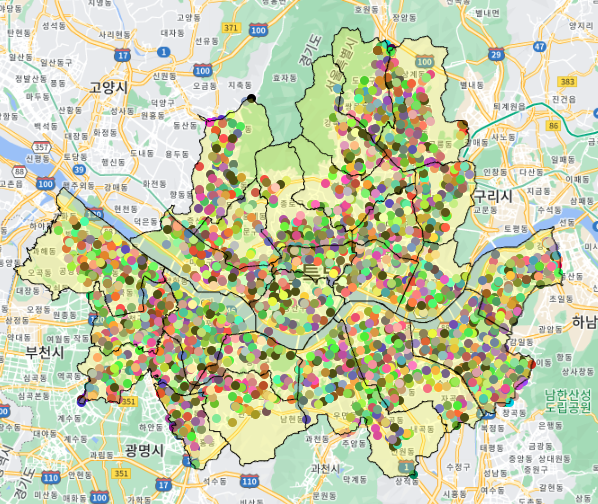
3. 구글맵에 d3.js로 도형 올리기
이전에 작업한 것 처럼 단순히 svg를 얹어서 도형을 그릴 경우 google map의 기능이 제대로 동작하지 않는다. 왜냐면 최 상단에 있는 요소가 svg이기 때문에 지도가 선택이 되지 않기 때문...
그래서 google map의 overlay 기능을 이용하였다.
overlay의 projection 을 이용하여 input 되는 위 경도 값을 pixel로 변경한다.
그리고 변경된 pixel의 x,y 값을 생성하는 svg의 위치를 정해준다.
-
CSS 추가
.stations은overlay에 d3 요소를 그리기 위한 상위 dom class 이다.
.stations내에 있는 요소들에 대해 css 설정을 해주지 않으면 전체 화면에 위치하지 않는 현상이 발생하였다.<style> .stations, .stations svg, .stations svg g { position: absolute; } .stations, .stations svg { top: 0; left: 0; } #map { height: 100%; } html, body { height: 100%; margin: 0; padding: 0; } </style> ```
- 전체 코드
    const getColor = () => '#' + Math.round(Math.random() * 0xffffff).toString(16)


    function drawCycleStations() {
        const overlay = new google.maps.OverlayView();

        const width = window.innerWidth;
        const height = window.innerHeight;

        overlay.onAdd = function () {
            const layer = d3.select(this.getPanes().overlayLayer)
                .append("div")
                .attr("class", "stations")
                .style("width", width)
                .style("height", height);

            overlay.draw = function () {

                const projection = this.getProjection()
                const padding = 5;

                const svg = layer.selectAll("svg")
                    .data(cycleData)
                    .each(transform)
                    .enter()
                    .append("svg")
                    .each(transform)
                    .attr("class", "marker");

                svg.append("circle")
                    .attr("fill", d => getColor())
                    .attr("r", 5)
                    .attr("cx", padding)
                    .attr("cy", padding);


                function transform(d) {
                    const point = new google.maps.LatLng(d.lat, d.lng);
                    const pixel = projection.fromLatLngToDivPixel(point);

                    return d3.select(this)
                        .style("left", (pixel.x - padding) + "px")
                        .style("top", (pixel.y - padding) + "px")
                }
            };
        };

        overlay.setMap(map);
}- 결과