
지난 포스팅에서 현재 otel 환경에 대해 설명했다.
이번엔 nodejs 서비스를 배포하며 겪을 otel, logger 에 대한 내용을 정리한다.
nodejs opentelemetry
공식문서에서 nodejs 애플리케이션에 otel 을 적용하는 방법에 대해 자세히 안내하고있다. 라이브러리도 제공하고있어 쉽게 적용시킬 수 있다.
tracer
// tracer.ts
import { BatchSpanProcessor } from '@opentelemetry/sdk-trace-base';
import { NodeSDK } from '@opentelemetry/sdk-node';
import { getNodeAutoInstrumentations } from '@opentelemetry/auto-instrumentations-node';
import { OTLPTraceExporter } from '@opentelemetry/exporter-trace-otlp-grpc';
import { TraceIdRatioBasedSampler } from '@opentelemetry/sdk-trace-node';
import { Resource } from '@opentelemetry/resources';
import { SEMRESATTRS_SERVICE_NAME } from '@opentelemetry/semantic-conventions';
import { B3InjectEncoding, B3Propagator } from '@opentelemetry/propagator-b3';
import { CompositePropagator, W3CTraceContextPropagator, W3CBaggagePropagator } from '@opentelemetry/core';

export class Tracer {
  private sdk: NodeSDK;
  private exporter = new OTLPTraceExporter({
    url: 'http://localhost:4317',
  });
  private sampler: TraceIdRatioBasedSampler;

  constructor({ appName = 'default-app', samplePercentage = 1.0 }: { readonly appName?: string; readonly samplePercentage?: number }) {
    this.sampler = new TraceIdRatioBasedSampler(samplePercentage);
    this.sdk = new NodeSDK({
      resource: new Resource({
        [SEMRESATTRS_SERVICE_NAME]: appName,
      }),
      traceExporter: this.exporter,
      sampler: this.sampler,
      spanProcessors: [new BatchSpanProcessor(this.exporter)],
      instrumentations: [
        getNodeAutoInstrumentations({
          '@opentelemetry/instrumentation-fs': { enabled: false },
        }),
      ],
      textMapPropagator: new CompositePropagator({
        propagators: [
          new W3CTraceContextPropagator(),
          new W3CBaggagePropagator(),
          new B3Propagator(),
          new B3Propagator({ injectEncoding: B3InjectEncoding.MULTI_HEADER }),
        ],
      }),
    });
  }

  start(): void {
    this.sdk.start();
    console.log('OpenTelemetry initialized');
  }

  async shutdown(): Promise<void> {
    await this.sdk.shutdown();
    console.log('OpenTelemetry terminated');
  }
}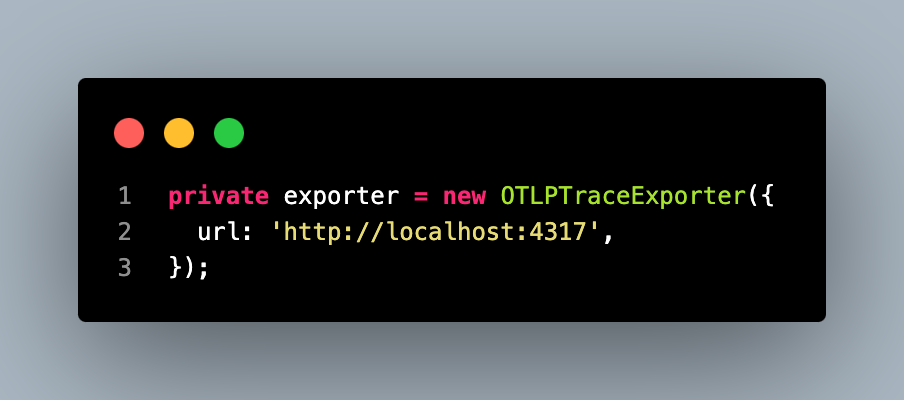
trace 정보를 받을 grafana agent의 grpc 엔드포인트를 사용한다.
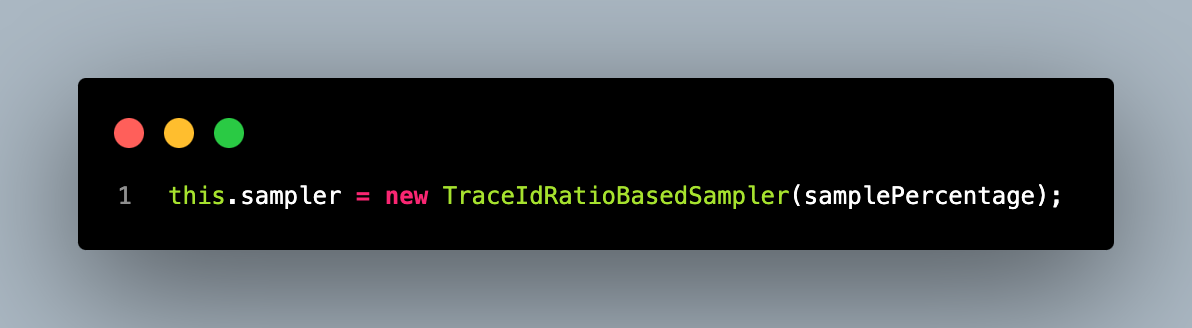
모든 trace를 받기에 부하가 클 수 있어 샘플링 비율을 정할 수 있다. 지금은 개발단계라 모든 trace를 수집하고 있지만, 운영단계에서는 이 비율을 조정하는게 좋을 것 같다.
단, gateway 애플리케이션(spring sleuth)에서 샘플링을 수행하고 각 서비스에서는 이 샘플링 비율을 1 로 두는게 전체적인 트레이스 정보를 유지 및 관리하기 편할 것 같다.
gateway, serviceA 의 샘플링 비율을 모두 0.1 로 두면 0.1*0.1 = 0.001 으로 줄어든다.
단순히 줄어드는걸 넘어서 gateway 에서 수집된 트레이스 정보가 A 에서 끊겨 전체적인 내용을 추적할 수 없는 문제가 생길 수 있을 것 같다.
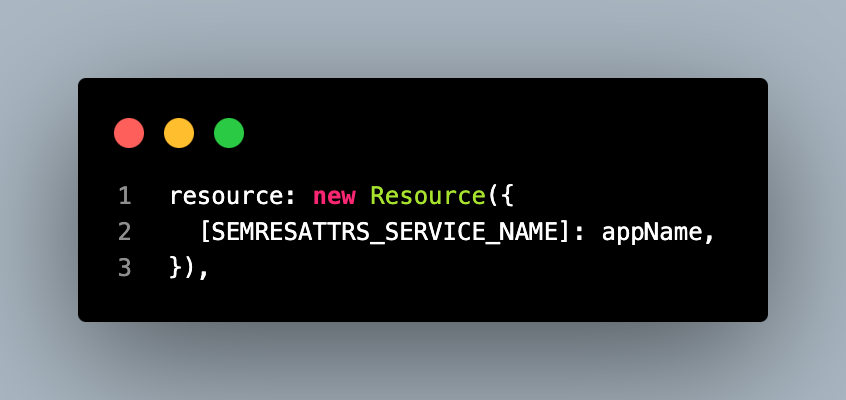
리소스는 각 span 과 노드에 대한 메타데이터를 나타낸다. 애플리케이션의 서비스 이름을 사용한다.
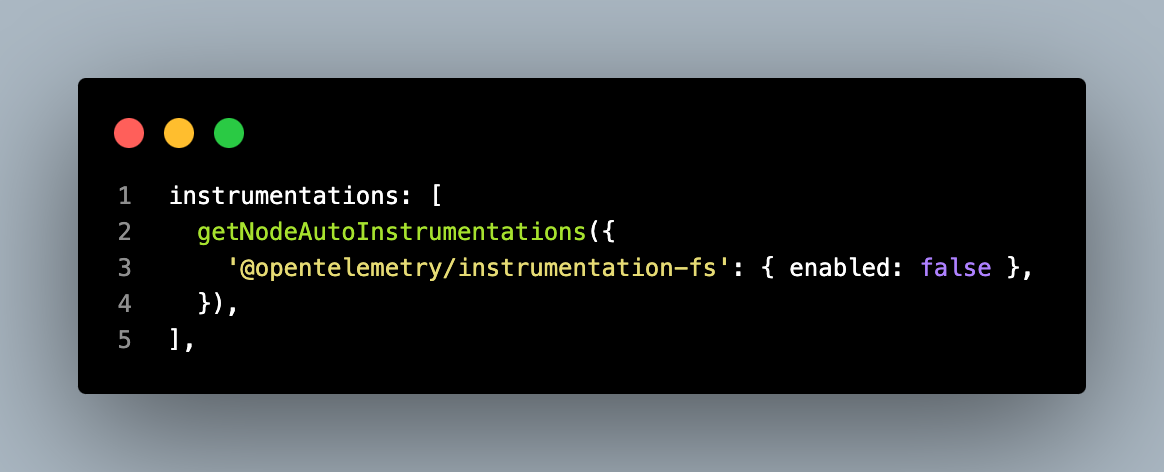
애플리케이션의 다양한 라이브러리 및 프레임워크를 자동으로 instrumentation 하여 trace를 생성하는데 사용된다.
@opentelemetry/auto-instrumentations-node 모듈은 nodejs 애플리케이션에서 일반적으로 사용되는 라이브러리를 자동으로 instrumentation 하여 trace 수집을 지원한다.
'@opentelemetry/instrumentation-fs': { enabled: false }
파일 시스템 작업은 애플리케이션의 주요 동작에 직접적으로 영향을 미치지 않는 경우가 많기 때문에, 모든 파일 시스템 작업에 대한 추적을 비활성화하여 성능 향상을 이끌어내고 분산 추적 데이터의 양을 줄이기 위해 이 옵션을 비활성화한다.
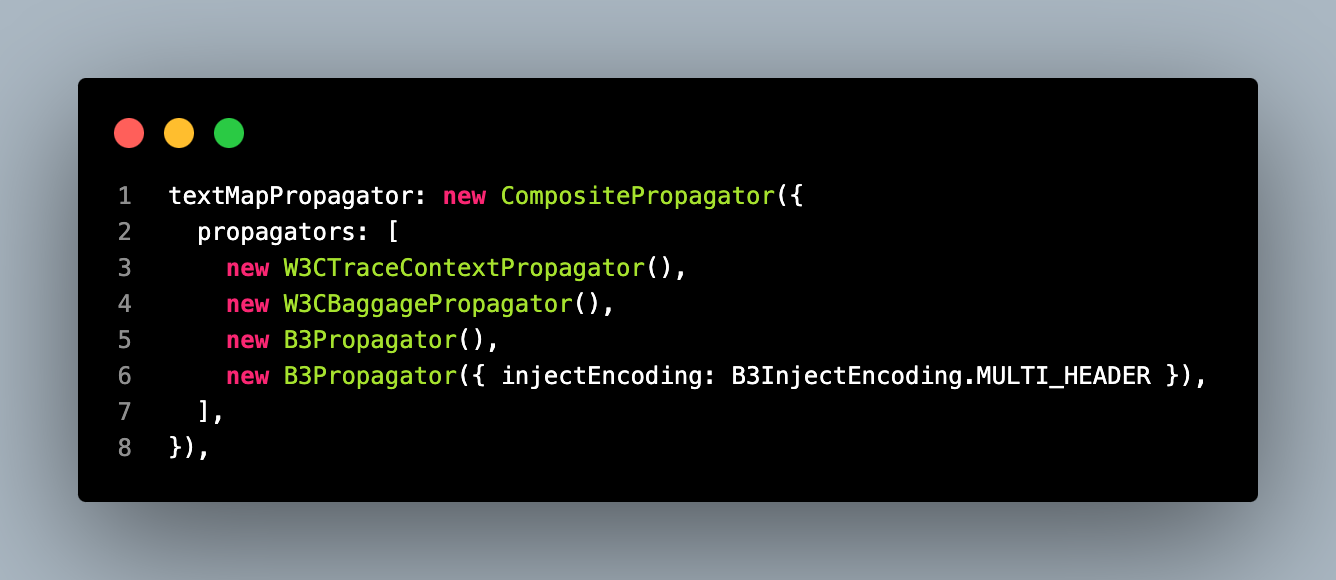
다양한 트레이스 컨텍스트를 전파하는 데 사용되는 Propagator를 지정한다.
@opentelemetry/propagator-b3 를 사용하면 gateway application 들어온 요청에서 b3 컨텍스트를 전파받는다. 사용하지 않으면 새로운 컨텍스트로 실행된다.
tracer 정의가 끝났으면 main(main.ts, app.ts 등) 에서 적용시킨다.
// app.ts
import '@libs/util/expand-prototype';

import { Tracer } from './tracer';
/**
 * AppModule import 시 .env 주입이 이뤄지기 때문에, .env 파일에서 로드되는 환경변수는 Tracer 에 정상적으로 전달할 수 없다. (undefined)
 * tracer 를 AppModule import 후에 생성하면 트레이싱 정보를 정상적으로 수집할 수 없다.
 * 따라서, .env 가 아닌 pod deployment 에 직접 선언된 환경변수를 사용하여 Tracer 를 생성한다.
 */
const tracer = new Tracer({ appName: process.env['APP_NAME'] });
tracer.start();

process.on('SIGTERM', () => {
  tracer
    .shutdown()
    .then(() => console.log('Tracing gracefully terminated'))
    .catch((error) => console.log('Error terminating tracing', error))
    .finally(() => process.exit(0));
});

import { AppModule } from './app.module';
...

async function bootstrap(): Promise<string> {
  const isProduction = process.env['NODE_ENV'] === 'production';
  const app = await NestFactory.create<NestExpressApplication>(AppModule, {
    bufferLogs: true,
    abortOnError: !isProduction, // test for nestjs dev-tools dependency error check
    snapshot: !isProduction,
  });

  ...

  try {
    await app.listen(process.env['PORT'] || 9000);
    return app.getUrl();
  } catch (error) {
    console.error(error);
    process.exit(1);
  }
}

(async (): Promise<void> => {
  try {
    const url = await bootstrap();
    NestLogger.log(url, 'Bootstrap');
  } catch (error) {
    NestLogger.error(error, 'Bootstrap');
    process.exit(1);
  }
})();
코드 상단의 주석에서 확인할 수 있는데, AppModule 을 import 하기전에 tracer 를 먼저 실행시키고있다.
tracer 를 늦게 실행시키면 trace 가 정상적으로 수집되지 않는 문제가 있었다.
그리고, AppModule 보다 Tracer 를 먼저 import 하고있는데 이때 tracer 에서 환경변수를 제대로 가져오지 못하는 문제가 있었다.
이 애플리케이션에서 환경변수를 불러오는 시점은 AppModule 에서
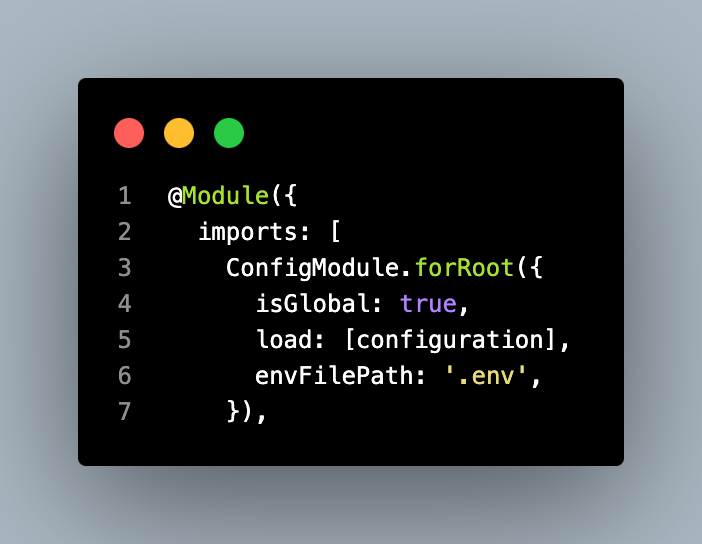
ConfigModule 을 import 하는 시점이다.
즉, import 전에는 .env 의 환경변수를 주입받지 못한상태다.
ConfigModule 을 사용하는 구조를 변경하고싶지 않아 몇몇 환경변수를 deployment 의 env 에 직접 추가했다.
# deployment.yaml

...
                    env:
                        -   name: NODE_ENV
                            value: production
                        -   name: APP_NAME
                            value: {{ .Values.openwhisk.adapter.name }}
...
prometheus metrics
prometheus metrics 를 수집하는 방법은 다양하다. opentelemetry 의 prometheus exporter 를 사용해도 되고, 사용하지 않아도 된다.
이미 사용하고있던 spring actuator 구조를 그대로 가져가고싶어 opentelemetry 를 사용하지 않고, 간단히 endpoint 를 추가했다.
1. opentelemetry prometheus exporter
Opentelemetry prometheus metrics exporter
@opentelemetry/exporter-prometheus
시험적인 기능들을 제공하고있다.
2. metrics endpoint
// actuator.module.ts
import { PrometheusModule } from '@willsoto/nestjs-prometheus';
import { Module } from '@nestjs/common';
import { TerminusModule } from '@nestjs/terminus';
import { ActuatorController } from './actuator.controller';

@Module({
  imports: [
    TerminusModule,
    PrometheusModule.register({
      defaultLabels: {
        app: process.env['APP_NAME'],
      },
      path: '/actuator/prometheus',
    }),
  ],
  controllers: [ActuatorController],
})
export class ActuatorModule {}
npm i @willsoto/nestjs-prometheus
위 라이브러리를 사용해 prometheus metrics 를 조회할 수 있는 endpoint 를 정의하고, grafana agent 에서 이를 조회해 mimir 로 전송한다.
logger
지금까지 nestjs 애플리케이션을 개발할때 항상 winston 을 사용했다. 이미 널리 사용되고있어 굳이 다른 logger 를 생각해보지 않았다.
이번에 opentelemetry logger 를 찾다가 pino 를 사용한 예제를 몇몇 볼 수 있었다.
pino 의 장점은 json 로깅이 쉽고 아주 가볍다는 점이었다.
적절한 logger 를 찾기위해 모두 사용해봤다.
pino
사용자경험이 최악이었다.
npm i nestjs-pino pino-pretty
// app.module.ts
...
import { LoggerModule } from 'nestjs-pino';
import { createStream } from 'rotating-file-stream';
const isProduction = process.env['NODE_ENV'] === 'production';
const formatters = isProduction
? {
level(label: string, number: number) {
return { level: label.toUpperCase() };
},
log: (object: Record<string, unknown>) => {
const { res, ...rest } = object;
return rest;
},
}
: undefined;
const transport = isProduction
? { target: 'pino/file', options: { destination: `logs/info.log`, mkdir: true } }
: {
targets: [
{
target: 'pino-pretty',
options: {
colorize: true,
ignore: 'pid,hostname',
hideObject: true,
messageFormat: '{if traceId}[{traceId}]{end}{if spanId}[{spanId}]{end} {msg}',
translateTime: 'SYS:yyyy-mm-dd HH:MM:ss.l',
},
},
{ target: 'pino/file', options: { destination: `logs/info.log`, mkdir: true } },
],
};
@Module({
imports: [
...,
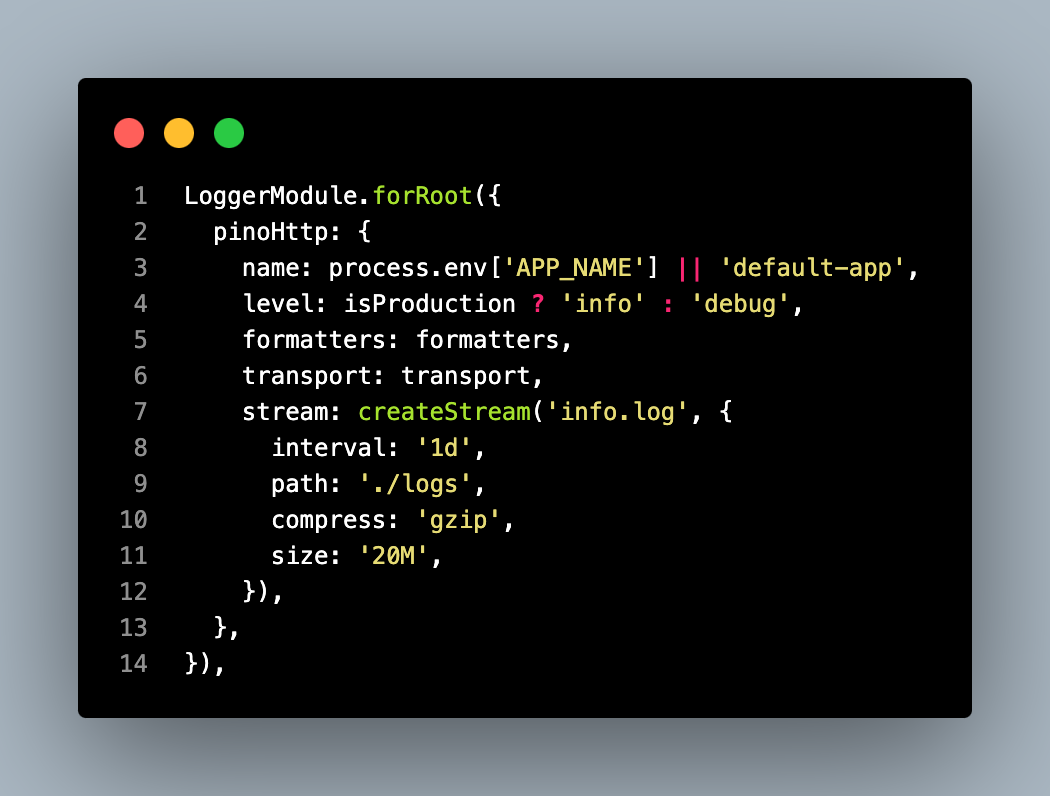
LoggerModule.forRoot({
pinoHttp: {
name: process.env['APP_NAME'] || 'default-app',
level: isProduction ? 'info' : 'debug',
formatters: formatters,
transport: transport,
stream: createStream('info.log', {
interval: '1d',
path: './logs',
compress: 'gzip',
size: '20M',
}),
},
}),
...
],
...
})
export class AppModule implements NestModule {
// Global Middleware, Inbound logging
public configure(consumer: MiddlewareConsumer): void {
consumer.apply(LoggerMiddleware).forRoutes('*');
}
}문제 1. log level
pino 는 기본적으로 log level 을 숫자로 반환한다.
{
"level": 30,
"time": 1713942619434,
"pid": 57228,
"hostname": "hwangbojunsuui-MacBookPro.local",
"name": "app-openwhisk-adapter",
"req": {
...
},
"traceId": "9ad3126a177d9615165bc254d5e0aadc",
"spanId": "a7d8bdc095f41662",
"traceFlags": "01",
"trace_id": "9ad3126a177d9615165bc254d5e0aadc",
"span_id": "a7d8bdc095f41662",
"trace_flags": "01",
"context": ["traceId", "spanId"],
"msg": "path: \"/v1/actions\", query: {\n \"order\": \"asc\",\n \"page\": \"0\",\n \"limit\": \"20\"\n}, body: {}"
}
{
"level": 30,
"time": 1713942619477,
"pid": 57228,
"hostname": "hwangbojunsuui-MacBookPro.local",
"name": "app-openwhisk-adapter",
"req": {
...
},
"traceId": "9ad3126a177d9615165bc254d5e0aadc",
"spanId": "a7d8bdc095f41662",
"traceFlags": "01",
"trace_id": "9ad3126a177d9615165bc254d5e0aadc",
"span_id": "a7d8bdc095f41662",
"trace_flags": "01",
"context": [],
"msg": "Execute time: 43ms"
}
{
"level": 30,
"time": 1713942619479,
"pid": 57228,
"hostname": "hwangbojunsuui-MacBookPro.local",
"name": "app-openwhisk-adapter",
"req": {
...
},
"traceId": "9ad3126a177d9615165bc254d5e0aadc",
"spanId": "f3cf8f700ec36f0b",
"traceFlags": "01",
"trace_id": "9ad3126a177d9615165bc254d5e0aadc",
"span_id": "f3cf8f700ec36f0b",
"trace_flags": "01",
"res": { // <- 맞지막에 res 객체가 붙어서 로깅됨
...
},
"responseTime": 47,
"msg": "request completed"
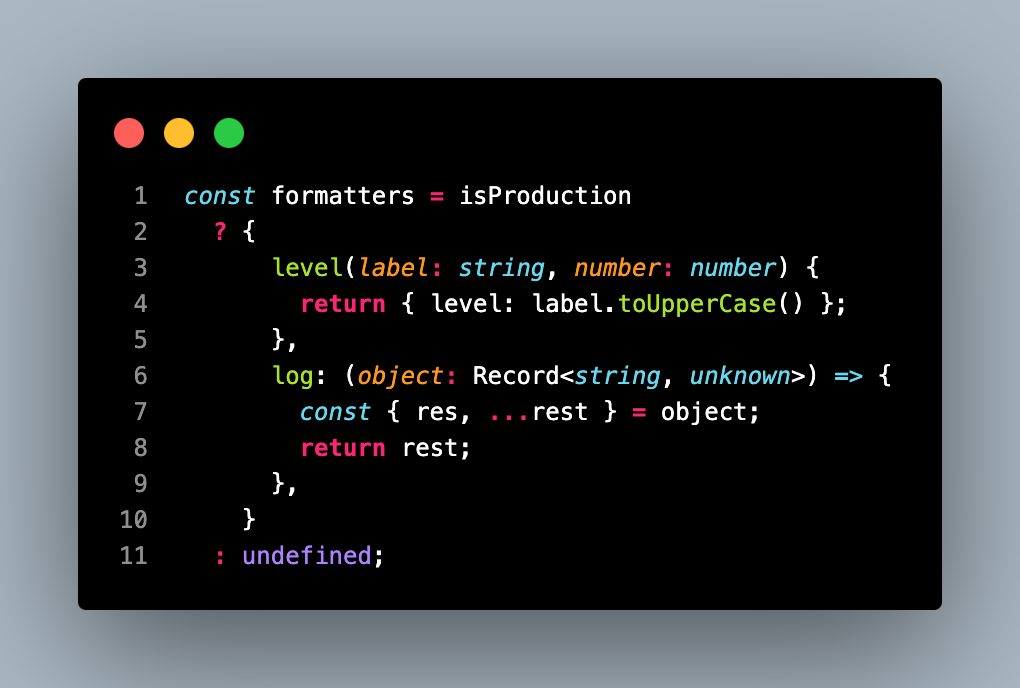
}이 숫자는 spring logback 과 다른 level 의 id 이고, 사용자가 알아보기 쉬운 label (ex. info, debug, warn, error, ...) 로 로깅하려면 formatter 를 직접 정의해야한다.
formatter 를 사용하지 않으면 기존 grafana 에 통합시키기 어려운 상황이었다.
문제 2. 불필요한 정보 필터링
위 로그를 보면 "req", "res" 객체가 기본적으로 들어가있는걸 확인할 수 있다. ... 으로 줄여놓았지만 헤더를 포함해 정말 많은 데이터가 포함되어있고 이런 정보까지 로깅할 필요가 없는 상황이다.
formatter 로 "res" 객체는 필터링 할 수 있었지만 "req" 객체는 제거가 불가능했다.
문제 3. transport targets + formatter 사용 불가능
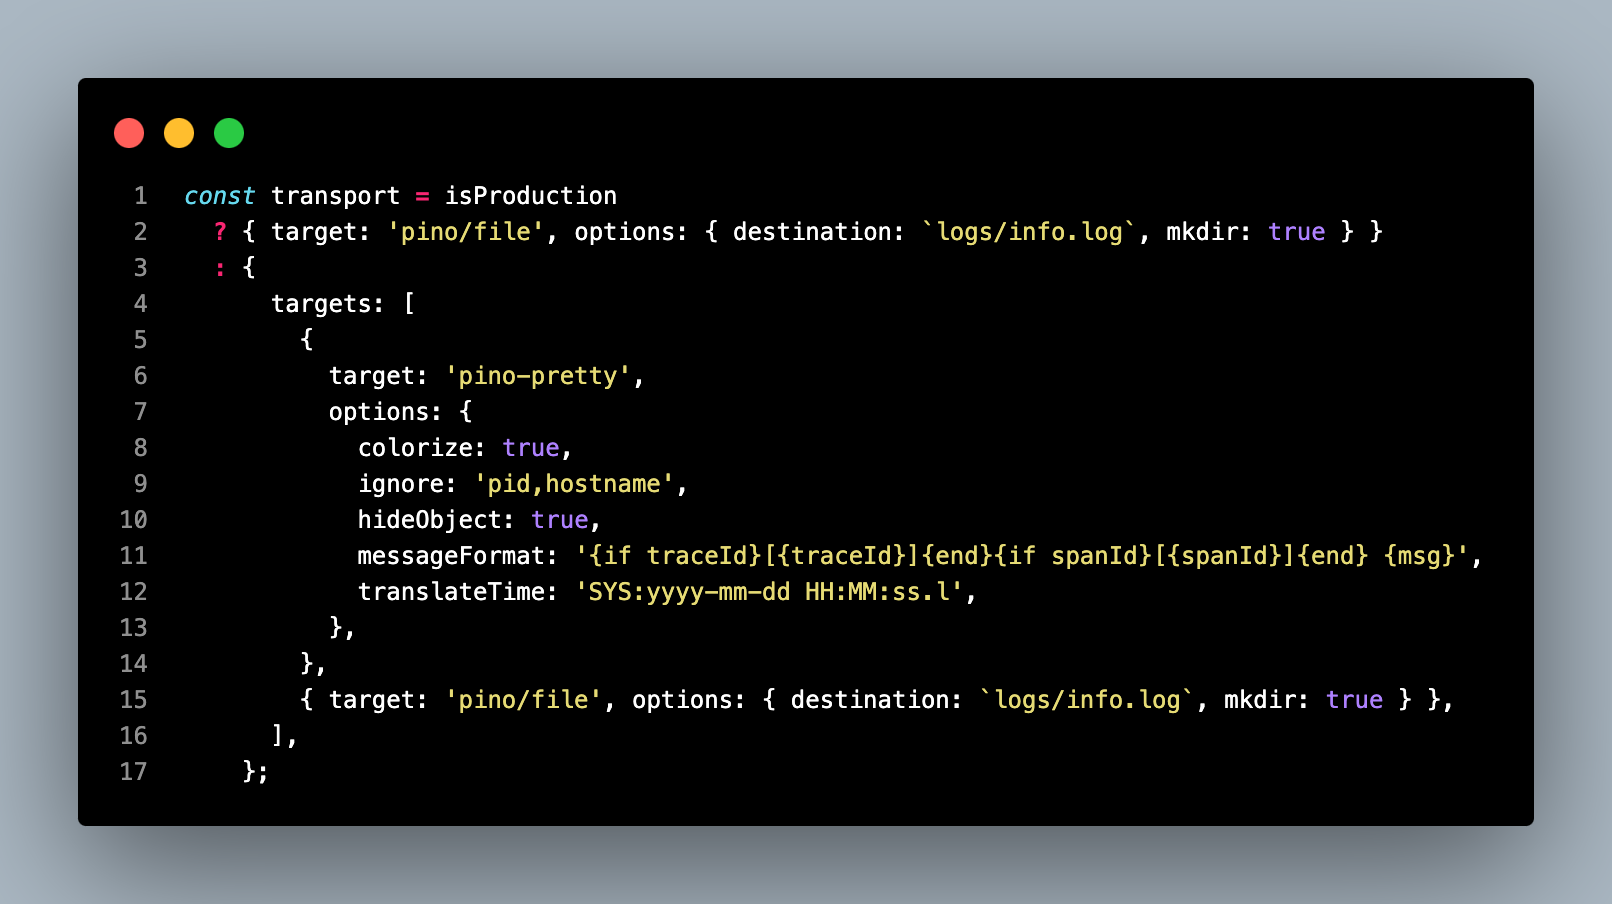
환경에 따라 transport 를 정의하는 코드인데, 이상한 점이 있다.
운영환경이든 개발환경이든 로그를 console 과 file 모두 사용하는게 일반적이다.
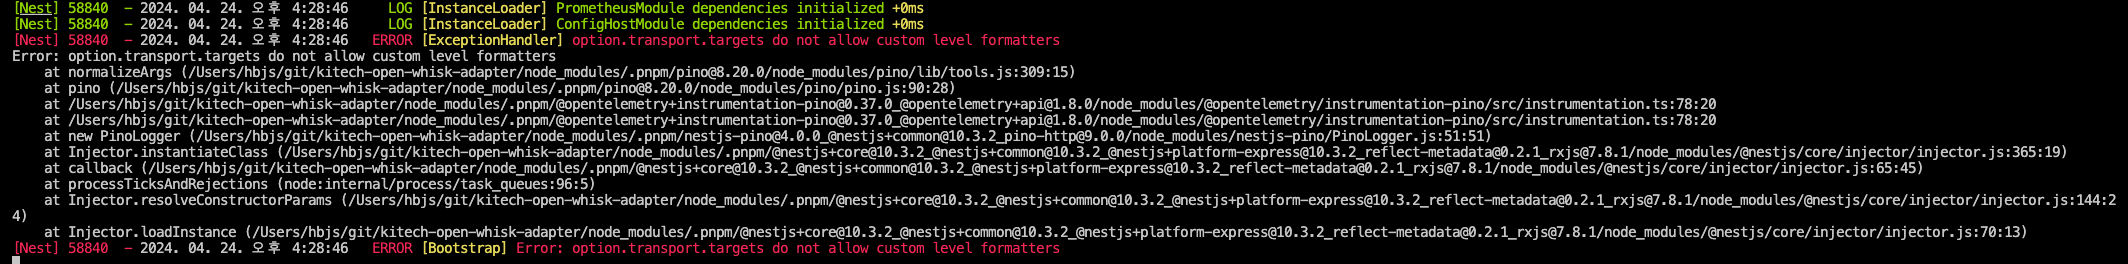
pino 의 경우 target 을 여러개 정의하면 formatter 와 함께 사용할 수 없었다.
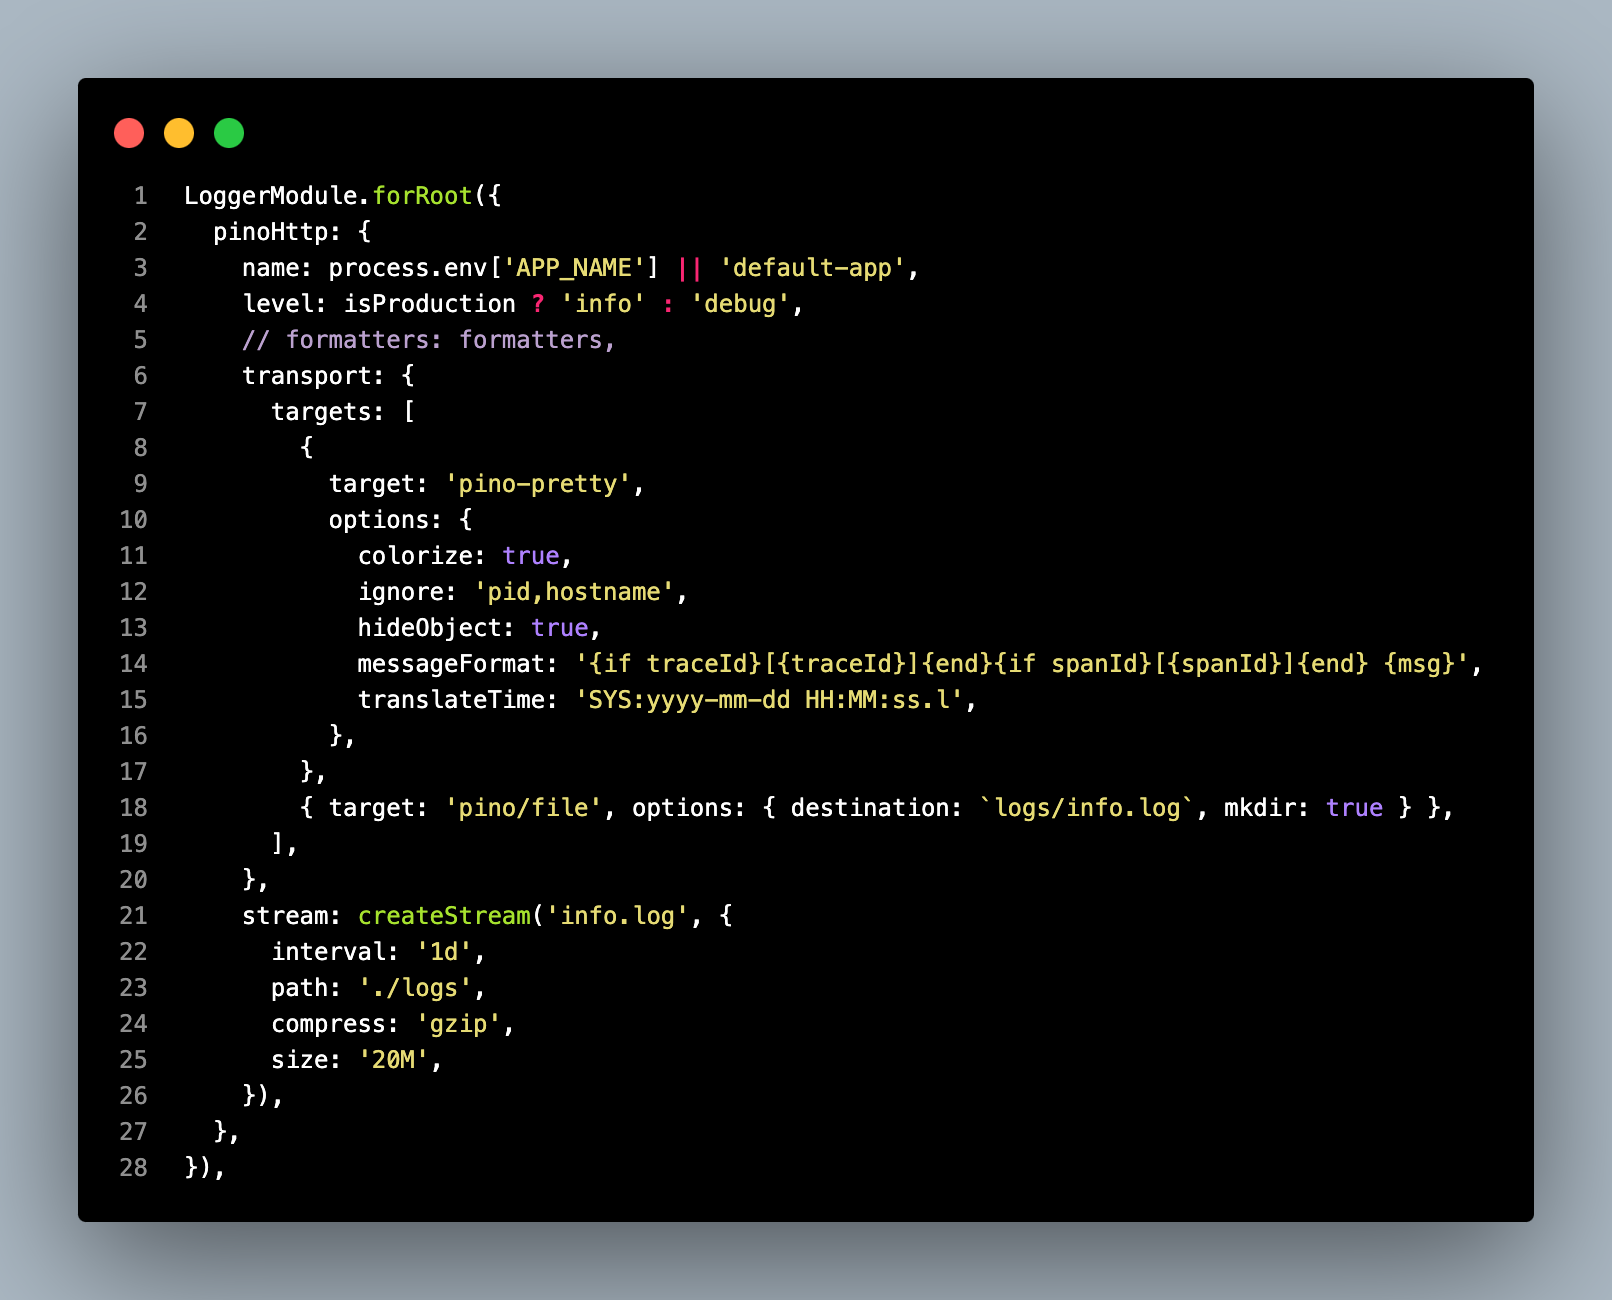
- formatter 를 사용하지 않고 targets 를 사용하는 경우
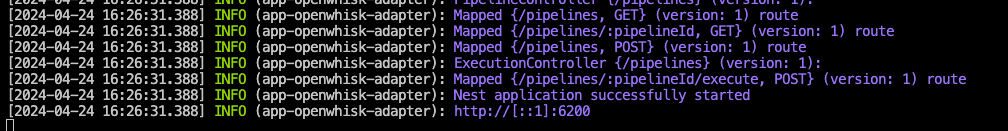
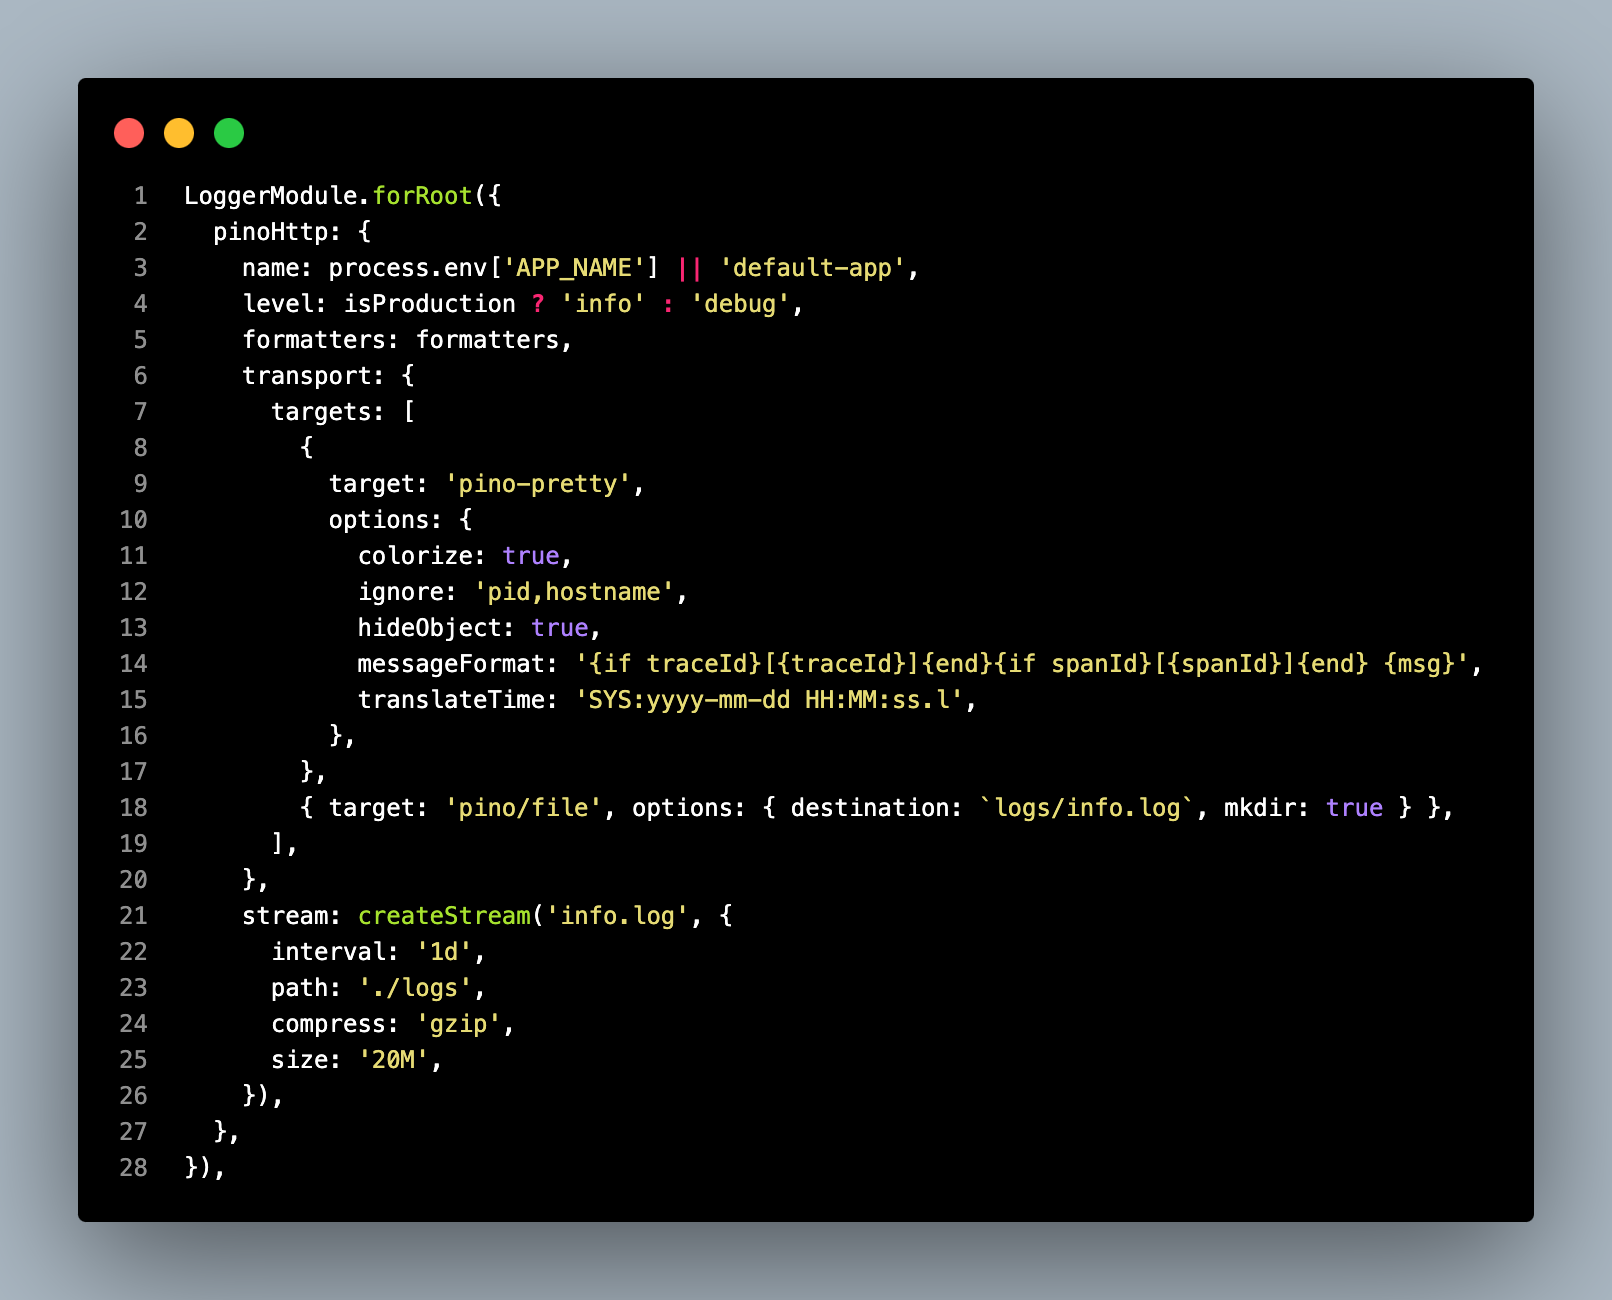
- formatter 와 함께 targets 를 사용하는 경우
formatter 를 사용하지 않는경우 문제 1 문제 2 를 해결할 수 없어 결국 console 을 포기하고 pino/file 만 사용할 수 있었다.
이 경우 grafana agent 에 문제가 있어 log 를 loki 로 정상적으로 전송할 수 없게된 경우 grafana 에서 확인할 수 없을거고, 문제가 생기면 컨테이너에 접속해 직접 로그파일을 확인하는 방법밖에 없다. (argocd logs 나 container logs 에 안찍힘)
문제 5. 별도의 file rotating 의존성 필요
nestjs-pino 는 file rotate 기능을 제공하지않는다. 별도의 file rotating 라이브러리를 사용해야한다.
npm i rotating-file-stream
import { createStream } from 'rotating-file-stream';
winston
위의 불편했던 경험들을 모두 해결할 수 있었다.
npm i nest-winston winston winston-daily-rotate-file
// app.module.ts
...
import { utilities, WinstonModule } from 'nest-winston';
import winston from 'winston';
import WinstonDaily from 'winston-daily-rotate-file';
import path from 'path';
...
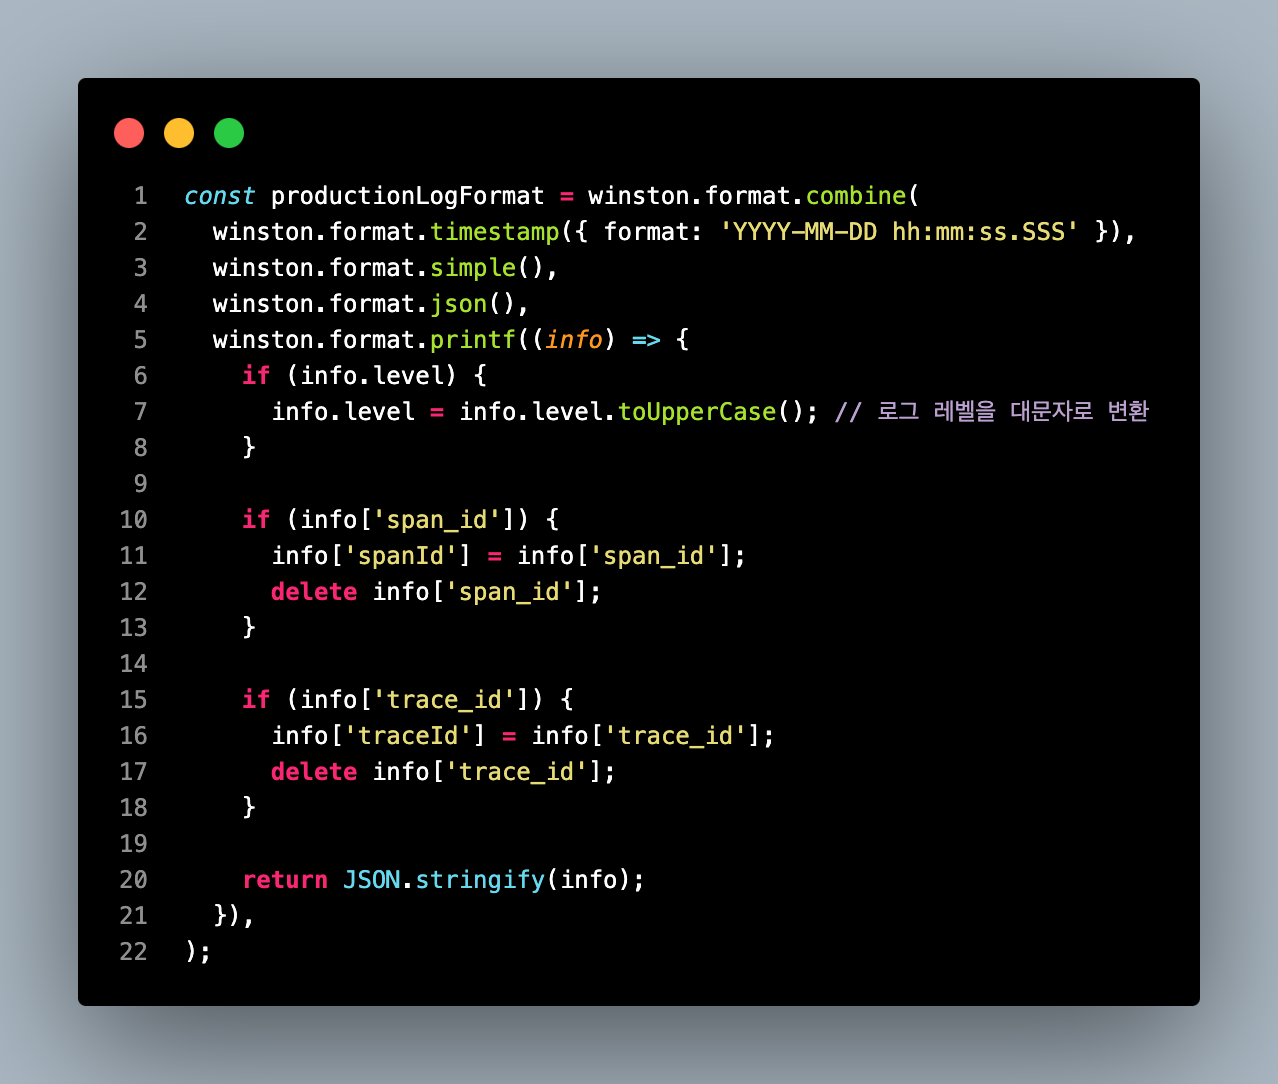
const productionLogFormat = winston.format.combine(
winston.format.timestamp({ format: 'YYYY-MM-DD hh:mm:ss.SSS' }),
winston.format.simple(),
winston.format.json(),
winston.format.printf((info) => {
if (info.level) {
info.level = info.level.toUpperCase(); // 로그 레벨을 대문자로 변환
}
if (info['span_id']) {
info['spanId'] = info['span_id'];
delete info['span_id'];
}
if (info['trace_id']) {
info['traceId'] = info['trace_id'];
delete info['trace_id'];
}
return JSON.stringify(info);
}),
);
@Module({
imports: [
...,
WinstonModule.forRoot({
transports: [
new winston.transports.Console({
level: isProduction ? 'info' : 'silly',
format: winston.format.combine(
winston.format.colorize({ all: true }),
winston.format.timestamp(),
utilities.format.nestLike(appName, { prettyPrint: true }),
),
}),
new WinstonDaily({
dirname: path.join(process.cwd(), '/logs'),
level: 'info',
datePattern: 'YYYY-MM-DD',
filename: `%DATE%.info.log`,
maxSize: '50m',
maxFiles: 30,
zippedArchive: true,
format: productionLogFormat,
}),
new WinstonDaily({
dirname: path.join(process.cwd(), '/logs'),
level: 'error',
datePattern: 'YYYY-MM-DD',
filename: '%DATE%.error.log',
maxSize: '50m',
maxFiles: 30,
zippedArchive: true,
format: productionLogFormat,
}),
],
}),
...
],
...
})
export class AppModule implements NestModule {
// Global Middleware, Inbound logging
public configure(consumer: MiddlewareConsumer): void {
consumer.apply(LoggerMiddleware).forRoutes('*');
}
}
winston 의 다양한 format 을 이용할 수 있었다. json 형태로 로깅할 수 있었고, 불필요한 필드를 쉽게 제거할 수 있었다.
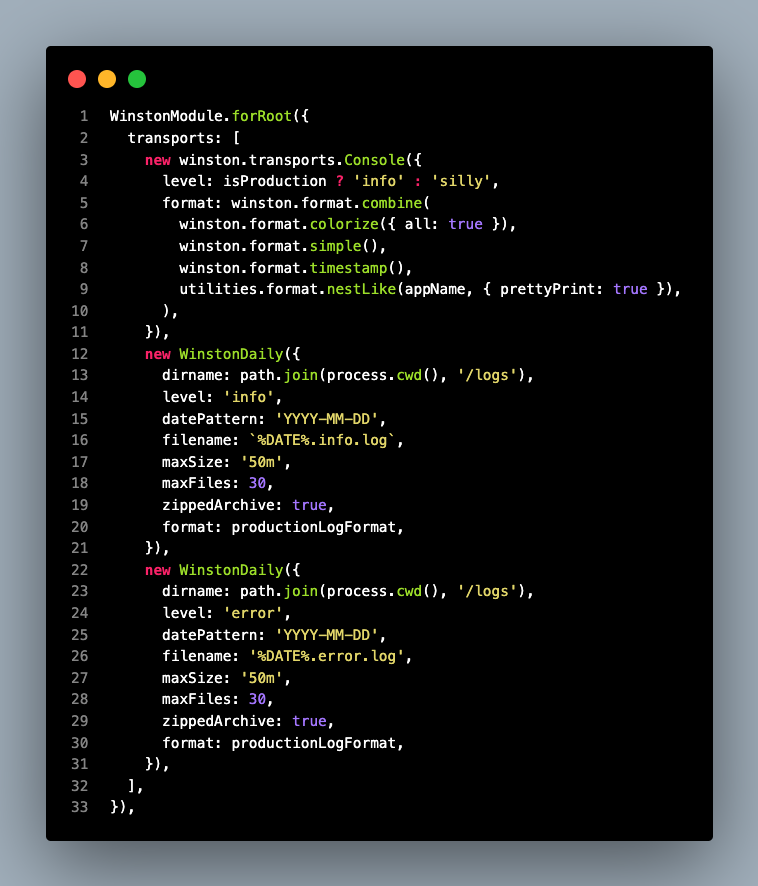
console 로거와 file 로거들을 함께 정의해서 사용할 수 있었다.
WistonDaily 에서 rotate, format, zip 등 다양한 기능을 제공해 기존 시스템과 쉽게 통합시킬 수 있었다.
health-check
// actuator.controller.ts
import { Controller, Get } from '@nestjs/common';
import { ApiTags } from '@nestjs/swagger';
import { HealthCheck, HealthCheckService, HttpHealthIndicator, MemoryHealthIndicator, DiskHealthIndicator } from '@nestjs/terminus';

@ApiTags('Actuator')
@Controller('actuator')
export class ActuatorController {
  constructor(
    private readonly health: HealthCheckService,
    private readonly http: HttpHealthIndicator,
    private readonly memory: MemoryHealthIndicator,
    private readonly disk: DiskHealthIndicator,
  ) {}

  @Get('/health/liveness')
  @HealthCheck()
  liveness() {
    return this.health.check([]);
  }

  @Get('/health/readiness')
  @HealthCheck()
  readiness() {
    return this.health.check([
      () => this.http.pingCheck('nestjs', 'http://1.1.1.1'),
      () => this.memory.checkHeap('memory_heap', 512 * 1024 * 1024), // e.g., 512 MB
      () => this.disk.checkStorage('storage', { thresholdPercent: 0.9, path: '/' }),
    ]);
  }
}
위와같이 두개의 endpoint 를 정의하고 k8s 의 healthcheck 기능을 사용한다.