통계학&머신러닝 과제
필수 1. 기초통계
- statistics csv 파일을 읽고, 성별 Review Rating 에 대한 평균과 중앙값을 구해주세요. 결과는 소수점 둘째자리까지 표현해주세요.
- 그리고 이에 대한 해석을 간략하게 설명해주세요.
✍나의 답
# 라이브러리 호출
import pandas as pd
import numpy as np

# 과학 계산용 파이썬 라이브러리
import scipy.stats as stats
import warnings
warnings.filterwarnings('ignore')
df = pd.read_csv("statistics.csv")

# Review Rating 에 대한 평균
mean = df.groupby(['Gender'])['Review Rating'].mean().round(2)

# Review Rating 에 대한 중앙값
median = df.groupby(['Gender'])['Review Rating'].median().round(2)

print(f"평균: {mean}")
print(f"중앙값: {median}")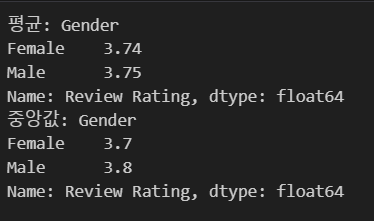
✍튜터님 답
df.groupby(['Gender'])['Review Rating'].agg(['mean','median']).round(2).reset_index()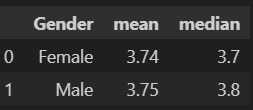
필수 2. 통계적 가설검정
- 성별, Review Rating 컬럼에 대한 T-TEST 를 진행해주세요.
- 귀무가설과 대립가설을 작성해주세요.
- t-score, P-value 를 구해주세요.
- 그리고 이에 대한 귀무가설 채택/기각 여부와 그렇게 생각한 이유를 간략하게 설명해주세요.
✍나의 답
# 데이터 분리
# mask method
mask=(df['Gender']=='Male')
mask1 = (df['Gender']=='Female')

m_rr =df[mask]
f_rr =df[mask1]

# 별점 컬럼만 가져오기
m_rr=m_rr[['Review Rating']]
f_rr=f_rr[['Review Rating']]

# t-test
t, pvalue = stats.ttest_ind(f_rr, m_rr)

#결과 출력
print(f"t-score: {t}")
print(f"p-value: {pvalue}")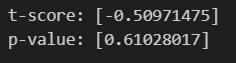
✍튜터님 답
mask=(df['Gender']=='Male')
mask1 = (df['Gender']=='Female')
m_df = df[mask]
f_df = df[mask1]

# 결제금액 컬럼만 가져오기
m_df=m_df[['Review Rating']]
f_df=f_df[['Review Rating']]

t, pvalue=stats.ttest_ind(f_df, m_df)

t, pvalue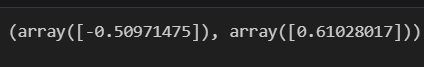
필수 3. 통계적 가설검정2
- Color, Season 컬럼에 대한 카이제곱 검정을 진행해주세요.
- 귀무가설과 대립가설을 작성해주세요.
- 두 범주형 자료의 빈도표를 만들어주세요. 이를 코드로 작성하여 기재해주세요.
- 카이제곱통계량, P-value 를 구해주세요.
- 그리고 이에 대한 귀무가설 채택/기각 여부와 그렇게 생각한 이유를 간략하게 설명해주세요.
✍나의 답
#빈도표 만들기
result = pd.crosstab(df['Color'],df['Season'])

#카이제곱검정
stats.chi2_contingency(observed=result)

#검정통계량
Chi_square = stats.chi2_contingency(observed=result)[0]
#p-value
p_value = stats.chi2_contingency(observed=result)[1]

#결과 출력
print(f"검정통계량: {Chi_square:.2f}")
print(f"p-value: {p_value:.2f}")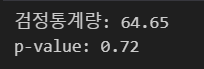
✍튜터님 답
result = pd.crosstab(df['Color'], df['Season'])
stats.chi2_contingency(observed=result)
필수 4. 머신러닝1
- 아래와 같은 데이터가 있다고 가정하겠습니다.데이터를 바탕으로 선형 회귀 모델을 훈련시키고, 회귀식을 작성해주세요.
- 독립 변수(X): 광고예산 (단위: 만원)
- 종속 변수(Y): 일일 매출 (단위: 만원)
- X=[10, 20, 30, 40, 60, 100]
- Y=[50, 60, 70, 80, 90, 120]
- 회귀식을통해, 새로운 광고예산이 1,000만원일 경우의 매출을 예측(계산)해주세요.
✍나의 답
import numpy as np
from sklearn.linear_model import LinearRegression

#데이터 정의
X = np.array([10, 20, 30, 40, 60, 100])
y = np.array([50, 60, 70, 80, 90, 120])

# 1차원 -> 2차원 변경
X = X.reshape(-1, 1)

# 단순선형회귀 모델 선언
model = LinearRegression()

# 모델 학습
model.fit(X, y)

# 회귀 계수와 절편
W = model.coef_  # 회귀 계수
b = model.intercept_  # 절편

# 새로운 광고 예산
ad = 1000

# 회귀식을 사용하여 예측
predict = W * ad + b

print(W)
print(b)
print(f"예상 매출 : {predict}")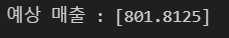
✍튜터님 답
from sklearn.linear_model import LinearRegression

# 데이터
X = np.array([10, 20, 30, 40, 60, 100]).reshape(-1, 1)
Y = np.array([50, 60, 70, 80, 90, 120])

# 모델 훈련
model = LinearRegression()
model.fit(X, Y)
# 회귀식
coef, intercept = model.coef_[0], model.intercept_
print(f"회귀식: Y = {coef:.2f}X + {intercept:.2f}")

# 예측
predicted_sales = model.predict(np.array([[1000]]))
print(f"1000만원 광고비일 때 예상 매출: {predicted_sales[0]:.2f}만원")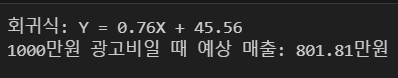
도전 1. 머신러닝2
- Review Rating, Age, Previous Purchases 컬럼을 활용하여, 고객이 할인(Discount Applied)을 받을지 예측하는 RandomForest모델을 학습시켜 주세요. 그리고 모델 정확도를 계산해주세요.
- y(종속변수)는 Yes/No 로 기재된 이진형 데이터입니다. 따라서, 인코딩 작업이 필요합니다. 구현을 위해 LabelEncoder를 사용해주세요.
- 머신러닝시, 전체 데이터셋을 Train set과 Test set 으로 나눠주세요. 해당 문제에서는Test set비중을 30%로 설정해주세요. random_state는 42로 설정해주세요.
- Train Set: 모델을 학습하는데 사용하는 데이터셋
- Test Set: 적합된 모델의 성능을 평가하는데 사용하는 데이터셋
- RandomForestClassifier 를 활용하여 모델 학습을 진행해주세요. random_state는 42로 설정해주세요.
- 참고) https://www.ibm.com/kr-ko/topics/random-forest
✍나의 답
from sklearn.ensemble import RandomForestClassifier
from sklearn.preprocessing import LabelEncoder
from sklearn.metrics import accuracy_score
from sklearn.model_selection import train_test_split

#라벨인코딩
le = LabelEncoder()
df['Discount Applied'] = le.fit_transform(df['Discount Applied'])

#데이터 정의
X = df[['Review Rating', 'Age', 'Previous Purchases']]
y = df['Discount Applied']

# 학습 데이터와 테스트 데이터 분리
X_train, X_test, y_train, y_test = train_test_split(X, y, test_size=0.3, random_state=42)

# 랜덤포레스트 모델 선언
rf_model = RandomForestClassifier(random_state=42)

#모델 학습
rf_model.fit(X_train, y_train)

# 예측 및 정확도 계산
accuracy = rf_model.score(X_test, y_test)

print(f"모델 정확도: {accuracy:.2f}")

# 모델 정확도 확인하는 다른 방법
# y_pred = rf_model.predict(X_test)
# accuracy = accuracy_score(y_test, y_pred)
✍튜터님 답
from sklearn.ensemble import RandomForestClassifier
from sklearn.model_selection import train_test_split
from sklearn.preprocessing import LabelEncoder

# 데이터 준비
X = df[['Review Rating', 'Age', 'Previous Purchases']]
y = LabelEncoder().fit_transform(df['Discount Applied'])

# 데이터 분할
X_train, X_test, y_train, y_test = train_test_split(X, y, test_size=0.3, random_state=42)

# 모델 학습
rf_model = RandomForestClassifier(random_state=42)
rf_model.fit(X_train, y_train)

# 예측
accuracy = rf_model.score(X_test, y_test)
print(f"모델 정확도: {accuracy:.2f}")
도전 2. 머신러닝3
- Subscription Status 컬럼을 종속변수로 사용하여 고객의 이탈 여부를 예측하는 로지스틱 회귀 모델 학습을 진행해주세요. Age, Purchase Amount, Review Rating을 활용하여 모델을 훈련한 후, 연령 30세, 구매 금액 50 USD, 리뷰 평점 4.0인 고객의 이탈 확률을 계산해주세요.
- y(종속변수)는 Yes/No 로 기재된 이진형 데이터입니다. 따라서, 인코딩 작업이 필요합니다. 구현을 위해 LabelEncoder를 사용해주세요.
- 머신러닝시, 전체 데이터셋을 Train set과 Test set 으로 나눠주세요. 해당 문제에서는Test set비중을 30%로 설정해주세요. random_state는 42로 설정해주세요.
- Train Set: 모델을 학습하는데 사용하는 데이터셋
- Test Set: 적합된 모델의 성능을 평가하는데 사용하는 데이터셋
- 연령 30세, 구매 금액 50 USD, 리뷰 평점 4.0 인 고객을 new_customer 라는 변수에 지정해주세요. 1차원이 아닌 이중 대괄호
[[...]]로 지정해주세요. (모델 입력 형식은 2차원 배열이어야 하므로) - model.predict_proba 를 사용하여 이탈 확률을 구해주세요.
- predict_proba의 반환값: 모델이 각 클래스에 속할 확률을 계산합니다. 결과는 다음과 같은 배열로 반환됩니다.
- [[P(클래스 0), P(클래스 1)]]
- P(클래스 0): 이 고객이 이탈하지 않을 확률.
- P(클래스 1): 이 고객이 이탈할 확률.
✍나의 답
from sklearn.linear_model import LogisticRegression
from sklearn.preprocessing import LabelEncoder
from sklearn.model_selection import train_test_split

#라벨인코딩
le = LabelEncoder()
df['Subscription Status'] = le.fit_transform(df['Subscription Status'])

#데이터 정의
X = df[['Age', 'Purchase Amount (USD)', 'Review Rating']]
y = df['Subscription Status']


# 학습 데이터와 테스트 데이터 분리
X_train, X_test, y_train, y_test = train_test_split(X, y, test_size=0.3, random_state=42)

# 로지스틱회귀 모델 선언
Log_model=LogisticRegression()

# 모델 학습
Log_model.fit(X_train, y_train)

# 고객에 대한 변수 지정
new_customer = pd.DataFrame([[30,50,4.0]])

# 이탈확률 구하기
predict_customer = Log_model.predict_proba(new_customer)

prob1 = predict_customer[0][0]
prob2 = predict_customer[0][1]

print(f"{prob1:.2f}: 고객이 이탈하지 않을 확률입니다.")
print(f"{prob2:.2f}: 고객이 이탈할 확률입니다.")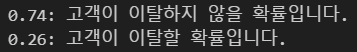
✍튜터님 답
from sklearn.model_selection import train_test_split
from sklearn.linear_model import LogisticRegression
from sklearn.preprocessing import LabelEncoder

# 데이터 준비
X = df[['Age', 'Purchase Amount (USD)', 'Review Rating']]
y = LabelEncoder().fit_transform(df['Subscription Status'])

# 데이터 분할
X_train, X_test, y_train, y_test = train_test_split(X, y, test_size=0.3, random_state=42)

# 모델 학습
model = LogisticRegression()
model.fit(X_train, y_train)

# 새로운 데이터 예측
new_customer = [[30, 50, 4.0]]
predicted_prob = model.predict_proba(new_customer)[0, 1]

print(f"연령 30세, 구매 금액 50, 리뷰 평점 4.0인 고객의 이탈 확률: {predicted_prob:.4f}")

It's a, it's the Pleasure Shop