우리는 트레이 영을 중심으로 팀을 리빌딩하기로 했기 때문에 트레이 영의 장점과 단점에 대한 파악이 필요했다.
1) 트레이 영의 시즌별 평균 성적 구하기
아래와 같은 파이썬 코드로 트레이영의 시즌별 평균 성적을 구해보았다.
# 트레이영의 시즌별 평균 성적 구하기(2018-2021)

# 'games'와 'games_details' 병합하여 'SEASON' 정보 추가
df = pd.merge(games, games_details, on='GAME_ID', how='inner')

# Trae Young의 데이터만 필터링하고, 2018년 이후 시즌 데이터만 선택
trae_young_data = df[(df['PLAYER_NAME'] == 'Trae Young') & (df['SEASON'].between(2018, 2022)) & df['COMMENT'].isnull()]

# 결측치가 특정 값으로 대체
trae_young_data.fillna(0, inplace=True)  # 결측치를 0으로 대체

# Trae Young의 시즌별 평균 성적 계산
seasonal_avg_trae_stats = trae_young_data.groupby('SEASON').agg(
    average_pts=pd.NamedAgg(column='PTS', aggfunc='mean'),
    field_goal_pct=pd.NamedAgg(column='FG_PCT', aggfunc='mean'),
    three_pt_pct=pd.NamedAgg(column='FG3_PCT', aggfunc='mean'),
    free_throw_pct=pd.NamedAgg(column='FT_PCT', aggfunc='mean'),
    average_ast=pd.NamedAgg(column='AST', aggfunc='mean'),
    average_reb=pd.NamedAgg(column='REB', aggfunc='mean'),
    average_oreb=pd.NamedAgg(column='OREB', aggfunc='mean'),
    average_dreb=pd.NamedAgg(column='DREB', aggfunc='mean'),
    average_stl=pd.NamedAgg(column='STL', aggfunc='mean'),
    average_blk=pd.NamedAgg(column='BLK', aggfunc='mean'),
    average_tov=pd.NamedAgg(column='TO', aggfunc='mean'),
    average_pf=pd.NamedAgg(column='PF', aggfunc='mean')
).reset_index()

# 결과 출력
display(seasonal_avg_trae_stats)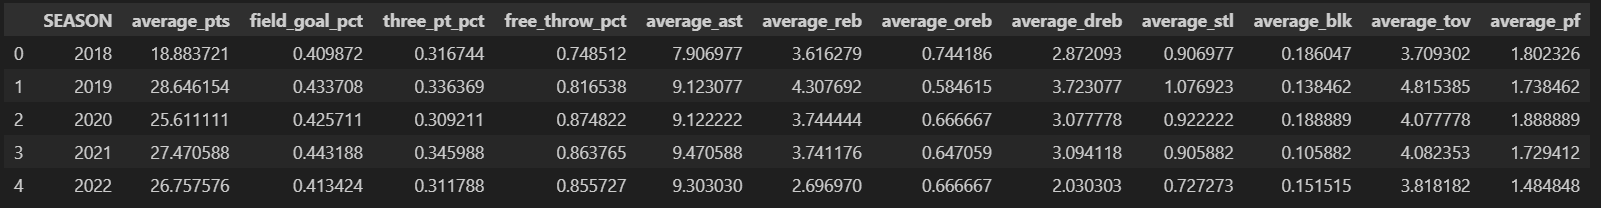
결과값은 이렇게 나왔는데 결과를 좀 더 예쁘게 보기 위해 테이블을 재구성 해주었다.
#비율을 나타내는 칼럼은 퍼센트 비율로 바꾸고,
#나머지 칼럼은 소수 두번째 자리까지 표시
df2 = seasonal_avg_trae_stats[['SEASON','average_pts', 'average_ast', 'average_reb', 'average_oreb',
'average_dreb', 'average_stl', 'average_blk', 'average_tov','average_pf']].round(2)
df3 = seasonal_avg_trae_stats[['field_goal_pct','three_pt_pct','free_throw_pct']].mul(100).round(2)
#원하는 표로 재구성
seasonal_avg_trae_stats = pd.concat([df2, df3], axis = 1)
seasonal_avg_trae_stats = seasonal_avg_trae_stats[['SEASON', 'average_pts', 'field_goal_pct', 'three_pt_pct', 'free_throw_pct', 'average_ast', 'average_reb',
'average_ast', 'average_reb', 'average_oreb','average_dreb', 'average_stl', 'average_blk', 'average_tov','average_pf']]
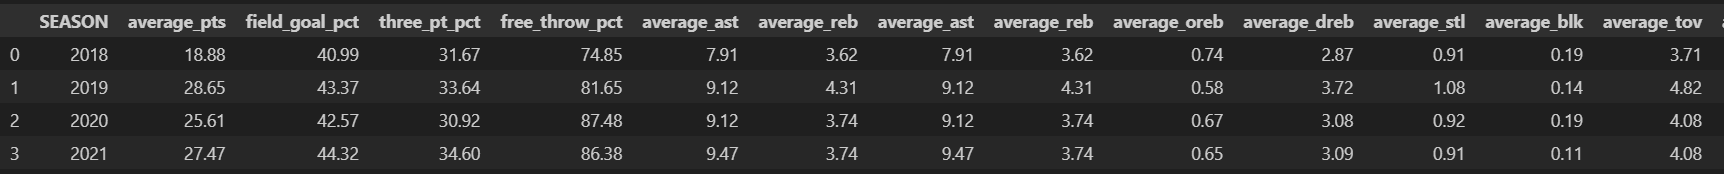
seasonal_avg_trae_stats아래와 같이 좀 더 가독성이 좋은 예쁘 수치로 표현되었다.
2) 리그 주전 가드의 평균 성적 구하기
트레이 영과 같은 방식으로 리그 주전 가드들의 평균 성적을 구해보았습니다.
#주전 가드 포지션 선수들의 시즌별 평균 성적 구하기(2018-2021)

# 'games'와 'games_details' 데이터프레임을 병합하여 'SEASON' 정보 추가
df = pd.merge(games, games_details, on='GAME_ID', how='inner')

# 2018년 이후 데이터만 필터링
df = df[df['SEASON'].between(2018, 2021)]

# 주전 선수 중 가드 포지션 선수들만 필터링 (예: 'G', 'PG', 'SG')
guard_players = df[(df['START_POSITION'].isin(['G', 'PG', 'SG'])) & df['START_POSITION'].notna() & df["COMMENT"].isnull()]

# 결측치가 많은 열 제거 또는 특정 값으로 대체
guard_players.fillna(0, inplace=True)

# 시즌별 가드 포지션 평균 성적 계산
seasonal_avg_guard_stats = guard_players.groupby('SEASON').agg(
    average_pts=pd.NamedAgg(column='PTS', aggfunc='mean'),
    field_goal_pct=pd.NamedAgg(column='FG_PCT', aggfunc='mean'),
    three_pt_pct=pd.NamedAgg(column='FG3_PCT', aggfunc='mean'),
    free_throw_pct=pd.NamedAgg(column='FT_PCT', aggfunc='mean'),
    average_ast=pd.NamedAgg(column='AST', aggfunc='mean'),
    average_reb	=pd.NamedAgg(column='REB', aggfunc='mean'),
    average_oreb =pd.NamedAgg(column='OREB', aggfunc='mean'),
    average_dreb =pd.NamedAgg(column='DREB', aggfunc='mean'),
    average_stl=pd.NamedAgg(column='STL', aggfunc='mean'),
    average_blk=pd.NamedAgg(column='BLK', aggfunc='mean'),
    average_tov=pd.NamedAgg(column='TO', aggfunc='mean'),
    average_pf=pd.NamedAgg(column='PF', aggfunc='mean')
).reset_index()
seasonal_avg_guard_stats
똑같은 방식으로 표를 예쁘게 만들어 주었습니다.
#비율을 나타내는 칼럼은 퍼센트 비율로 바꾸고, 나머지 칼럼은 소수 두번째 자리까지 표시
df4 = seasonal_avg_guard_stats[['SEASON','average_pts', 'average_ast', 'average_reb', 'average_oreb',
       'average_dreb', 'average_stl', 'average_blk', 'average_tov',
       'average_pf']].round(2)
df5 = seasonal_avg_guard_stats[['field_goal_pct','three_pt_pct','free_throw_pct']].mul(100).round(2)
#원하는 표로 재구성
seasonal_avg_guard_stats = pd.concat([df4, df5], axis = 1)
seasonal_avg_guard_stats.columns
seasonal_avg_guard_stats = seasonal_avg_guard_stats[['SEASON', 'average_pts', 'field_goal_pct', 'three_pt_pct', 'free_throw_pct', 'average_ast', 'average_reb', 'average_oreb',
       'average_dreb', 'average_stl', 'average_blk', 'average_tov',
       'average_pf']]
seasonal_avg_guard_stats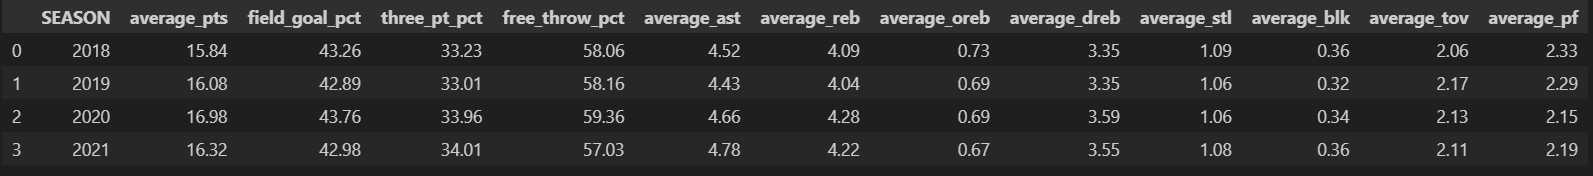
3) 트레이 영과 리그 주전 가드 평균 성적 비교하기
#트레이 영과 리그 주전 가드 선수들의 평균 성적 비교(수비 지표 위주)

# 그래프로 비교할 시즌 목록
seasons = seasonal_avg_guard_stats['SEASON'].values

# 비교할 주요 통계 리스트
stats_to_compare = ['average_dreb','average_stl', 'average_blk','average_tov']

# 그래프 타이틀과 y축 레이블에 표시할 한글 이름
stat_titles = {
    'average_dreb': '평균 수비 리바운드',
    'average_stl': '평균 스틸',
    'average_blk': '평균 블락',
    'average_tov' : '평균 턴오버'
}
# y축 레이블을 위한 별도의 딕셔너리
stat_y_labels = {
    'average_dreb': '평균 수비 리바운드(개수)',
    'average_stl': '평균 스틸(개수)',
    'average_blk': '평균 블락(%)',
    'average_tov' : '평균 턴오버(개수)'
}

# 그래프 그리기
fig, axes = plt.subplots(len(stats_to_compare), 1, figsize=(10, 15))
fig.suptitle("트레이 영과 리그 주전 가드 평균 성적 비교 (수비 지표 위주)", fontsize=16, fontweight='bold')

for i, stat in enumerate(stats_to_compare):
    # 첫 번째 plot에서는 label을 지정하여 범례에 추가
    axes[i].plot(seasons, seasonal_avg_trae_stats[stat], label="트레이 영", marker='s', color='tab:red')
    axes[i].plot(seasons, seasonal_avg_guard_stats[stat], label="주전 가드", marker='o', color='tab:blue')

    # 그래프 제목과 축 레이블 설정
    axes[i].set_title(f"{stat_titles[stat]} 시즌별 비교")
    axes[i].set_xlabel("시즌")
    axes[i].set_ylabel(stat_y_labels[stat])

    # 가로축에 표시할 시즌 설정
    axes[i].set_xticks([2018, 2019, 2020, 2021])  # 표시할 시즌 설정
    axes[i].set_xticklabels([2018, 2019, 2020, 2021])  # 가로축 레이블 설정

    # 격자 추가
    axes[i].grid(True)  # 격자무늬 추가

    # 범례 설정 (중복 제거를 위해 각 plot에서 label을 한 번만 지정)
    handles, labels = axes[i].get_legend_handles_labels()
    by_label = dict(zip(labels, handles))
    axes[i].legend(by_label.values(), by_label.keys())

plt.tight_layout(rect=[0, 0, 1, 0.96])
plt.show()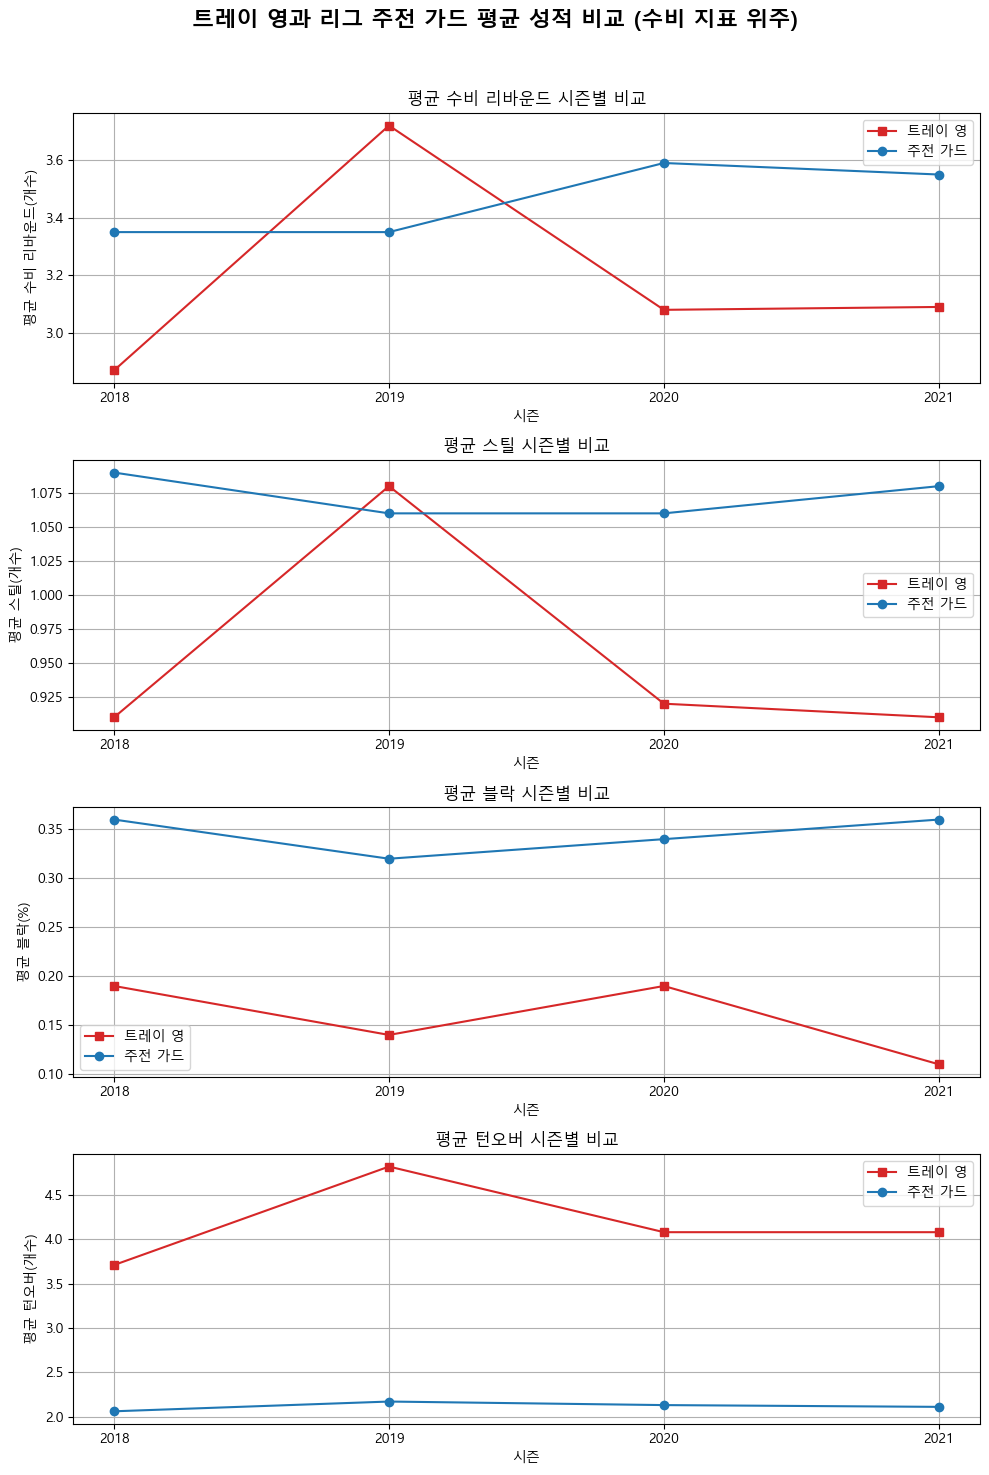
#트레이 영과 리그 주전 가드 선수들의 평균 성적 비교(공격 지표 위주)
#그래프로 비교할 시즌 목록
seasons = seasonal_avg_guard_stats['SEASON'].values

# 비교할 주요 통계 리스트
stats_to_compare = ['average_pts','average_ast','average_oreb']

# 그래프 타이틀과 y축 레이블에 표시할 한글 이름
stat_titles = {
    'average_pts': '시즌별 득점 그래프',
    'average_ast': '평균 어시스트',
    'average_oreb' : '공격 리바운드'
}

# y축 레이블을 위한 별도의 딕셔너리
stat_y_labels = {
    'average_pts': '시즌별 득점 그래프(point)',
    'average_ast': '평균 어시스트(개수)',
    'average_oreb' : '공격 리바운드(개수)'
}

# 그래프 그리기
fig, axes = plt.subplots(len(stats_to_compare), 1, figsize=(10, 15))
fig.suptitle("트레이 영과 리그 주전 가드 평균 성적 비교 (공격 지표 위주)", fontsize=16, fontweight='bold')

for i, stat in enumerate(stats_to_compare):
    # 첫 번째 plot에서는 label을 지정하여 범례에 추가
    axes[i].plot(seasons, seasonal_avg_trae_stats[stat], label="트레이 영", marker='s', color='tab:red')
    axes[i].plot(seasons, seasonal_avg_guard_stats[stat], label="리그 주전 가드", marker='o', color='tab:blue')

    # 그래프 제목과 축 레이블 설정
    axes[i].set_title(stat_titles[stat], fontsize=15)  # 타이틀 설정
    axes[i].set_xlabel("시즌")  # x축 레이블 설정
    axes[i].set_ylabel(stat_y_labels[stat])  # y축 레이블 설정

        # 가로축에 표시할 시즌 설정
    axes[i].set_xticks([2018, 2019, 2020, 2021])  # 표시할 시즌 설정
    axes[i].set_xticklabels([2018, 2019, 2020, 2021])  # 가로축 레이블 설정

    # 격자 추가
    axes[i].grid(True)  # 격자무늬 추가

    # 범례 설정 (중복 제거를 위해 각 plot에서 label을 한 번만 지정)
    handles, labels = axes[i].get_legend_handles_labels()
    by_label = dict(zip(labels, handles))
    axes[i].legend(by_label.values(), by_label.keys())

plt.tight_layout(rect=[0, 0, 1, 0.96])
plt.show()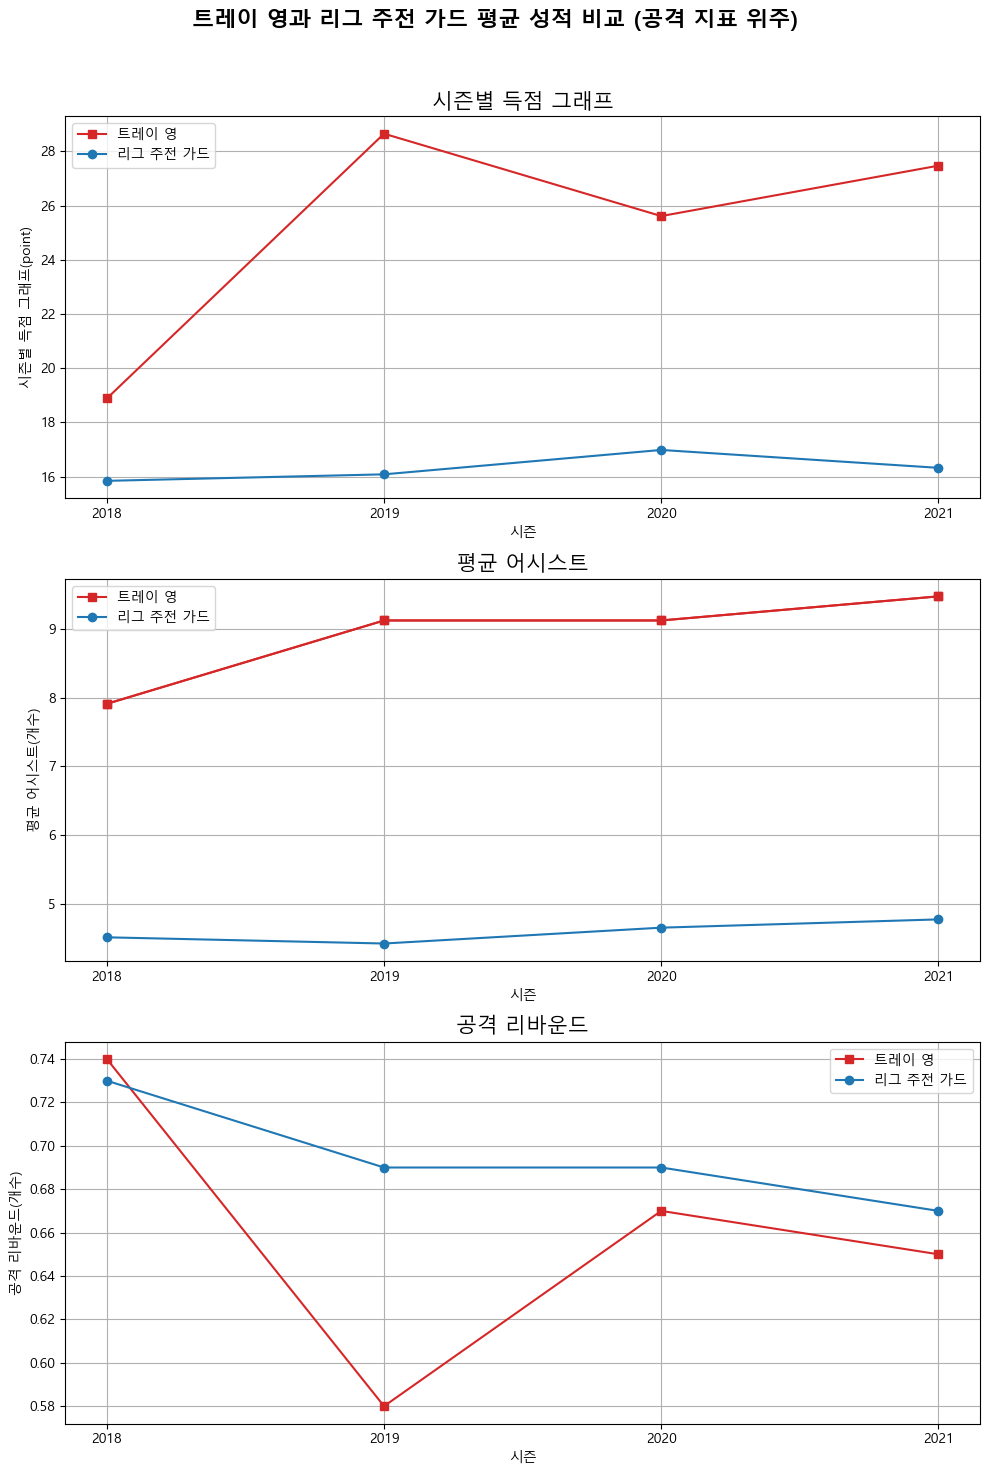
결론적으로 트레이 영의 리그 탑급의 득점 능력, 어시스트 능력을 보여주고 있지만 수비에서 단점이 있는 선수라는 것을 데이터 분석을 통해 알 수 있었습니다.

It's a, it's the Pleasure Shop