AutoGen Docs
https://microsoft.github.io/autogen/0.2/docs/Getting-Started
Getting Started
AutoGen은 AI 에이전트를 구축하고, 여러 에이전트 간의 협업을 통해 과제를 해결할 수 있도록 지원하는 오픈소스 프로그래밍 프레임워크이다.
AutoGen의 목표는 에이전트 기반(agentic AI) 개발과 연구를 더 빠르고 유연하게 진행할 수 있도록 PyTorch가 딥러닝에 그러하듯 쉽고 강력한 프레임워크를 제공하는 것이다.
AutoGen은 다음과 같은 주요 기능을 제공한다.
- converse with other agents (에이전트 간의 대화 기능)
- LLM and Tool use support (LLM 및 다양한 도구 활용 지원)
- autonomous and human-in-the loop workflows (완전 자율형 및 인간 개입형(human-in-the-loop) 워크플로우
- multi-agent conversation patterns (다중 에이전트 간 대화 패턴 구성)
쉽게 말해 AutoGen은 여러 AI들이 서로 협업해서 문제를 해결하는 시스템을 손쉽게 만들 수 있게 도와주는 툴이다.
아래의 그림은 에이전트 기반 대화 시스템에서 Agent Customization(에이전트 커스터마이징), Multi-Agent Conversations(다중 에이전트 대화), Flexible Conversation Patterns(유연한 대화 패턴)을 설명하는 것이다.
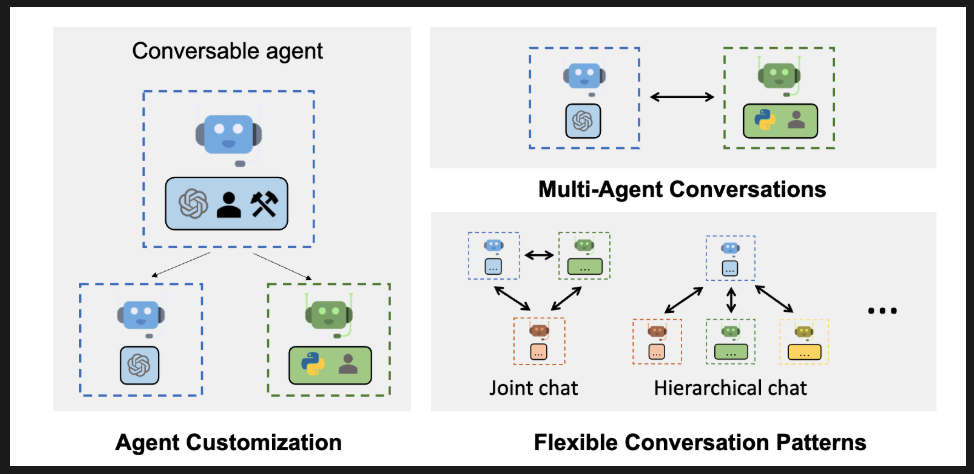
위 그림에서 보면 좌측 상단에 Conversable agent 가 나오는데, AutoGen에서 가장 기본이 되는 '말할 수 있는 에이전트(대화 가능한 에이전트)' 이다.
이 에이전트는 다른 에이전트와 메시지를 주고받을 수 있고, 주어진 역할(system message)에 따라 대화에 참여하며, LLM을 기반으로 자기 답변을 생성한다.
아래에 두 개의 분리된 박스가 있고, 이는 Agent Customization(에이전트 커스터마이징)을 의미한다. 왼쪽의 파란 박스는 기본 OpenAI 기반의 챗봇 에이전트이고 오른쪽 녹색 박스는 python 코드와 사용자 정의 아이콘이 추가된 커스텀 에이전트이다.
즉, 에이전트는 기본 모델을 기반으로 개별 사용자 목적에 맞게 확장 가능하다는 의미이다.
오른쪽 상단의 Multi-Agent Conversations 은 다중 에이전트 대화로, 파란색 에이전트와 초록 에이전트가 양방향 화살표로 연결되어 있다. 이것은 서로 다른 기능을 가진 두 에이전트가 동시에 협업하여 대화에 참여할 수 있다는 것을 보여준다. 예를 들면 하나는 언어 번역, 하나는 데이터 분석이 될 수 있다.
오른쪽 하단의 Flexible Conversation Patterns (유연한 대화 패턴)은 두 가지 하위 패턴으로 나뉘고 있는데 (1) Joint chat (공동 대화)로 여러 에이전트가 동등한 관계로 서로 사용자와 같이 대화한다. 화살표가 모든 방향으로 연결된 모습에서 협업적 구조가 보인다.
(2) Hierarchical chat(계층형 대화)는 하나의 상위 에이전트가 여러 하위 에이전트를 조율한다. 각 하위 에이전트는 특정한 기능이나 도메인을 담당하고, 상위 에이전트가 이를 통합해서 사용자와 소통한다. 에를 들면 메인 에이전트가 "문서 요약 요청"을 받아 하위 에이전트들에게 각 파트를 나눠 수행하게 하는 것이다.
즉 정리해보자면
- Agent Customization : 에이전트를 사용자의 목적에 맞게 확장 가능
- Multi-Agent Conversations : 여러 에이전트 간 상호작용이 가능한 구조
- Flexible Conversation Patterns : 공동 or 계층형 구조로 유연한 대화 흐름 지원
하는 것이다. 각 개념에 대한 실제 활용 시나리오를 들어서 구체적인 사례를 살펴 보자.
1. Agent Customization (에이전트 커스터마이징)
기본 에이전트를 사용자가 목적에 맞게 수정하거나 확장하는 것이다.
예를 들면 고객 응대 에이전트를 예로 들 수 있는데, 기본 GPT 에이전트에 고객 응대 스크립트, 회사 정책, FAQ 데이터를 넣어서 특정 기업용 챗봇으로 커스터마이징 하는 것이다. "배송 지연 관련 문의는 이렇게 답변하세요" 등의 템플릿을 적용할 수 있다.
코딩 도우미 에이전트로는 GPT 기반에 python 실행 환경을 연동시켜서 코드 작성 + 실행 + 디버깅까지 가능하게 확장하는 것이다. "이 함수 성능 개선해줘" 라고 했을 때, 코드도 분석하고 결과도 직접 실행해서 보여줄 수 있다.
2. Multi-Agent Conversations (다중 에이전트 대화)
서로 다른 역할을 가진 에이전트들이 동시에 하나의 대화에 참여하는 것이다.
예를 들면 번역+요약 이중 에이전트가 있는데, 사용자가 문서를 업로드하면 번역 에이전트가 외국어 문서를 한국어로 번역하고, 요약 에이전트가 번역된 결과를 핵심 요약하는 것이다.
즉, 두 에이전트가 대화를 주고받으며 작업을 분담하는 것이다.
대화형 코드 리뷰 에이전트로는 한 에이전트는 코드 스타일 체크, 다른 에이전트는 보안 문제 점검, 또 다른 에이전트는 성능 개선을 제안하는 것이다. 사용자는 하나의 대화창에서 각기 다른 피드백을 실시간으로 받는다.
3. Flexible Conversation Patterns (유연한 대화 패턴)
유연한 대화 패턴으로는 joint Chat(공동 대화), Hierarchical Chat(계층형 대화)가 있다.
joint chat은 에이전트들 간의 평등한 협업 구조로
협업 디자인 에이전트를 만든다면, 한 에이전트는 UI 스타일 가이드를 담당, 다른 에이전트는 UX 피드백을 분석해서 사용자는 두 에이전트와 함께 대화하며 디자인 방향을 결정하는 것이다.
Hierarchical Chat 은 하나의 마스터 에이전트가 여러 하위 에이전트를 통제하는 구조이다. 예를 들어 프로젝트 메니저 에이전트를 만든다면 메인 에이전트가 사용자의 명령을 받아, 일정 계획, 예산 검토, 인력 배치를 해야할 때 일정 계획으로 타임라인 에이전트를 호출하고 예산을 검토하기 위해 재무 분석 에이전트를 호출하고 인력 배치를 위해 인사 담당 에이전트를 호출하는 것이다. 그리고 결과를 통합해서 사용자에게 종합으로 보고한다.
리서치 논문 요약 에이전트를 만든다면, 메인 에이전트가 논문 요약해줘. 라는 요청을 받았을 때 1장~5장 까지 각각의 하위 에이전트에 분산 처리해서 각 요약 결과를 취합해 하나의 통합 요약을 생성하는 것이다.
Main Features (주요 기능)
-
AutoGen은 multi-agent conversations(다중 에이전트 대화) 기반의 차세대 LLM 애플리케이션을 적은 노력으로 쉽게 구축할 수 있도록 지원한다. 복잡한 LLM 워크플로우의
orchestration(오케스트레이션, 조율),automation(자동화),optimization(최적화)를 단순화해서 LLM 모델의 성능을 극대화하고 약점을 보완할 수 있게 한다. -
AutoGen은 복잡한 워크플로우를 위한 diverse conversation patterns(다양한 대화패턴)도 지원한다.
-
AutoGen은 실제 작동하는 다양한 예제 시스템들을 제공한다. 이 시스템들은 다양한 분야와 복잡성을 가지고 있다. AutoGen이 얼마나 쉽게 다양한 대화 패턴을 지언할 수 있는지를 보여준다.
Multi-Agent conversation,diverse conversation patterns,wide range of applications에 대해서는 Tutorial 섹션 후에 Use Cases 섹션의 Multi-agent Conversation Framework에서 자세히 다뤄보겠다.
이러한 AutoGen은 Microsoft, Penn state University(펜실베이니아 주립대), University of Washington(워싱턴 대학교)의 공동 연구를 기반으로 만들어졌다.
QuickStart
v.0.2를 기준으로 하였기 때문에 autogen-agentchat을 0.2로 맞췄다.
pip install autogen-agentchat~=0.2여기서는 no code execution, local execution, Docker execution 총 세 가지의 모드가 나온다.
no code execution은 에이전트가 코드를 짜긴 하지만 실행을 하지는 않고, LLM이 이런 코드는 어때? 하고 제안만 하고 끝나는 것
local execution은 에이전트가 만든 코드를 내 컴퓨터에서 직접 실행할 때
Docker execution은 코드를 도커 컨테이너 안에서 안전하게 실행할 때 사용한다. 이 경우는 시스템 분리나 보안상 이유로 유용하다.
no code execution
주어진 docs에는 아래와 같이 나와있는데,
아래 코드를 실행하면 에이전트의 종료 조건이 없어서 계속 돌아가는 상황이 생긴다.
import os
from autogen import AssistantAgent, UserProxyAgent

llm_config = { "config_list": [{ "model": "gpt-4", "api_key": os.environ.get("OPENAI_API_KEY") }] }
assistant = AssistantAgent("assistant", llm_config=llm_config)
user_proxy = UserProxyAgent("user_proxy", code_execution_config=False)

# Start the chat
user_proxy.initiate_chat(
    assistant,
    message="Tell me a joke about NVDA and TESLA stock prices.",
)
아래와 같이 max_turns 옵션을 1로 줘서 농담 한번 하고 답변을 보는 코드로 수정해서 테스트 했다.
import os
from autogen import AssistantAgent, UserProxyAgent

from config import settings

api_key = settings.openai_api_key.get_secret_value()
llm_config = {
    "config_list":
        [
            {
                "model" : "gpt-4o-mini",
                "api_key" : api_key
            }
        ]
}

assistant = AssistantAgent("assistant",llm_config=llm_config)
user_proxy = UserProxyAgent("user_proxy", code_execution_config=False)

# start the chat
user_proxy.initiate_chat(
    assistant,
    message="NVDA나 TESLA 주식 가격에 대한 농담을 해봐",
    max_turns=1
)

"""
user_proxy (to assistant):

NVDA나 TESLA 주식 가격에 대한 농담을 해봐

--------------------------------------------------------------------------------
assistant (to user_proxy):

주식 시장에서 NVDA와 TESLA 이야기를 하자면, 이렇게 농담할 수 있겠네요:

"NVDA 주식을 사면, 그래픽보다 더 선명한 미래를 볼 수 있다던데... TESLA 주식을 사면 차가 도로를 달리는 대신 주식이 더 빨리 상승하길 바랄 수 있겠죠!"

주식 시장은 진지하니 가끔은 이렇게 웃어넘기는 것도 좋겠네요!

TERMINATE

--------------------------------------------------------------------------------

>>>>>>>> TERMINATING RUN (6b0dda9a-3ccf-4733-8ab0-f8f087c8a839): Maximum turns (1) reached
ChatResult(chat_id=None, chat_history=[{'content': 'NVDA나 TESLA 주식 가격에 대한 농담을 해봐', 'role': 'assistant', 'name': 'user_proxy'}, {'content': '주식 시장에서 NVDA와 TESLA 이야기를 하자면, 이렇게 농담할 수 있겠네요:\n\n"NVDA 주식을 사면, 그래픽보다 더 선명한 미래를 볼 수 있다던데... TESLA 주식을 사면 차가 도로를 달리는 대신 주식이 더 빨리 상승하길 바랄 수 있겠죠!"\n\n주식 시장은 진지하니 가끔은 이렇게 웃어넘기는 것도 좋겠네요! \n\nTERMINATE', 'role': 'user', 'name': 'assistant'}], summary='주식 시장에서 NVDA와 TESLA 이야기를 하자면, 이렇게 농담할 수 있겠네요:\n\n"NVDA 주식을 사면, 그래픽보다 더 선명한 미래를 볼 수 있다던데... TESLA 주식을 사면 차가 도로를 달리는 대신 주식이 더 빨리 상승하길 바랄 수 있겠죠!"\n\n주식 시장은 진지하니 가끔은 이렇게 웃어넘기는 것도 좋겠네요! \n\n', cost={'usage_including_cached_inference': {'total_cost': 0.00013455, 'gpt-4o-mini-2024-07-18': {'cost': 0.00013455, 'prompt_tokens': 481, 'completion_tokens': 104, 'total_tokens': 585}}, 'usage_excluding_cached_inference': {'total_cost': 0}}, human_input=[])
"""
개노잼 농담을 하는데 max_turns을 1로 줌으로써 농담 하나를 반환하고 끝낼 수 있다. 아니면 human_input_mode="NEVER"를 넣어줘서 완전 자율 모드로 만들 수도 있다.
Local execution
import os
import autogen
from autogen import AssistantAgent, UserProxyAgent

llm_config = {"model": "gpt-4", "api_key": os.environ["OPENAI_API_KEY"]}
assistant = AssistantAgent("assistant", llm_config=llm_config)

user_proxy = UserProxyAgent(
    "user_proxy", code_execution_config={"executor": autogen.coding.LocalCommandLineCodeExecutor(work_dir="coding")}
)

# Start the chat
user_proxy.initiate_chat(
    assistant,
    message="Plot a chart of NVDA and TESLA stock price change YTD.",
)
Local execution 샘플 코드 또한 그대로 사용하면, 턴이 끝나지 않고 사용자의 입력을 필요로하는 로직이다.
human_input_mode=NEVER로 줘서 사람이 끼지 않고 자동으로 진행하게 만들고 max_turns=1 로 옵션을 줘서 한 턴의 응답만 보도록 하겠다.
import autogen

code_execution_config = {
    "executor" : autogen.coding.LocalCommandLineCodeExecutor(work_dir="coding")
}

assistant = AssistantAgent("assistant", llm_config=llm_config)
user_proxy = UserProxyAgent(
    "user_proxy", code_execution_config=code_execution_config
)

# start the chat

user_proxy.initiate_chat(
    assistant,
    message="Plot a chart of NVDA and TESLA stock price change YTD.",
    human_input_mode="NEVER",
    max_turns=1,
)

"""
user_proxy (to assistant):

Plot a chart of NVDA and TESLA stock price change YTD.

--------------------------------------------------------------------------------
assistant (to user_proxy):

To plot a chart of NVDA (NVIDIA) and TESLA (Tesla) stock price changes Year-To-Date (YTD), we will follow this plan:

1. Collect the YTD stock price data for both NVDA and TESLA. This will involve fetching the stock prices from a financial API.
2. Use the collected data to plot a chart comparing the two stock prices.

I will use the `yfinance` library to fetch the stock data and `matplotlib` to create the plot. First, let's create a Python script to accomplish this.

Please execute the following Python code to fetch the stock data and plot the graph.

```python
# filename: plot_stocks.py
import yfinance as yf
import matplotlib.pyplot as plt

# Define the stock symbols
symbols = ['NVDA', 'TSLA']

# Fetch the stock data for the year to date
data = yf.download(symbols, start='2023-01-01', end='2023-12-31')['Close']

# Plot the data
plt.figure(figsize=(10, 5))
for symbol in symbols:
    plt.plot(data.index, data[symbol], label=symbol)

plt.title('YTD Stock Price Change for NVDA and TESLA')
plt.xlabel('Date')
plt.ylabel('Stock Price (USD)')
plt.legend()
plt.grid()
plt.xticks(rotation=45)
plt.tight_layout()

# Show the plot
plt.show()

This code will download the closing prices of NVIDIA and Tesla from January 1, 2023, to the end of the year and then create a plot to visualize their stock price changes. Please run the script, and the chart should be displayed.

TERMINATE

--------------------------------------------------------------------------------

TERMINATING RUN (1e934dfc-c664-4d7d-9ebc-24c606336ec0): Maximum turns (1) reached
ChatResult(chat_id=None, chat_history=[{'content': 'Plot a chart of NVDA and TESLA stock price change YTD.', 'role': 'assistant', 'name': 'user_proxy'}, {'content': "To plot a chart of NVDA (NVIDIA) and TESLA (Tesla) stock price changes Year-To-Date (YTD), we will follow this plan:\n\n1. Collect the YTD stock price data for both NVDA and TESLA. This will involve fetching the stock prices from a financial API.\n2. Use the collected data to plot a chart comparing the two stock prices.\n\nI will use the `yfinance` library to fetch the stock data and `matplotlib` to create the plot. First, let's create a Python script to accomplish this.\n\nPlease execute the following Python code to fetch the stock data and plot the graph.\n\n```python\n# filename: plot_stocks.py\nimport yfinance as yf\nimport matplotlib.pyplot as plt\n\n# Define the stock symbols\nsymbols = ['NVDA', 'TSLA']\n\n# Fetch the stock data for the year to date\ndata = yf.download(symbols, start='2023-01-01', end='2023-12-31')['Close']\n\n# Plot the data\nplt.figure(figsize=(10, 5))\nfor symbol in symbols:\n    plt.plot(data.index, data[symbol], label=symbol)\n\nplt.title('YTD Stock Price Change for NVDA and TESLA')\nplt.xlabel('Date')\nplt.ylabel('Stock Price (USD)')\nplt.legend()\nplt.grid()\nplt.xticks(rotation=45)\nplt.tight_layout()\n\n# Show the plot\nplt.show()\n```\n\nThis code will download the closing prices of NVIDIA and Tesla from January 1, 2023, to the end of the year and then create a plot to visualize their stock price changes. Please run the script, and the chart should be displayed. \n\nTERMINATE", 'role': 'user', 'name': 'assistant'}], summary="To plot a chart of NVDA (NVIDIA) and TESLA (Tesla) stock price changes Year-To-Date (YTD), we will follow this plan:\n\n1. Collect the YTD stock price data for both NVDA and TESLA. This will involve fetching the stock prices from a financial API.\n2. Use the collected data to plot a chart comparing the two stock prices.\n\nI will use the `yfinance` library to fetch the stock data and `matplotlib` to create the plot. First, let's create a Python script to accomplish this.\n\nPlease execute the following Python code to fetch the stock data and plot the graph.\n\n```python\n# filename: plot_stocks.py\nimport yfinance as yf\nimport matplotlib.pyplot as plt\n\n# Define the stock symbols\nsymbols = ['NVDA', 'TSLA']\n\n# Fetch the stock data for the year to date\ndata = yf.download(symbols, start='2023-01-01', end='2023-12-31')['Close']\n\n# Plot the data\nplt.figure(figsize=(10, 5))\nfor symbol in symbols:\n    plt.plot(data.index, data[symbol], label=symbol)\n\nplt.title('YTD Stock Price Change for NVDA and TESLA')\nplt.xlabel('Date')\nplt.ylabel('Stock Price (USD)')\nplt.legend()\nplt.grid()\nplt.xticks(rotation=45)\nplt.tight_layout()\n\n# Show the plot\nplt.show()\n```\n\nThis code will download the closing prices of NVIDIA and Tesla from January 1, 2023, to the end of the year and then create a plot to visualize their stock price changes. Please run the script, and the chart should be displayed. \n\n", cost={'usage_including_cached_inference': {'total_cost': 0.00028155, 'gpt-4o-mini-2024-07-18': {'cost': 0.00028155, 'prompt_tokens': 481, 'completion_tokens': 349, 'total_tokens': 830}}, 'usage_excluding_cached_inference': {'total_cost': 0}}, human_input=[])

"""
엔비디아와 테슬라의 주식의 올해 들어 지금까지의 주가 변화의 차트를 그릴 수 있는 코드를 준다. 이 코드를 실행시켜 보면,
import yfinance as yf
import matplotlib.pyplot as plt

# Define the stock symbols
symbols = ['NVDA', 'TSLA']

# Fetch the stock data for the year to date
data = yf.download(symbols, start='2023-01-01', end='2023-12-31')['Close']

# Plot the data
plt.figure(figsize=(10, 5))
for symbol in symbols:
    plt.plot(data.index, data[symbol], label=symbol)

plt.title('YTD Stock Price Change for NVDA and TESLA')
plt.xlabel('Date')
plt.ylabel('Stock Price (USD)')
plt.legend()
plt.grid()
plt.xticks(rotation=45)
plt.tight_layout()

# Show the plot
plt.show()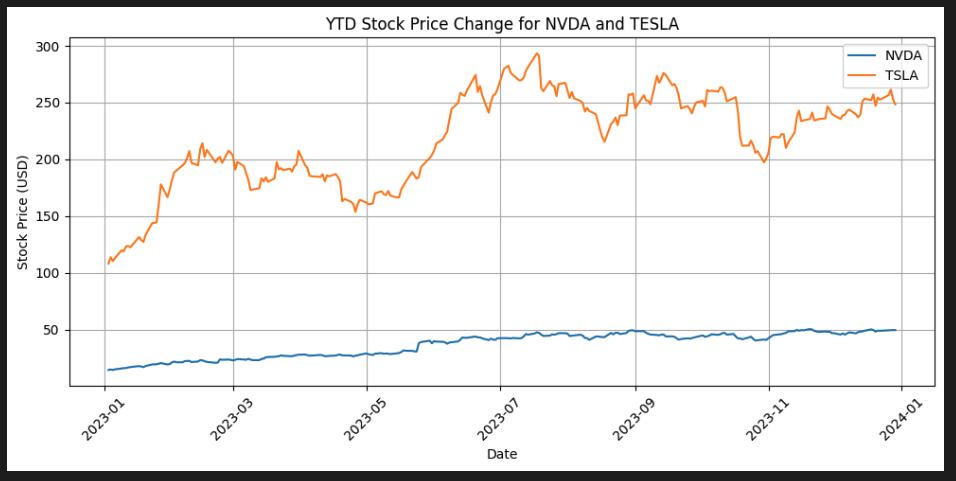
지금의 날짜는 2025년 4월 15일이긴 하지만, 2023년 1월부터 2024년 1월 까지의 차트를 그리는 코드가 잘 돌아가는 것을 볼 수 있다.
Multi-Agent Conversation Framework (다중 에이전트 대화 프레임 워크)
AutoGen은 차세대 LLM 애플리케이션을 위한 a generic multi-agent conversation framework(범용 다중 에이전트 대화 프레임워크)를 제공한다.
이 프레임워크는 LLM, tool(도구), customizable(사용자 정의 기능)과 conversable(대화 가능한) 에이전트들을 지원한다.
여러 유능한 에이전트 간의 대화를 자동화함으로써, 사용자는 이들을 통해 다음과 같은 작업을 손쉽게 수행할 수 있다.
- make them collectively perform tasks autonomously or with human feedback (자율적으로 작업을 협업 수행하거나, 인간의 피드백을 받아가며 문제를 해결하기)
- including tasks that require using tools via code (코드 실행이 필요한 도구 사용 작업)
docs에서 제공한 sample code는 아래의 github 링크를 확인(https://github.com/microsoft/autogen/blob/0.2/test/twoagent.py) 하면 되는데,
나는 vs code IDE 내에서 jupyter notebook로 실행하고 있어서 내 입맛에 맞춰서 바꿨다.
config_list 내에는 다른 모델을 넣으면 되는데 일단 gpt-4o-mini 만 넣어뒀다.
config_list = [
    {
        "model": "gpt-4o-mini",
        "api_key": api_key,
    }
]

llm_config = {
    "config_list": config_list,
}

assistant = AssistantAgent(
    name="assistant",
    llm_config=llm_config
)

user_proxy = UserProxyAgent(
    name="user_proxy",
    code_execution_config={
        "work_dir": "coding",
        "use_docker": False,
    },
    human_input_mode="NEVER"   # 자동으로 대화 진행
)

# 대화 시작 (YTD 주가 차트 요청)
user_proxy.initiate_chat(
    assistant,
    message="Plot a chart of NVDA and TESLA stock price change YTD.",
    max_turns=2  # 자동 종료를 위한 턴 수 제한
)
그러면 아래와 같이 shell output으로 아래의 결과를 볼 수 있다.
user_proxy (to assistant):

Plot a chart of NVDA and TESLA stock price change YTD.

--------------------------------------------------------------------------------
assistant (to user_proxy):

To plot a chart of NVDA (NVIDIA) and TESLA (Tesla) stock price changes Year-To-Date (YTD), we will follow this plan:

1. Collect the YTD stock price data for both NVDA and TESLA. This will involve fetching the stock prices from a financial API.
2. Use the collected data to plot a chart comparing the two stock prices.

I will use the `yfinance` library to fetch the stock data and `matplotlib` to create the plot. First, let's create a Python script to accomplish this.

Please execute the following Python code to fetch the stock data and plot the graph.

python
# filename: plot_stocks.py
import yfinance as yf
import matplotlib.pyplot as plt

# Define the stock symbols
symbols = ['NVDA', 'TSLA']

# Fetch the stock data for the year to date
data = yf.download(symbols, start='2023-01-01', end='2023-12-31')['Close']

# Plot the data
plt.figure(figsize=(10, 5))
for symbol in symbols:
    plt.plot(data.index, data[symbol], label=symbol)

plt.title('YTD Stock Price Change for NVDA and TESLA')
plt.xlabel('Date')
plt.ylabel('Stock Price (USD)')
plt.legend()
plt.grid()
plt.xticks(rotation=45)
plt.tight_layout()

# Show the plot
plt.show()

This code will download the closing prices of NVIDIA and Tesla from January 1, 2023, to the end of the year and then create a plot to visualize their stock price changes. Please run the script, and the chart should be displayed.

TERMINATE

--------------------------------------------------------------------------------

>>>>>>>> EXECUTING CODE BLOCK 0 (inferred language is python)...
user_proxy (to assistant):

exitcode: 0 (execution succeeded)
Code output:
YF.download() has changed argument auto_adjust default to True
Figure(1000x500)


--------------------------------------------------------------------------------
assistant (to user_proxy):

It looks like the code executed successfully, and the plot was generated without any issues. The message regarding `auto_adjust` is an informational message from the `yfinance` library indicating a change in behavior with its default settings but it does not affect the functionality of the code you executed.

Your chart showing the Year-To-Date stock price changes for NVDA and TESLA should now be displayed. If you need further analysis or modifications, please let me know.

TERMINATE

--------------------------------------------------------------------------------

TERMINATING RUN (4294d30c-7870-483b-90d5-f914dbfe8e6b): Maximum turns (2) reached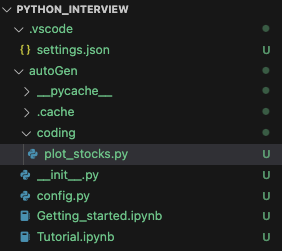
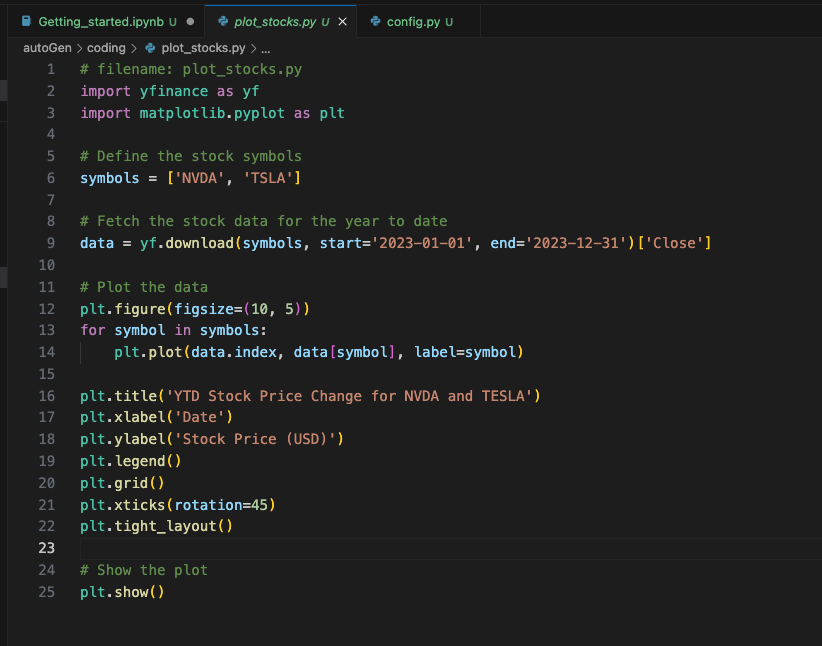
자동으로 위에서 지정해놓은 옵션으로 coding > plot_stocks.py에 아래와 같은 코드가 작성되어 있는 것을 볼 수 있다.
아래 그림은 AutoGen에서 다중 에이전트가 어떻게 대화를 통해 작업을 수행하는지 보여주는 대화 흐름의 예시이다.
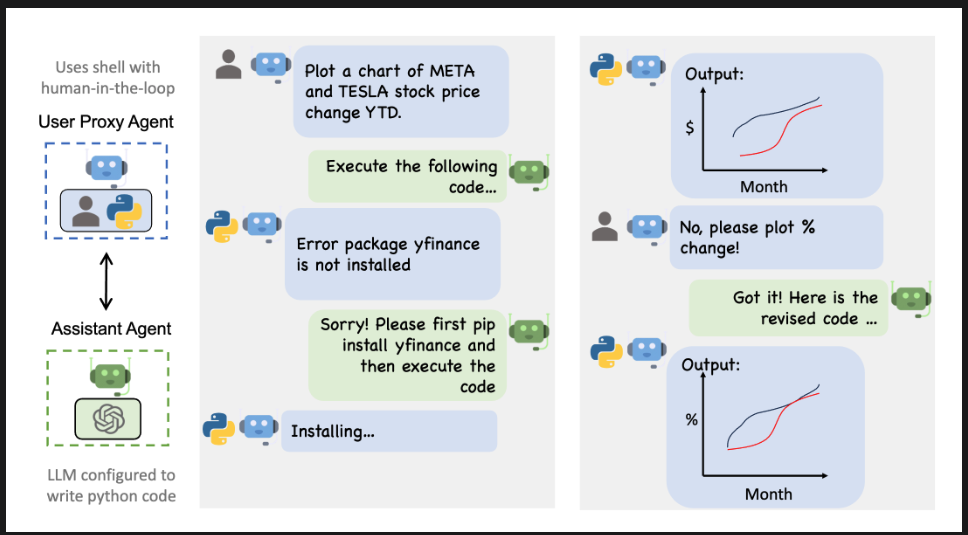
왼쪽부터 살펴보자면 파란 점선 박스인 User Proxy Agent는 human-in-th-loop 구조로 사용자와 직접 상호 작용을 하고, 사용자의 요청을 받아 그 요청을 Assistant Agent에 전달하고 그 결과를 다시 사용자에게 보여주는 프록시이다.
녹색 점선 박스의 Assistant Agent는 OpenAI 기반 LLM에 python 실행 기능이 추가된 에이전트로, 사용자 요청에 따라 python 코드를 생성한다. 생성한 코드를 User Proxy Agent에 전달해서 실행되도록 유도하는 역할이다.
두 에이전트 간의 연결은 코드 생성 <-> 실행 <-> 결과 확인 루프를 만들어 낸다.
그래서 중앙은 첫 번째 상호작용 흐름을 보여주는데
사용자가 "Plot a chart of META and TESLA sotkc price change YTD."로 "올해 초 대비 주가 변화 그래프를 그려줘" 라는 요청을 하면
Assistant Agent가 "Execute the follwing code.." 관련 python 코드를 생성해서 User Proxy Agent에 전달한다
이때 proxy Agent가 python을 실행할 때 "Error: package yfinance is not installed" yfinacne가 설치되지 않아 오류가 발생한다.
그러면 Assistant Agent가 "Please first pip install yfinance..." 필요한 패키지를 설치하라는 지시를 제공한다. 그러면 Proxy Agent가 "Installing.." 실제로 필요한 패키지를 설치 시작한다.
이 단계는 인간이 Shel 환경에서 명령을 실행해서 LLM이 실시간으로 코칭하는 구조를 보여준다.
그 뒤에 후속으로 Proxy Agent가 달러 기준 주가 변화 그래프인 결과를 출력하면, 사용자가 "No, please plot % change!" 절대금액이 아닌 퍼센트 변화 그래프로 바꿔달라는 수정 요청을 한다, Assistant Agent는 "Got it! Here is the revised code.." 퍼센트 변화에 맞춰 수정된 코드를 생성한다 그리고 Proxy Agent가 y축이 % 단위로 변경된 출력된 그래프를 전달한다
즉, User Proxy Agent는 사용자의 명령을 받아 LLM의 결과를 실제로 실행하는 브릿지 역할이고 , Assistant Agent는 자연어 명령을 파이썬 코드로 변환하고 오류를 안내하거나 코드를 수정하고 있다. Human-in-the-loop 는 사용자와 에이전트가 함께 실시간 문제를 해결하는 구조로, 대화 흐름은 초기 요청 -> 실행 오류 -> 수정 지시 -> 결과 확인 -> 후속 수정까지 이어지는 자연스러운 대화형 코딩 환경이다.
where to Go Next?
여기서 이제 AutoGen을 더 깊이 이해하고 잘 활용하기 위해서 원하는 단계로 이동하면 된다.
- Go through the tutorial to learn more about the core concepts in AutoGen (AugoTen의 핵심 개념(에이전트, 대화 흐름 등) 단계별로 배워보기)
-> 해당 Tutorial 정리는 아래의 포스팅 확인 - Read the examples and guides in the notebooks section (노트북 예제, 가이드 읽기, 실습용 Jupyter Notebook 예제들을 보고 다양한 시나리오에서 에이전트가 어떻게 작동하는지 직접 실행해보기)
- Understand the use cases for multi-agent conversation and enhanced LLM inference (멀티 에이전트 대화와 고급 LLM 활용법 이해하기)
- Read the API docs (API 문서 읽기)
- Learn about research around AutoGen (AutoGen 관련 연구 보기)
- Follow on Twitter (트위터 팔로우하기) ?
- See our roadmaps (로드맵 확인)
다음은 Tutorial 섹션의 Chat Termination을 살펴보도록 하겠다.