단계 1 : Prometheus 설치
- prometheus.yaml 파일을 작성한다.
apiVersion: v1
kind: Namespace
metadata:
  name: monitoring
---
apiVersion: apps/v1
kind: Deployment
metadata:
  name: prometheus
  namespace: monitoring
spec:
  replicas: 1
  selector:
    matchLabels:
      app: prometheus
  template:
    metadata:
      labels:
        app: prometheus
    spec:
      containers:
        - name: prometheus
          image: prom/prometheus:v2.33.1
          args:
            - "--config.file=/etc/prometheus/prometheus.yml"
            - "--storage.tsdb.path=/prometheus"
          ports:
            - containerPort: 9090
          volumeMounts:
            - name: config-volume
              mountPath: /etc/prometheus/
            - name: data
              mountPath: /prometheus
      volumes:
        - name: config-volume
          configMap:
            name: prometheus-config
        - name: data
          emptyDir: {}
---
apiVersion: v1
kind: Service
metadata:
  name: prometheus
  namespace: monitoring
spec:
  selector:
    app: prometheus
  ports:
    - port: 9090
      targetPort: 9090
  type: NodePort
- prometheus-config.yaml 파일을 작성한다.
apiVersion: v1
kind: ConfigMap
metadata:
  name: prometheus-config
  namespace: monitoring
data:
  prometheus.yml: |
    global:
      scrape_interval: 15s
    scrape_configs:
      - job_name: 'kubernetes-apiservers'
        kubernetes_sd_configs:
          - role: endpoints
        relabel_configs:
          - source_labels: [__meta_kubernetes_namespace, __meta_kubernetes_service_name, __meta_kubernetes_endpoint_port_name]
            action: keep
            regex: default;kubernetes;https
      - job_name: 'kubernetes-nodes'
        kubernetes_sd_configs:
          - role: node
        relabel_configs:
          - action: labelmap
            regex: __meta_kubernetes_node_label_(.+)
          - target_label: __address__
            replacement: kubernetes.default.svc:443
            action: replace
            regex: (.+)
          - source_labels: [__address__]
            action: replace
            target_label: __address__
            regex: (.+):443
            replacement: $1:10250
      - job_name: 'kubernetes-pods'
        kubernetes_sd_configs:
          - role: pod
        relabel_configs:
          - action: labelmap
            regex: __meta_kubernetes_pod_label_(.+)
          - source_labels: [__meta_kubernetes_pod_annotation_prometheus_io_scrape]
            action: keep
            regex: true
          - source_labels: [__meta_kubernetes_pod_annotation_prometheus_io_path]
            action: replace
            target_label: __metrics_path__
            regex: (.+)
          - source_labels: [__address__, __meta_kubernetes_pod_annotation_prometheus_io_port]
            action: replace
            target_label: __address__
            regex: ([^:]+)(?::\d+)?;(\d+)
            replacement: $1:$2
          - source_labels: [__meta_kubernetes_namespace]
            action: replace
            target_label: kubernetes_namespace
          - source_labels: [__meta_kubernetes_pod_name]
            action: replace
            target_label: kubernetes_pod_name
      - job_name: 'kubernetes-cadvisor'
        kubernetes_sd_configs:
          - role: node
        relabel_configs:
          - action: labelmap
            regex: __meta_kubernetes_node_label_(.+)
          - target_label: __address__
            replacement: kubernetes.default.svc:443
            action: replace
            regex: (.+)
          - source_labels: [__address__]
            action: replace
            target_label: __address__
            regex: (.+):443
            replacement: $1:4194
      - job_name: 'kubernetes-service-endpoints'
        kubernetes_sd_configs:
          - role: endpoints
        relabel_configs:
          - source_labels: [__meta_kubernetes_service_annotation_prometheus_io_scrape]
            action: keep
            regex: true
          - source_labels: [__meta_kubernetes_service_annotation_prometheus_io_path]
            action: replace
            target_label: __metrics_path__
            regex: (.+)
          - source_labels: [__address__, __meta_kubernetes_service_annotation_prometheus_io_port]
            action: replace
            target_label: __address__
            regex: ([^:]+)(?::\d+)?;(\d+)
            replacement: $1:$2
단계 2 : 리소스 배포
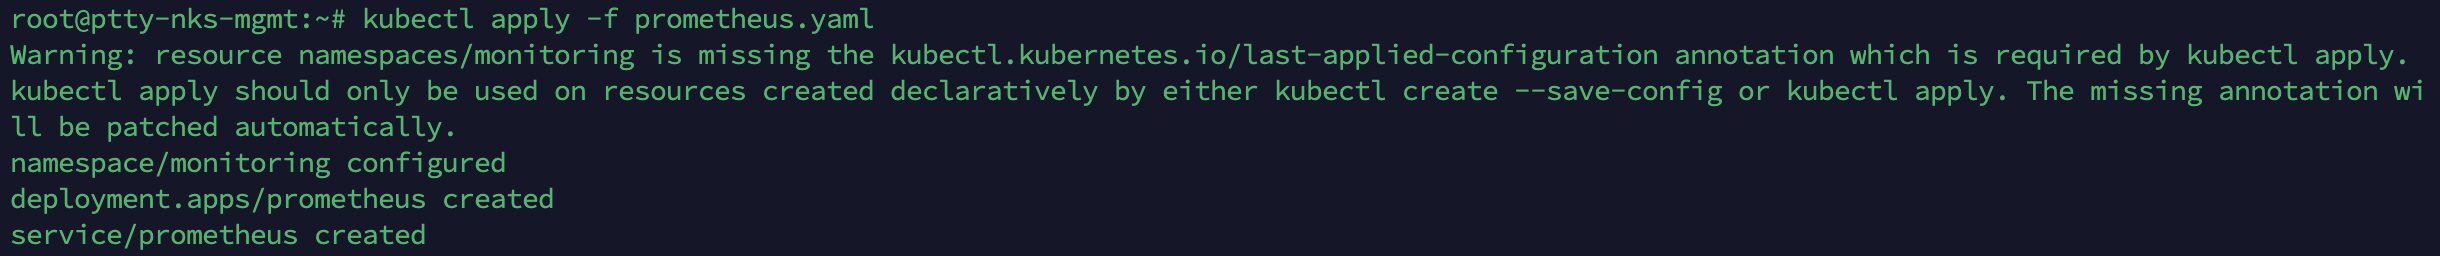
- Prometheus와 관련된 ConfigMap과 서비스를 배포한다.
kubectl apply -f prometheus-config.yaml

kubectl apply -f prometheus.yaml
단계 3 : Prometheus UI에 접근
Prometheus를 NodePort 타입의 서비스로 배포했기 때문에, 클러스터 내에서 Prometheus UI에 접근할 수 있다.
- kubectl 명령어를 사용하여 Prometheus 서비스의 노드 포트를 확인한다.
kubectl get service -n monitoring prometheus

- 반환된 포트 번호를 확인한 후, 브라우저에서 http://<클러스터 노드 IP>:를 열어 Prometheus UI에 접속한다.
http://223.130.136.251:30260
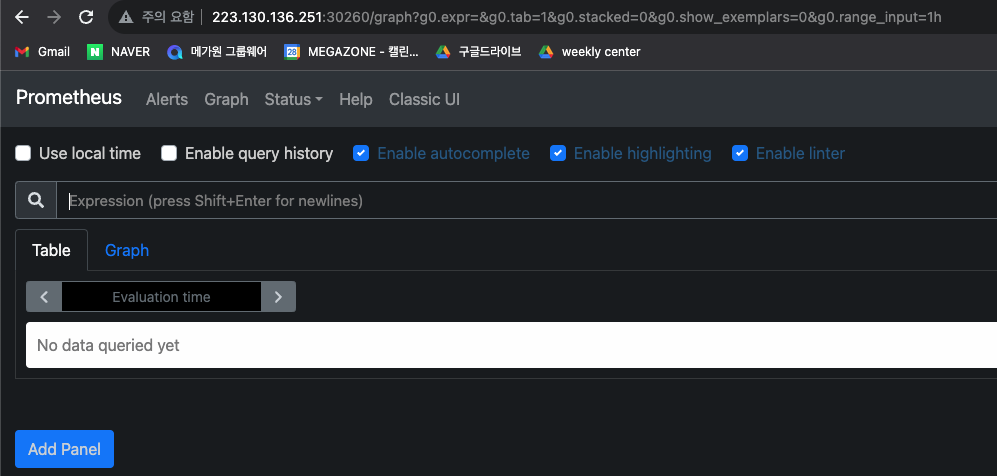
단계 4 : 쿼리 및 모니터링
Prometheus UI에서 쿼리를 작성하고 클러스터의 메트릭을 확인하며, HPA의 동작과 클러스터의 성능을 모니터링할 수 있다.
PromQL (프로메테우스 쿼리 언어) 를 이용하여 모니터링 작업
-
기본 메트릭과 타겟
- 모든 사용 가능한 메트릭을 확인하려면 쿼리 입력 상자에 'up'을 입력하고 '실행'을 클릭한다. 그러면 클러스터 내 모든 타겟의 상태가 표시된다.
하지만 내가 잘못한 부분이 있다.
namespace : default로 설정해줘야하는데
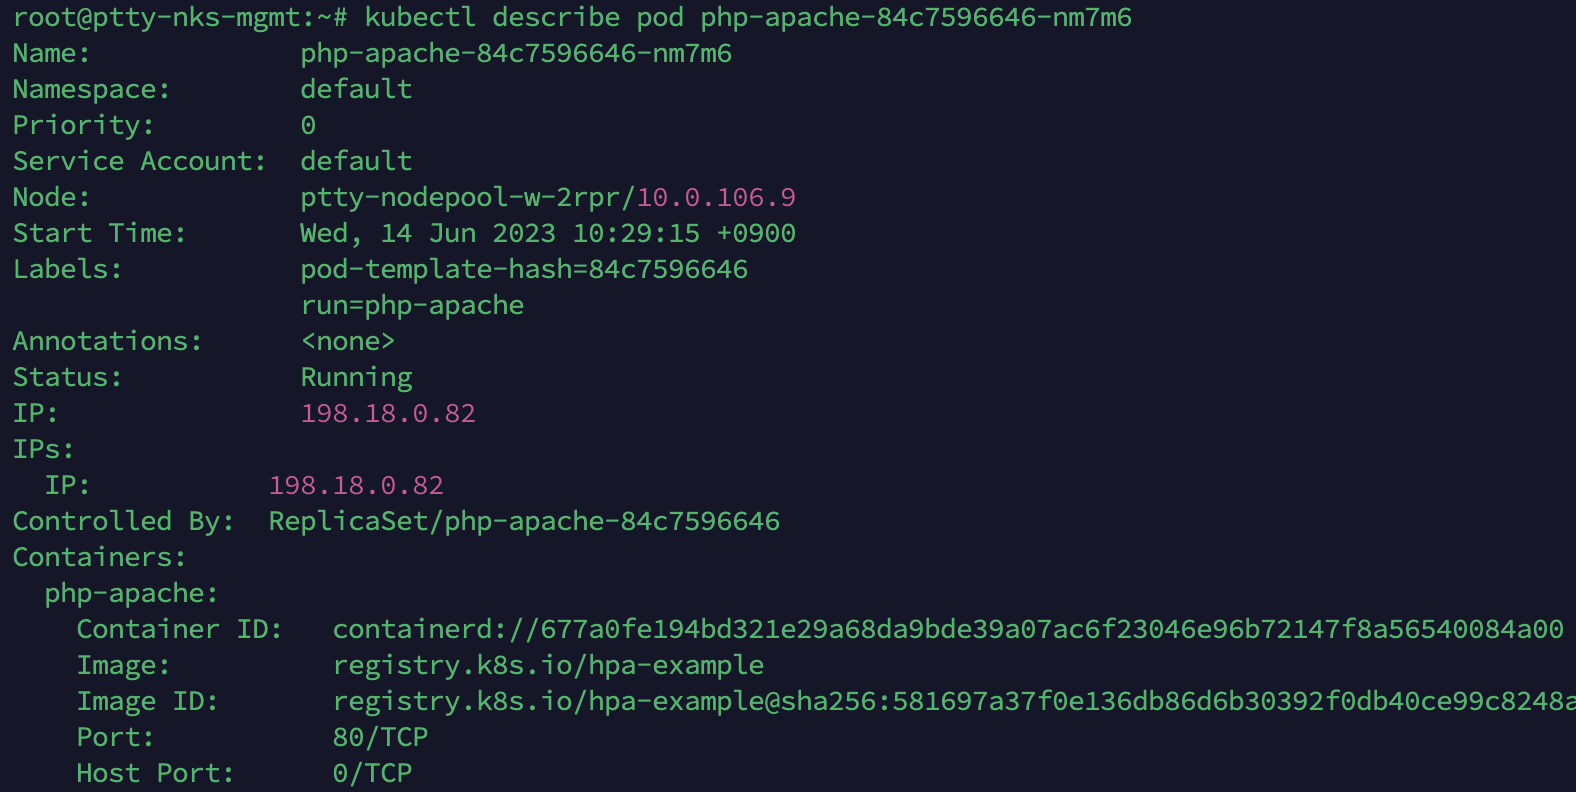
monitoring 을 설정해줘서 내가 보고 싶은 Pod 리소스들을 볼 수 없었다.
다시 수정해주도록 한다.
-
우선 삭제해주자.
kubectl delete deployment prometheus -n monitoring
kubectl delete service prometheus -n monitoring
kubectl delete configmap prometheus-config -n monitoring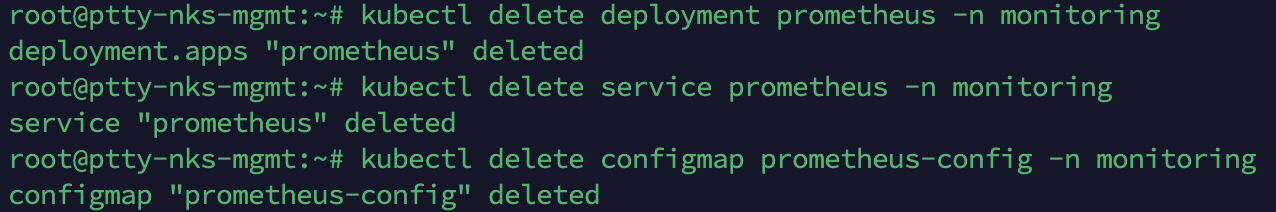
- namespace : default 로 수정해준다.
- 이후 설정을 적용한다.
kubectl apply -f prometheus-config.yaml -n default
kubectl apply -f prometheus.yaml -n default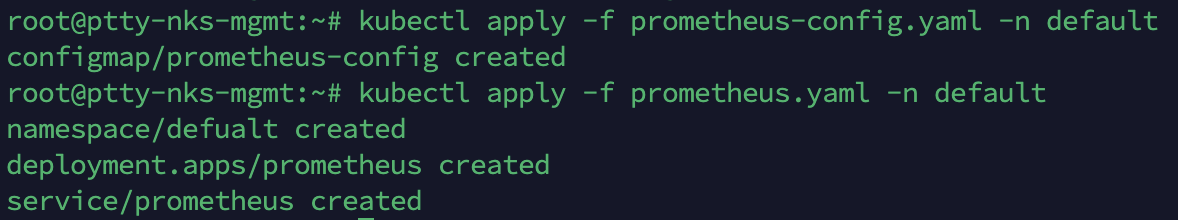
- 이 후 잘 안되어서 로그를 확인하였다.
kubectl logs -l app=prometheus -n default 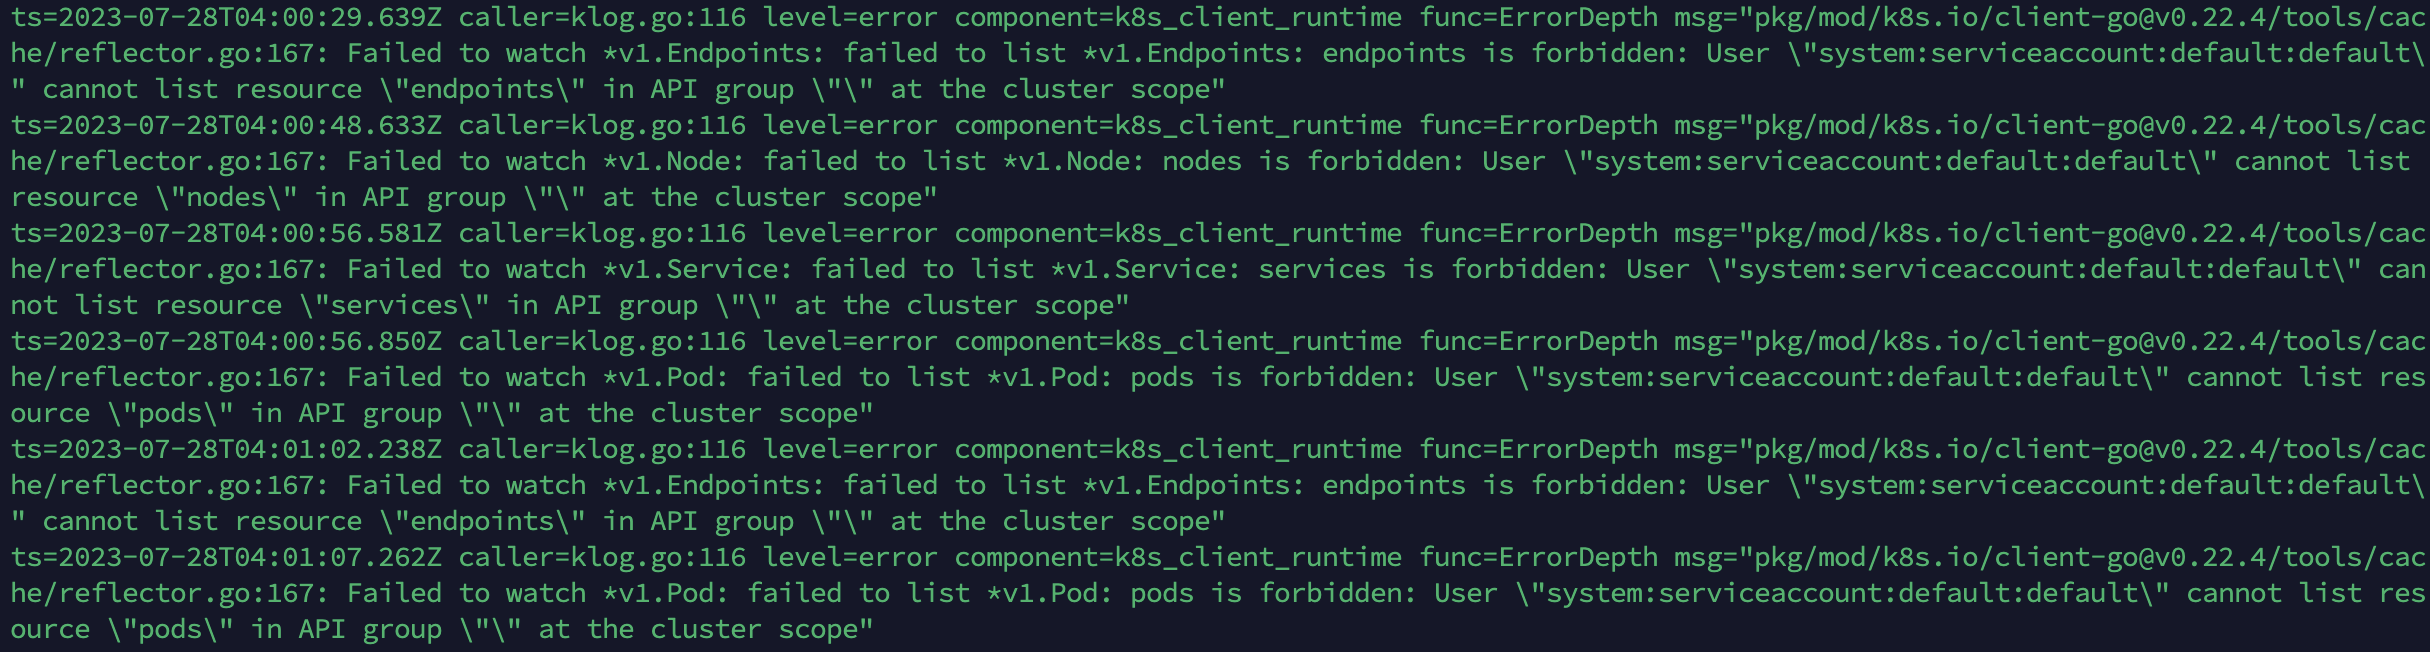
로그를 통해 발견된 에러 메시지는 프로메테우스가 클러스터 리소스에 대한 액세스 권한이 없어서 발생하는 것으로 보인다. 이는 프로메테우스 Pod가 기본적으로 "default" 네임스페이스의 "default" 서비스 계정으로 실행되기 때문에 발생하는 문제이다.
이 문제를 해결하기 위해 다음과 같이 특정 서비스 계정과 RBAC(Role-Based Access Control) 권한을 프로메테우스에 할당하면 된다.
서비스 계정 연결
- 서비스 계정 생성
"default" 네임스페이스에 새로운 서비스 계정을 생성한다. 프로메테우스가 이 서비스 계정을 사용하여 클러스터 리소스에 액세스할 수 있다.

- RBAC 권한 할당
새로운 서비스 계정에 필요한 RBAC 권한을 부여한다. "default" 네임스페이스에 적용될 ClusterRole과 ClusterRoleBinding을 생성한다.
# prometheus-cluster-role.yaml
apiVersion: rbac.authorization.k8s.io/v1
kind: ClusterRole
metadata:
  name: prometheus-cluster-role
rules:
  - apiGroups: [""]
    resources: ["nodes", "endpoints", "services", "pods"]
    verbs: ["get", "list", "watch"]
# prometheus-cluster-role-binding.yaml
apiVersion: rbac.authorization.k8s.io/v1
kind: ClusterRoleBinding
metadata:
name: prometheus-cluster-role-binding
subjects:
- kind: ServiceAccount
name: prometheus-serviceaccount
namespace: default
roleRef:
kind: ClusterRole
name: prometheus-cluster-role
apiGroup: rbac.authorization.k8s.io
- 생성한 yaml 파일 적용한다.
kubectl apply -f prometheus-cluster-role.yaml
kubectl apply -f prometheus-cluster-role-binding.yaml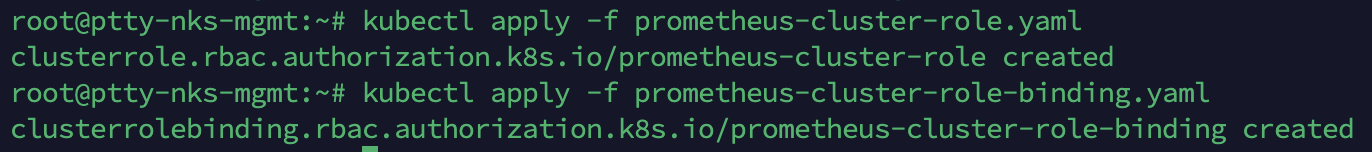
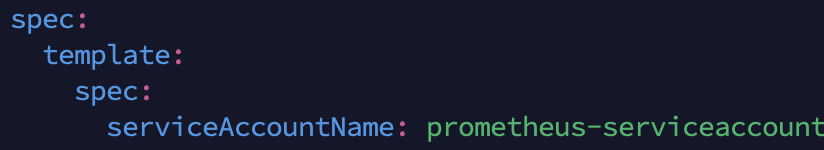
- 새로운 서비스 계정 사용 설정
프로메테우스 Pod가 위에서 생성한 서비스 계정을 사용하도록 설정한다. 이를 위해 프로메테우스 배포 설정(prometheus.yaml)에 다음과 같이 설정한다.
apiVersion: apps/v1
kind: Deployment
metadata:
  name: prometheus
  namespace: default
spec:
  replicas: 1
  selector:
    matchLabels:
      app: prometheus
  template:
    metadata:
      labels:
        app: prometheus
    spec:
      serviceAccountName: prometheus-serviceaccount
      containers:
        - name: prometheus
          image: prom/prometheus:v2.33.1
          args:
            - "--config.file=/etc/prometheus/prometheus.yml"
            - "--storage.tsdb.path=/prometheus/"
          ports:
            - containerPort: 9090
          volumeMounts:
            - name: config-volume
              mountPath: /etc/prometheus/
            - name: data
              mountPath: /prometheus
      volumes:
        - name: config-volume
          configMap:
            name: prometheus-config
        - name: data
          emptyDir: {}
prometheus.yaml 파일이다.

up 쿼리를 다시 실행하여 올바른 결과를 얻을 수 있었다.
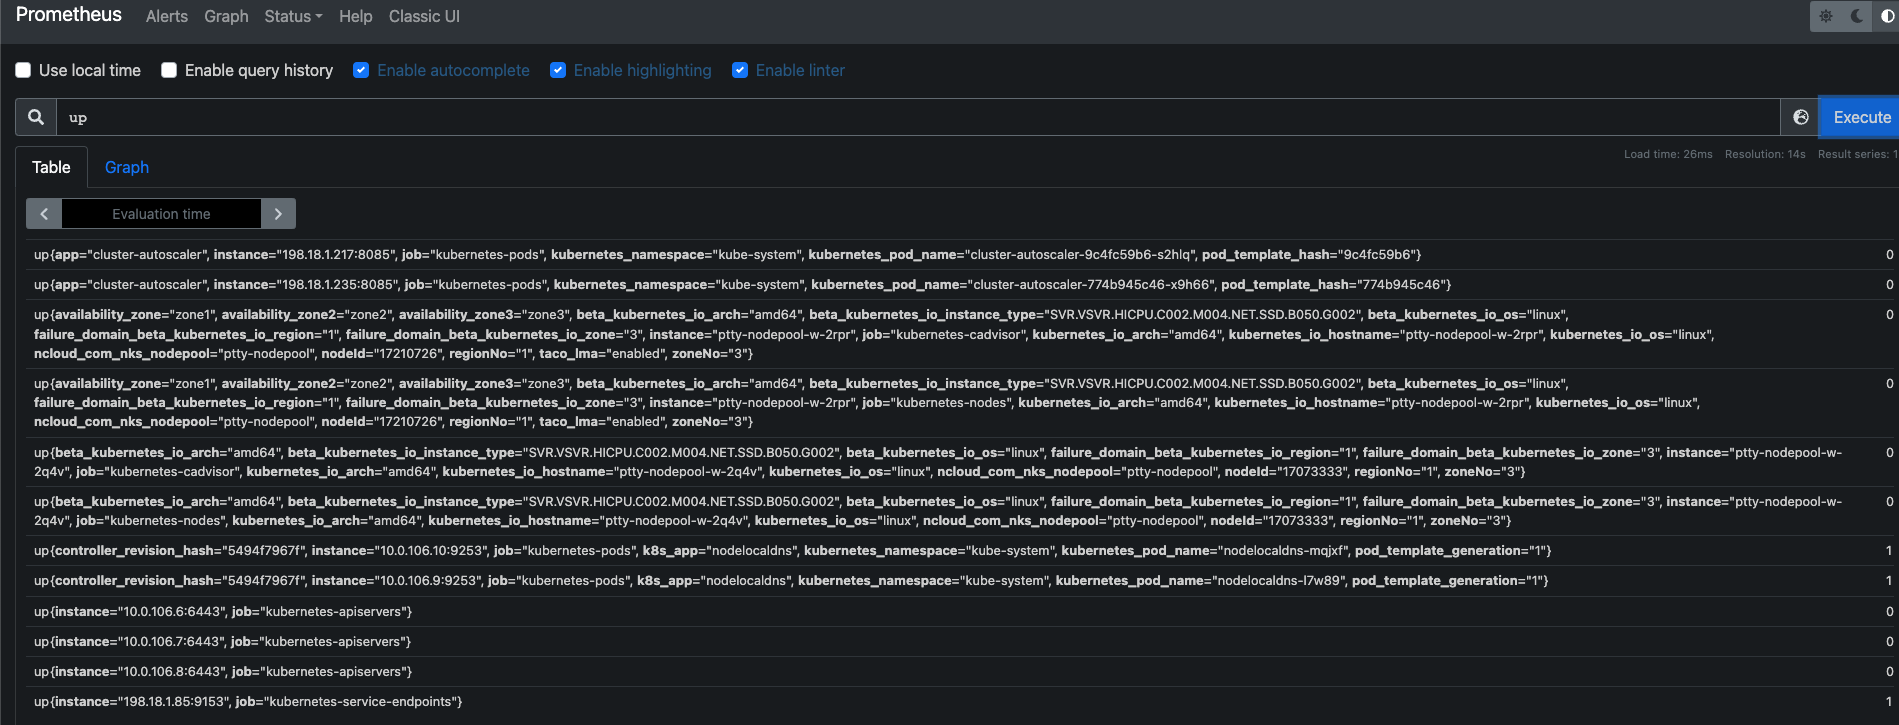
이제 본격적으로 4단계를 해보았는데, 시각화가 되지 않고 시계열 데이터로 나열되니 한 눈에 안보였다.
시계열 데이터를 시각화하고 대시보드에 효과적으로 표시하기 위해서는 Grafana에서 적절한 그래프 패널을 설정해야 한다.
Grafana 를 활용한 시각화
- Grafana 설치 진행
- 패키지 소스에 Grafana 저장소 추가
sudo apt-get install -y software-properties-common
sudo add-apt-repository "deb https://packages.grafana.com/oss/deb stable main"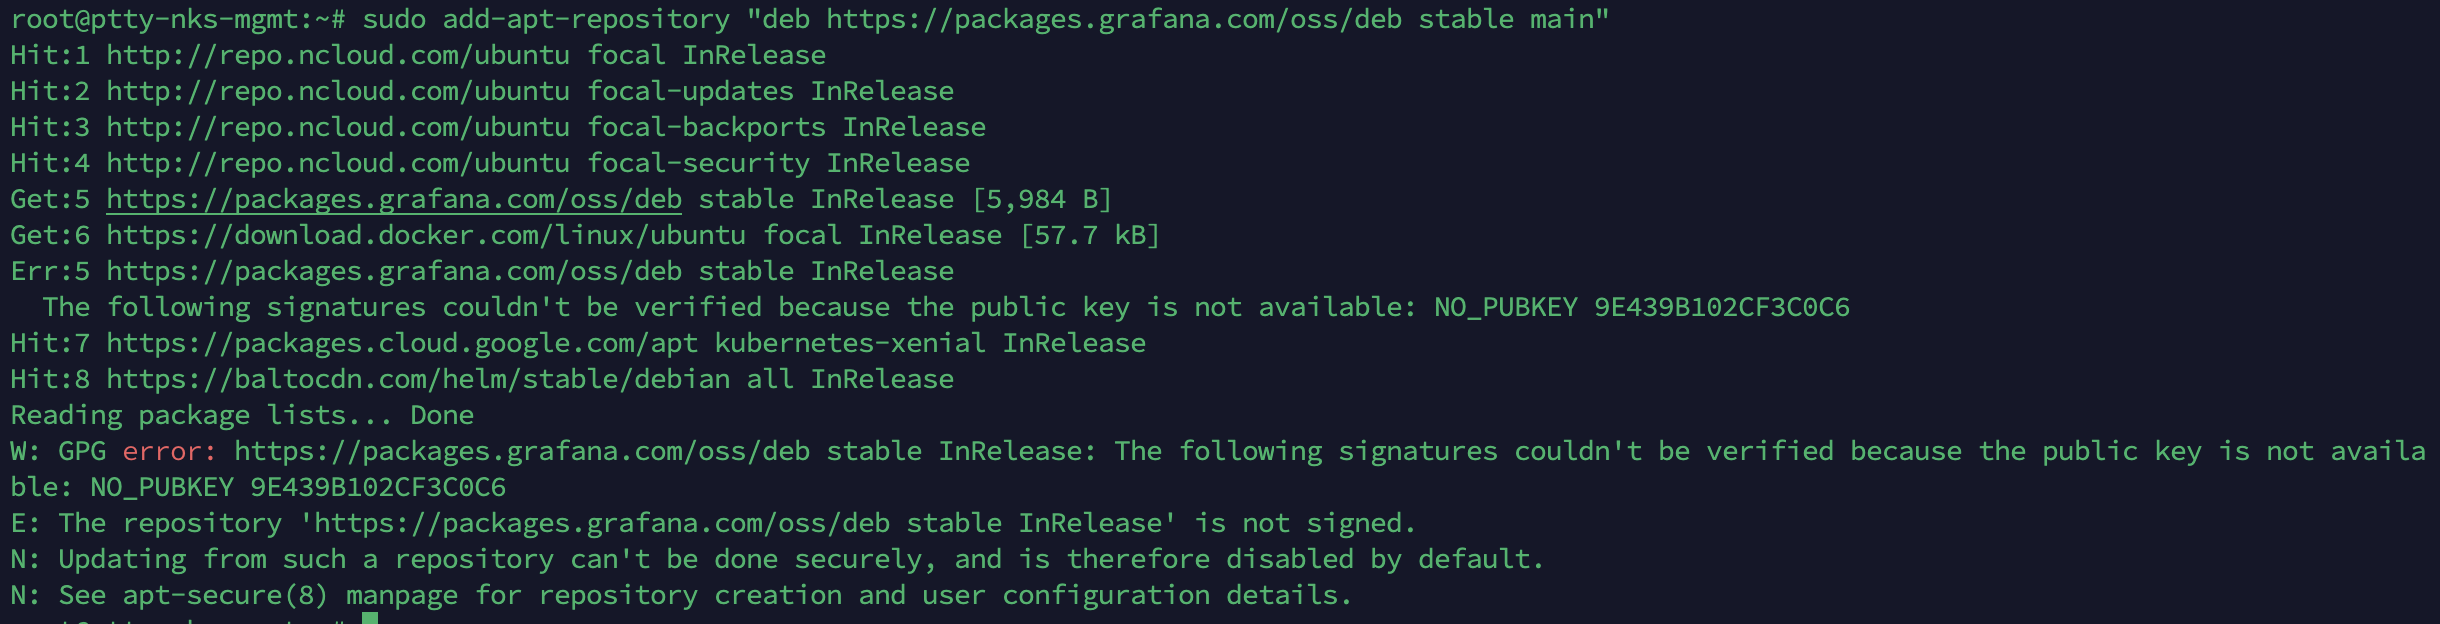
위의 출력에서 보듯이 Grafana 저장소의 GPG 키가 인증되지 않았기 때문에 저장소 추가 과정에서 오류가 발생한다. 이 문제를 해결하기 위해 저장소의 GPG 키를 추가해야 한다.
- Grafana 패키지를 서명하는 데 사용되는 GPG 키를 가져옵니다:
wget -q -O - https://packages.grafana.com/gpg.key | sudo apt-key add -
- 패키지 목록을 다시 업데이트
sudo apt-get update- Grafana 설치
sudo apt-get install -y grafana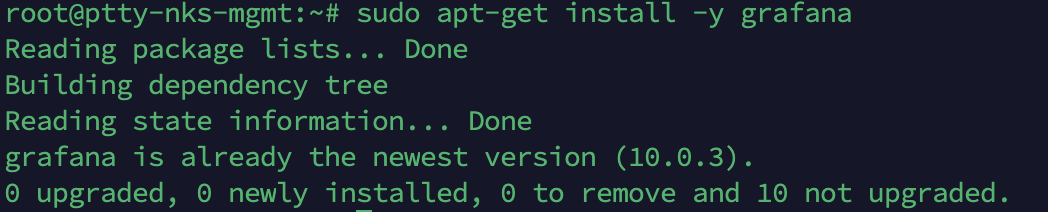
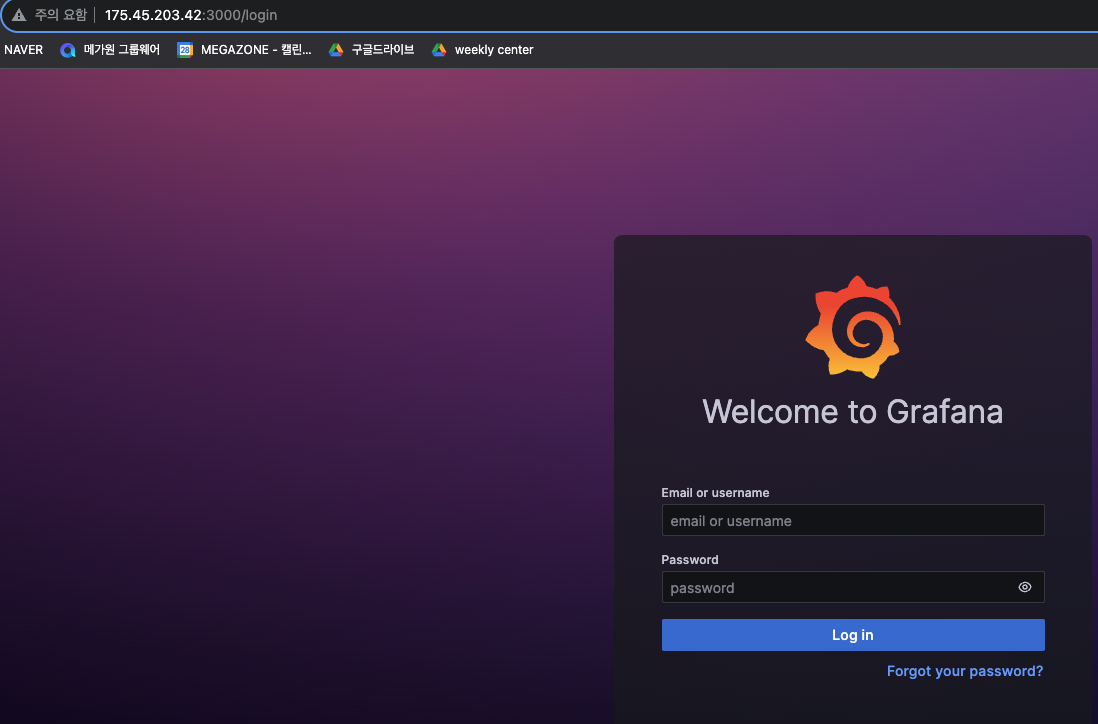
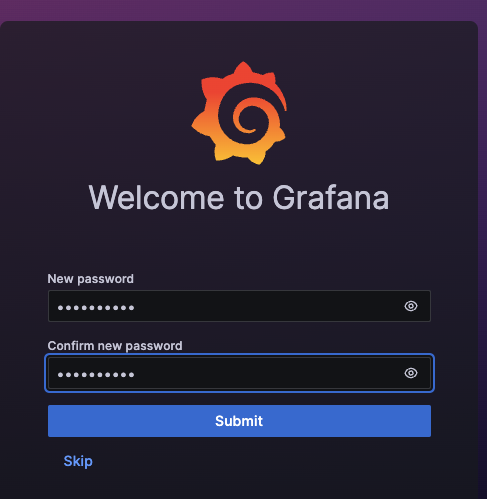
초기 로그인 : admin 이다. 아이디 비번 모두
- 접속 후 이제 Prometheus 를 Grafana 에 연결해주자.
프로메테우스를 Grafana와 연결하여 데이터를 시각화해보자.
-
Grafana에 데이터 소스 추가
- "Configuration(설정)" 아래의 "Data Sources(데이터 소스)"를 선택합니다.
"Add data source(데이터 소스 추가)"를 클릭합니다.
데이터 소스를 추가하는 페이지에서 "Prometheus"를 선택합니다.
- "Configuration(설정)" 아래의 "Data Sources(데이터 소스)"를 선택합니다.
-
Prometheus 데이터 소스 설정
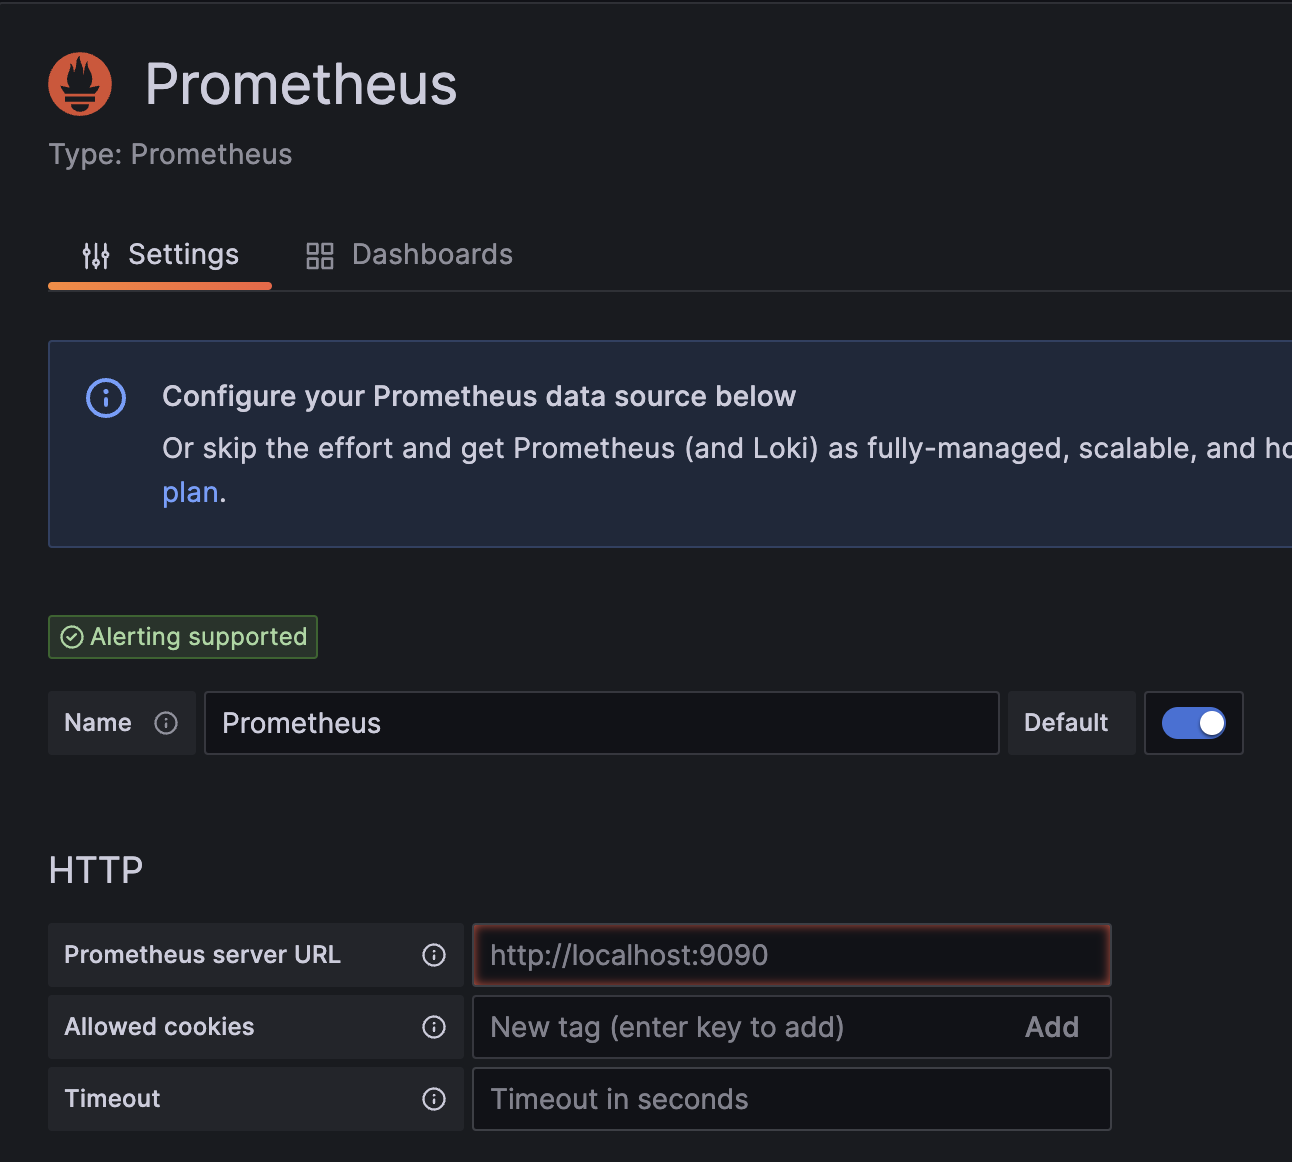
-
"HTTP" 섹션에서 "URL"에 Prometheus 서버의 URL을 입력한다.
예를 들어, http://localhost:9090 이나 해당 Prometheus 서버의 IP 및 포트를 입력합니다.
설정이 완료되었다면, "Save & Test(저장 및 테스트)" 버튼을 클릭하여 데이터 소스를 저장하고 테스트한다. 연결이 성공적으로 되었다면 "Data source is working(데이터 소스가 작동 중입니다)"라는 메시지가 표시된다.
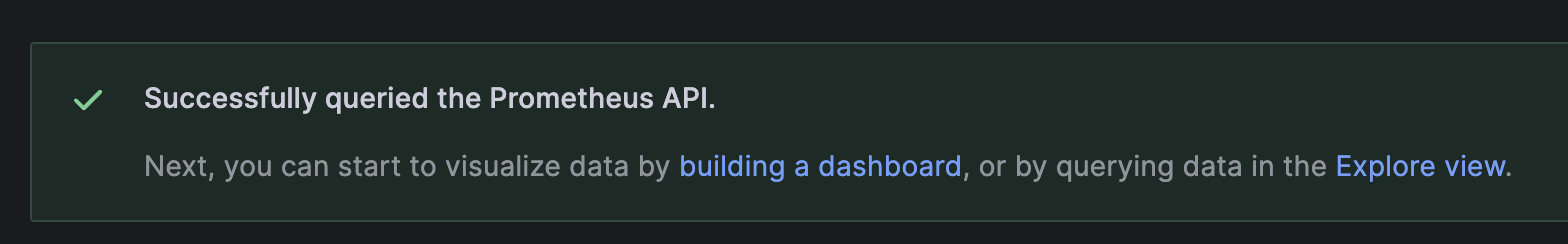
프로메테우스 API를 성공적으로 조회했다.
-
대시보드 생성
좌측 메뉴에서 "Create(생성)"를 선택하고 "Dashboard(대시보드)"를 클릭한다.
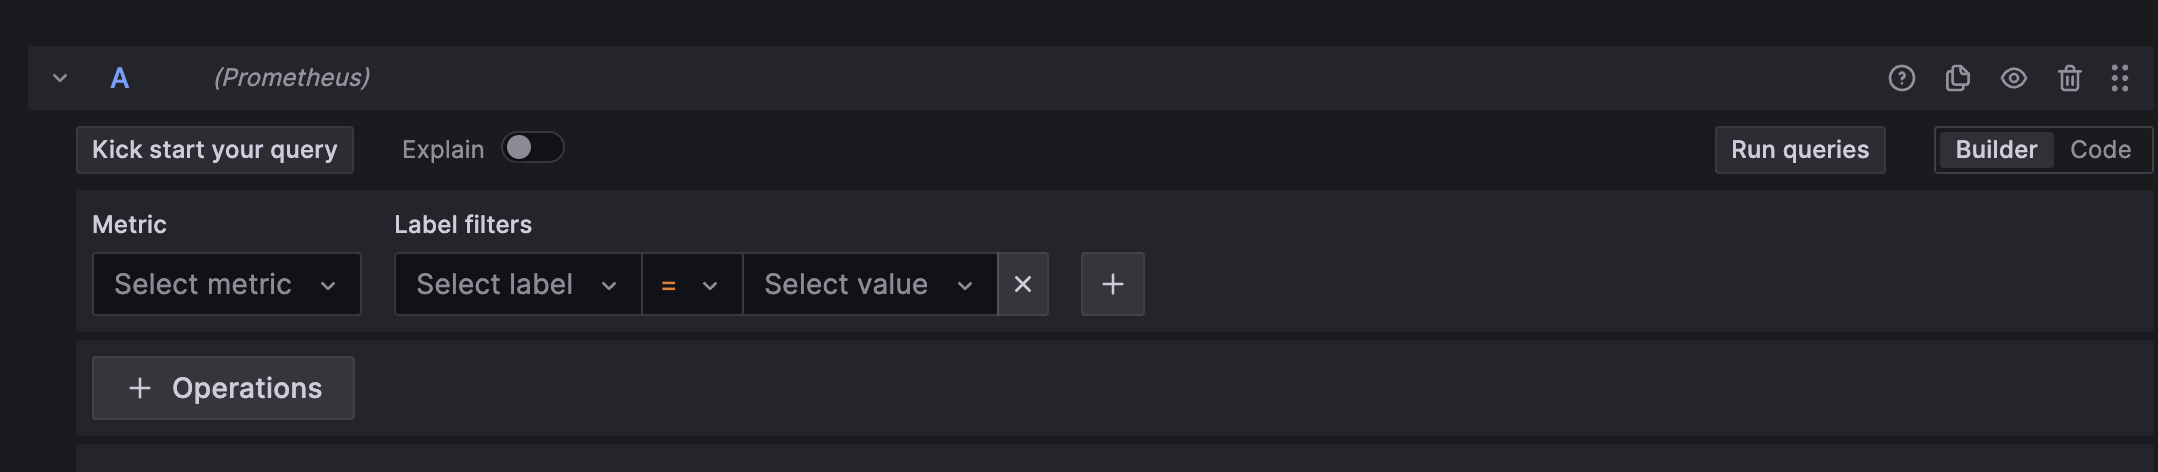
"Add new panel(새로운 패널 추가)"을 클릭하여 그래프 패널을 추가한다.
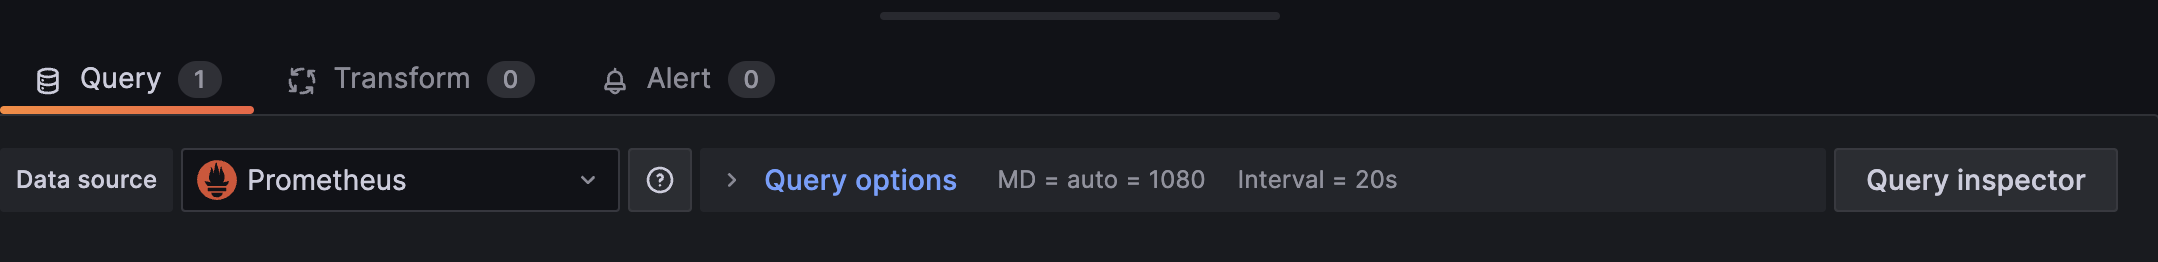
"Query(쿼리)" 탭에서 "Prometheus" 데이터 소스를 선택한다.
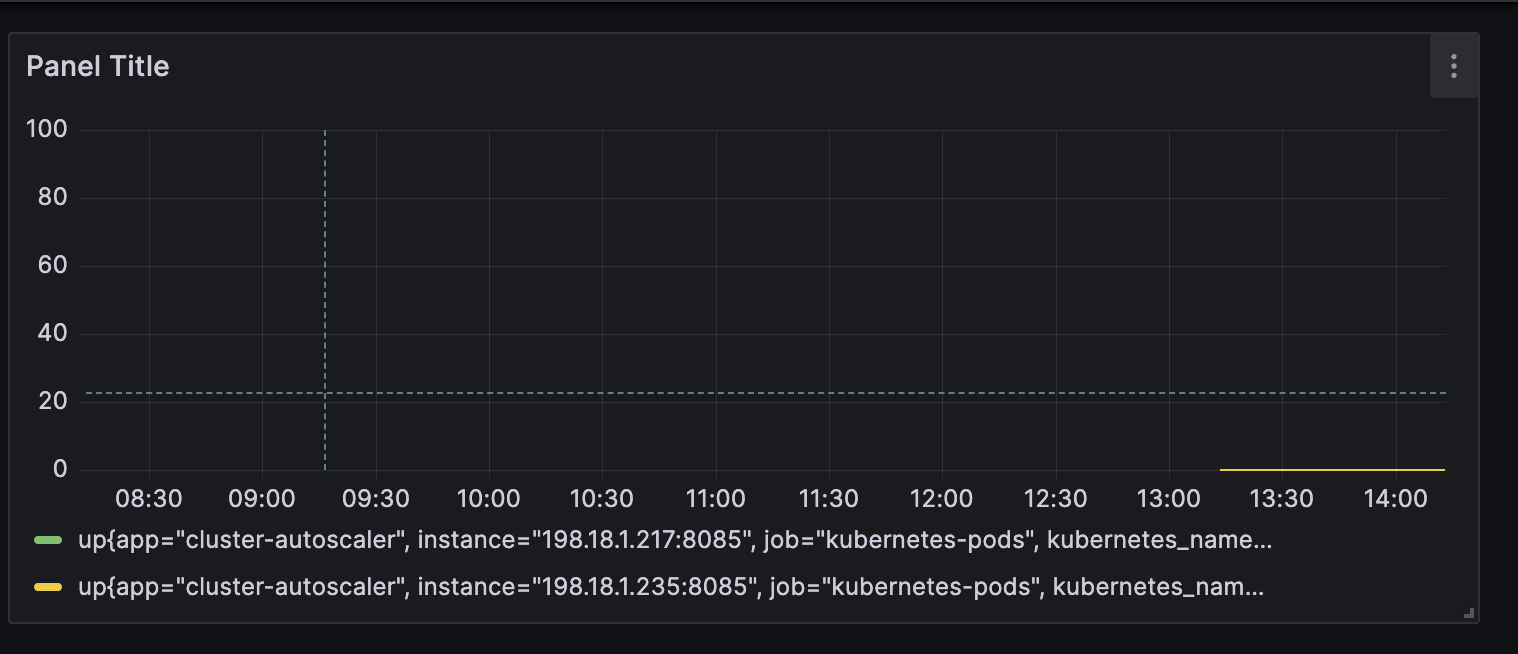
원하는 쿼리를 작성하여 시계열 데이터를 가져와 그래프로 시각화한다.
-
시각화 설정
그래프 패널을 선택한 후 "Edit(편집)"을 클릭하여 시각화 옵션을 설정한다. 시간 범위, 그래프 유형, 라인 색상 등을 조정하여 데이터를 원하는 대로 시각화한다.
되돌아보며
HPA는 쿠버네티스의 기능으로 파드를 자동으로 스케일링하는 역할을 합니다. 프로메테우스는 쿠버네티스 클러스터 및 애플리케이션의 메트릭 데이터를 수집하고 분석하는데 사용되며, Grafana는 Prometheus로부터 수집된 데이터를 시각화하여 대시보드를 만들고 모니터링하는데 사용된다. 이들은 함께 사용하여 쿠버네티스 클러스터의 상태와 애플리케이션의 성능을 모니터링하고, 필요에 따라 자동으로 스케일링하고 경고를 설정하여 시스템을 관리하는데 유용하게 활용될 수 있다.