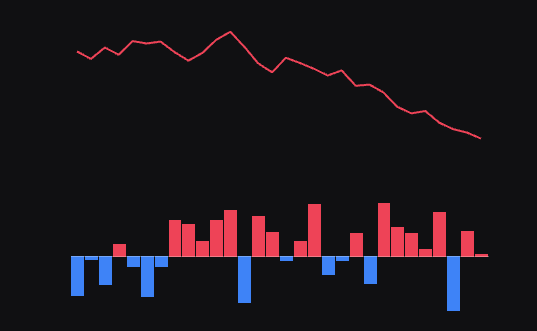
☝️플젝 중 만들어낸 그래프. 좀 이쁜 듯?
개요
- TradingView 에서 만든 경량, 고성능 차트 라이브러리
- 주식과 같은 그래프 구현시 용이하게 쓸 수 있다.
공식 문서 링크
설치
npm install lightweight-charts사용
아래 2가지 개념만 있으면 누구나 사용할 수 있을 정도로 간펀하면서 쉽다.
- createChart -> 차트 배경 생성
- .addLineSeries -> 그래프 생성
import { useEffect, useRef } from 'react';
import { createChart } from 'lightweight-charts';


const MyChart = () => {
  //차트배경을 가리키는 Ref
  const chartContainerRef = useRef<HTMLDivElement>(null);


  useEffect(() => {
    if (!chartContainerRef.current) return; //요소 생선 전 차트 생성 방지

    // createChart(container, options) → 차트 배경 생성 (지정 DOM 요소)
    const chart = createChart(chartContainerRef.current, {
      width: chartContainerRef.current.clientWidth,
      height: 300,
    });


    // 그래프 추가
    //Candles, Line, Bars, Area, BaseLine, Histogram
    //addLineSeries(그래프 형태, 옵션설정)
    const graph = chart.addSeries(Line);

    // 데이터 넣기
    graph.setData([
      { time: '2025-01-01', value: 100 },
      { time: '2025-01-02', value: 110 },
      { time: '2025-01-03', value: 105 },
      { time: '2025-01-04', value: 120 },
    ]);

    // 리사이즈 대응
    const handleResize = () => {
      chart.applyOptions({ width: chartContainerRef.current!.clientWidth });
    };
    window.addEventListener('resize', handleResize);

    // 컴포넌트 언마운트시 메모리 관리를 위한 remove
    return () => {
      window.removeEventListener('resize', handleResize);
      chart.remove();
    };
  }, []);

  return (
    <div ref={chartContainerRef} style={{ width: '100%', height: '300px' }} />
  );
};

export default MyChart;
옵션
커스텀할 수 있는 부분이 많은 만큼, 옵션 또한 엄청 많다.
차트 배경 옵션(createChart)
- width, height(차트 크기)
- layout (배경/글자 색상, 폰트)
- grid (세로/가로 라인 색상 및 스타일)
- crosshair (마우스 올렸을 때 보이는 십자선 모드)
- rightPriceScale / leftPriceScale (가격축 보이기 여부, 색상)
- timeScale (시간축 옵션)
- handleScroll / handleScale (마우스/터치 스크롤, 줌 허용 여부)
const chart = createChart(container, {
  width: 800, //width, height(차트 크기)
  height: 400,
  layout: { //배경/글자 색상, 폰트
    background: { color: '#ffffff' },
    textColor: '#333',
    fontSize: 12,
  },
  grid: { //세로/가로 라인 색상 및 스타일
    vertLines: { color: '#e1e1e1', style: 0 },
    horzLines: { color: '#e1e1e1', style: 0 },
  },
  crosshair: { //crosshair (마우스 올렸을 때 보이는 십자선 모드)
    mode: 1,
  },
  rightPriceScale: { // or leftPriceScale 가격축 보이기 여부, 색상
    visible: true,
    borderColor: '#ccc',
  },
  timeScale: { //시간축 옵션
    borderColor: '#ccc',
    timeVisible: true,
    secondsVisible: false,
  },
  handleScroll: { //마우스/터치 스크롤
    mouseWheel: true,
    pressedMouseMove: true,
  },
  handleScale: { //줌 허용 여부
    axisPressedMouseMove: true,
    pinch: true,
    mouseWheel: true,
  },
});
그래프 옵션(addSeries)
Candlestick Series
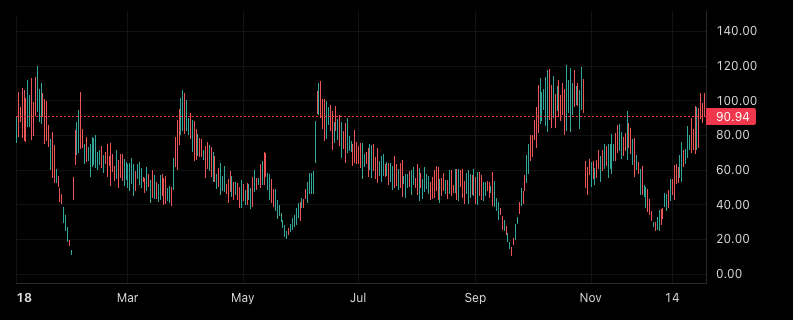
const candleSeries = chart.addSeries(CandlestickSeries, {
  upColor: '#26a69a',
  downColor: '#ef5350',
  borderUpColor: '#26a69a',
  borderDownColor: '#ef5350',
  wickUpColor: '#26a69a',
  wickDownColor: '#ef5350',
  priceLineVisible: true,
});- upColor / downColor: 양봉/음봉 몸통 내부 색
- borderUpColor / borderDownColor: 몸통의 테두리 색
- wickUpColor / wickDownColor: 위·아래 심지(꼬리)의 색
- priceLineVisible: 현재가 라인(수평선)을 표시할지 여부
Line Series
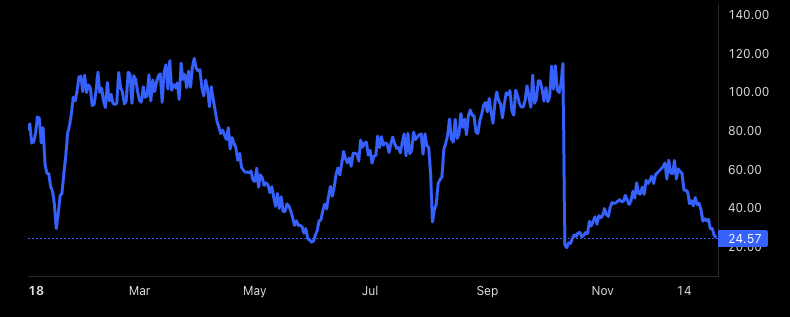
const lineSeries = chart.addSeries(LineSeries, {
  color: '#2962FF',
  lineWidth: 2,
  lineStyle: 0, // 0: solid, 1: dotted, 2: dashed
  priceLineVisible: true,
  crossHairMarkerVisible: true,
});- color: 선의 색상
- lineWidth: 선의 두께
- lineStyle: 선의 스타일 (실선, 점선 등)
- crosshairMarkerVisible: 크로스헤어가 있을 때 지점 마커를 보일지 여부
- priceLineVisible: 현재가 라인 보이기 여부
Histogram Series
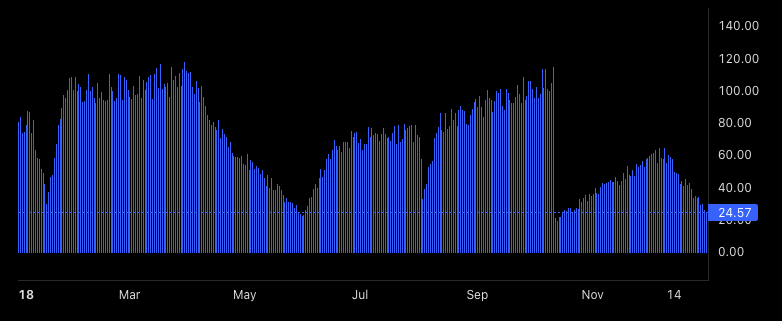
const volumeSeries = chart.addSeries(HistogramSeries, {
  color: '#26a69a',
  base: 0,
  priceFormat: { type: 'volume' },
});- color: 막대의 기본 색
- base: 기준선 값 (보통 0)
- priceFormat: 값의 표시 방식 (예: volume, percent 등)
Area Series
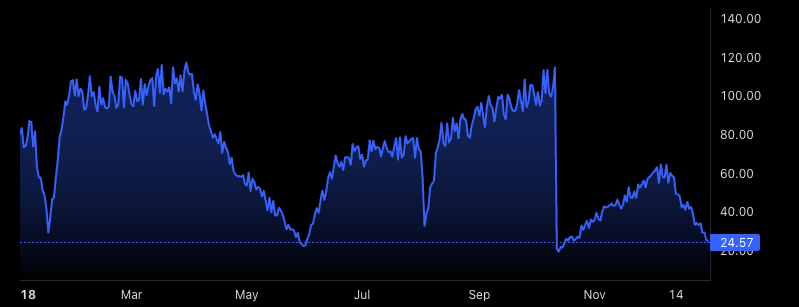
const areaSeries = chart.addSeries(AreaSeries, {
  lineColor: '#2962FF',
  topColor: 'rgba(41, 98, 255, 0.5)',
  bottomColor: 'rgba(41, 98, 255, 0.0)',
  lineWidth: 2,
});- lineColor: 영역 상단 경계선 색
- topColor: 라인 위쪽 영역 색
- bottomColor: 라인 아래쪽 영역 색
- lineWidth: 경계선의 두께
Bar Series
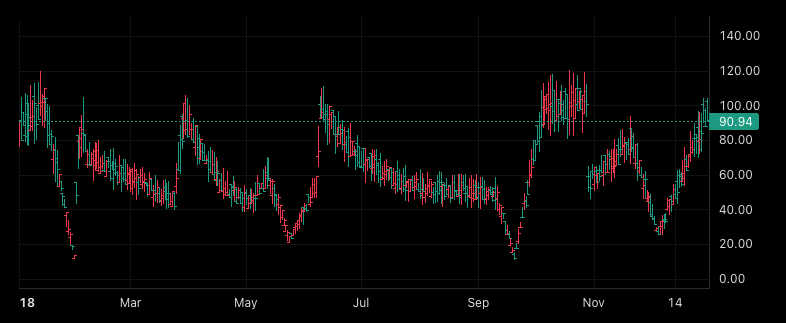
const bar = chart.addSeries(BarSeries, {
  upColor: '#26a69a',
  downColor: '#ef5350',
  thinBars: false,
});- upColor / downColor: 가격 상승/하락 시 막대 색
- thinBars: 얇은 막대 스타일 여부
Baseline Serise
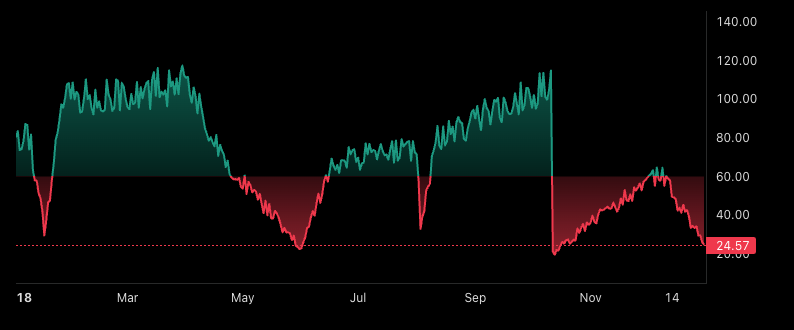
const baseline = chart.addSeries(BaselineSeries, {
  baseValue: 100,
  topFillColor1: 'rgba(0, 200, 0, 0.3)',
  topFillColor2: 'rgba(0, 200, 0, 0.0)',
  bottomFillColor1: 'rgba(200, 0, 0, 0.3)',
  bottomFillColor2: 'rgba(200, 0, 0, 0.0)',
  topLineColor: 'green',
  bottomLineColor: 'red',
  lineWidth: 2,
  lineStyle: 0,
  lineVisible: true,
  crosshairMarkerVisible: true,
});- baseValue: 기준선 값
- topFillColor1 / topFillColor2: 기준선 위쪽 영역 그라디언트 색상
- bottomFillColor1 / bottomFillColor2: 기준선 아래쪽 영역 그라디언트 색상
- topLineColor / bottomLineColor: 기준선 위/아래 경계선 색상
- lineWidth: 기준선 경계선 두께
- lineStyle: 기준선 스타일 (solid, dashed 등)
- lineVisible: 기준선 경계선을 보일지 여부
- crosshairMarkerVisible: 크로스헤어가 지점 마커를 표시할지 여부

Day One