Advances in Financial Machine Learning 1st Edition
by Lopez de Prado, Marcos (Author)
2년 동안 금융논문을 보면서
논문에서 나온 그대로 replicate 해봤다.
근데 역시나 실전에서 돈되는 것은 하나도 없었다.
단,
하.나.도.
그런데 이 책은 그런 알고의 문제점을 정확히 짚어준다.
책 읽기가 귀찮으면
저자 강연을 한번 들어봐라
분명,
지금 나 처럼 충격을 받을 것 이다.
https://www.youtube.com/watch?v=BRUlSm4gdQ4
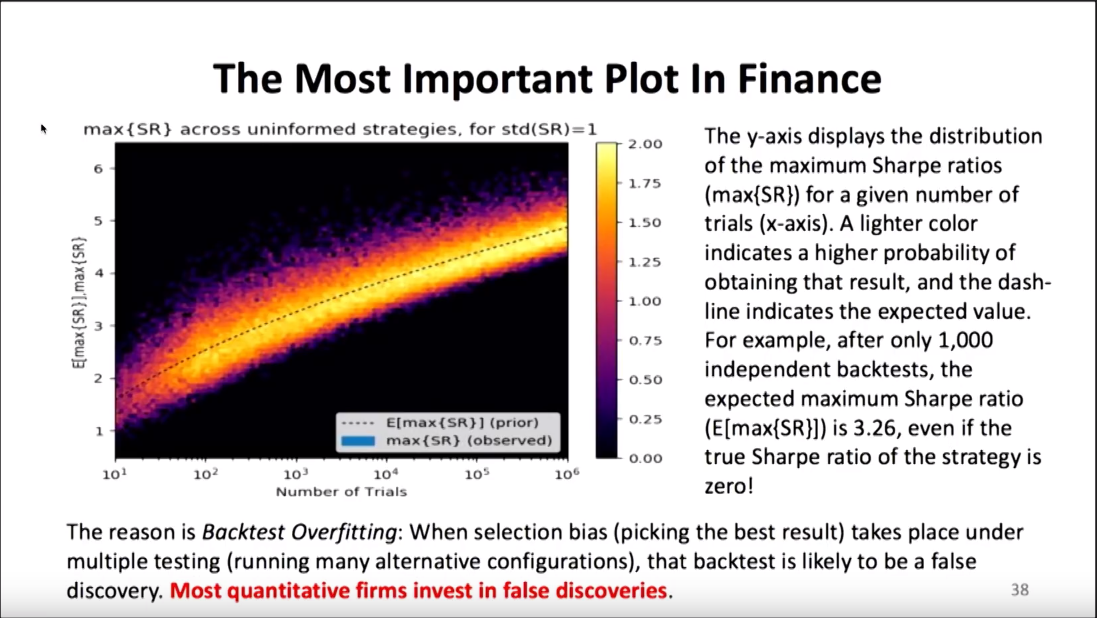
유튜브도 보기 싫고 귀찮은 사람은 이 그림만 봐도 된다.

설명 하자면 Sharpe Ratio는 만들 수 있음
number of trials 높히면 sharpe ratio는 올라갈 수 밖에 없음
그리하여
deflated sharpe ratio를 쓰라고 함...
자세한 건
https://www.davidhbailey.com/dhbpapers/deflated-sharpe.pdf
수학과지만...
이런 논문을 볼 때 마다 느끼는 것은
ㅇㅋ formula는 이해를 하겠어
충분히 코드로도 재현할 수 있겠어
근데 직감적으로 공식을 이해는 못함
어떻게 도출했는 지...를
근데 이 논문은...
PSR를 알려고 하면 또 다른 논문을 봐야하고...
가서 봐도 근데 내가 가장 약한 통계를 쌰브리니...
그냥 엔니지어 답게 포뮬라만 쓰는게 답인가...
import pandas as pd
import numpy as np
from scipy.stats import norm
import matplotlib.pyplot as plt
%matplotlib inline

# universal constants
gamma = 0.5772156649015328606
e = np.exp(1)

# analytical formula for expected maximum sharpe ratio
def approximate_expected_maximum_sharpe(mean_sharpe, var_sharpe, nb_trials):
    return mean_sharpe + np.sqrt(var_sharpe) * (
        (1 - gamma) * norm.ppf(1 - 1 / nb_trials) + gamma * norm.ppf(1 - 1 / (nb_trials * e)))

def compute_deflated_sharpe_ratio(*,
                                  estimated_sharpe,
                                  sharpe_variance,
                                  nb_trials,
                                  backtest_horizon,
                                  skew,
                                  kurtosis):
    SR0 = approximate_expected_maximum_sharpe(0, sharpe_variance, nb_trials)

    return norm.cdf(((estimated_sharpe - SR0) * np.sqrt(backtest_horizon - 1))
                    / np.sqrt(1 - skew * estimated_sharpe + ((kurtosis - 1) / 4) * estimated_sharpe**2))
예) 랜덤 variable inputs
compute_deflated_sharpe_ratio(estimated_sharpe=2.5 / np.sqrt(252),
                              sharpe_variance=0.5 / 252,
                              nb_trials=100,
                              backtest_horizon=1250,
                              skew=-3,
                              kurtosis=10)
0.89967234849777633
흠...
90%로 확률로 좋은 알고리즘이라...
출처: https://gmarti.gitlab.io/qfin/2018/05/30/deflated-sharpe-ratio.html
엔지니어 위에 있는
물리학자
물리학자 위에 있는
수학자
