OpenCV Contours
Contours
윤곽, 테두리를 의미한다.
cv2.findContours(image, mode, method) : 이미지에서 Contours를 찾는 함수
- mode : Contours를 찾는 방법
RETR_EXTERNAL : 바깥쪽 line만 찾기
RETR_LIST : 모든 line을 찾지만, hierarchy 구성X
RETR_TREE : 모든 line을 찾고, hierarchy 구성O - method : Contours를 찾는 근사치 방법
CHAIN_APPROX_NONE : 모든 Contour 포인트 저장
CHAIN_APPROX_SIMPLE : Contour line을 그릴 수 있는 포인트만 저장
※ 입력 이미지는 Gray Scale Threshold 전처리 과정이 필요
cv2.drawContours(image, contours, contour_index, color, thickness) : Contour들을 그리는 함수
- contour_index : 그리고자 하는 Contour line(전체 = -1)
import cv2
import matplotlib.pyplot as plt

image = cv2.imread('black.jpg')
# 이미지의 Contours를 찾기 위해서 사진을 흑백으로 가져와야함
image_gray = cv2.cvtColor(image, cv2.COLOR_BGR2GRAY)
# cv2.threshold(image, thresh, max_value, type) => ret와 thresh을 반환
# ret : 사용된 임계값
# thresh : image와 동일한 형태의 임계값 처리한 이미지
ret, thresh = cv2.threshold(image_gray, 127, 255, 0)

plt.imshow(cv2.cvtColor(thresh, cv2.COLOR_GRAY2RGB))
plt.show()
# cv2.findContours(image, mode, method) => contours, hierarchy
# contours : 검출된 contours 좌표, ndarray 형태
# hierarchy : 외곽선의 계층 정보
# cv2.RETE_TREE를 사용하여 hierarchy을 같이 구성한다.
contours = cv2.findContours(thresh, cv2.RETR_TREE, cv2.CHAIN_APPROX_SIMPLE)
# contours[0] : cv2.findContours()를 통해 구한 contours 좌표
# contourIndex = -1 : 모든 외곽선을 그림
image = cv2.drawContours(image, contours[0], -1, (0, 255, 0), 4)

plt.imshow(cv2.cvtColor(image, cv2.COLOR_BGR2RGB))
plt.show()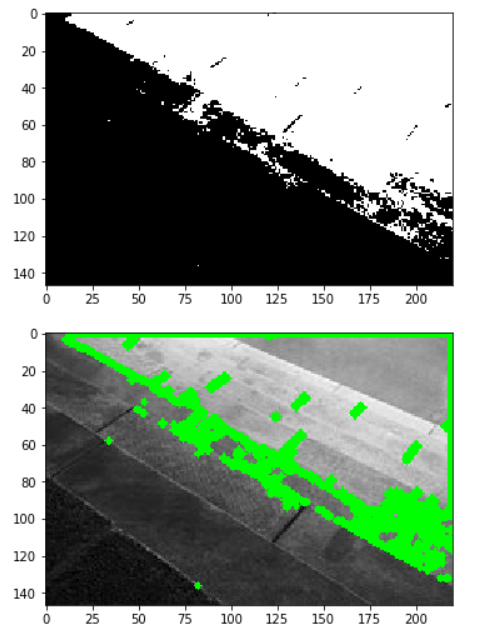
cv2.convexHull(contour) : Convex Hull 알고리즘으로 외곽을 구하는 함수
- 대략적인 형태의 contour 외곽을 빠르게 구할 수 있다.
import cv2
import matplotlib.pyplot as plt

image = cv2.imread('image99.jpg')
image_gray = cv2.cvtColor(image, cv2.COLOR_BGR2GRAY)
ret, thresh = cv2.threshold(image_gray, 230, 255, 0)
# cv2.bitwise_not(image) : 입력 이미지와 mask로 출력 이미지 생성, 마스크 배열이 포함되어 있다면, 해당 영역만 반전 연산을 수행
thresh = cv2.bitwise_not(thresh)
contours = cv2.findContours(thresh, cv2.RETR_TREE, cv2.CHAIN_APPROX_SIMPLE)
image = cv2.drawContours(image, contours[0], -1, (0, 0, 255), 4)

plt.imshow(cv2.cvtColor(image, cv2.COLOR_BGR2RGB))
plt.show()

contour = contours[0][0]
hull = cv2.convexHull(contour)
image = cv2.drawContours(image,[hull], -1, (255, 0, 0), 4)

plt.imshow(cv2.cvtColor(image, cv2.COLOR_BGR2RGB))
plt.show()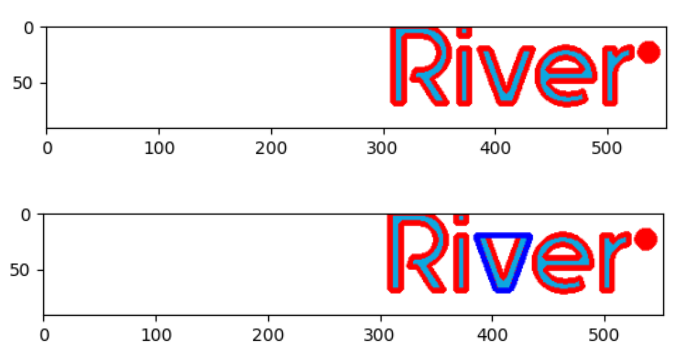
cv2.approxPloyDP(curve, epsilon, closed) : 근사치 contour을 구하는 함수
- curve : contour
- epsilon : 근사화 정밀도, 입력 곡선과 출력 곡선 간의 최대거리(클수록 point 개수 감수)
- closed : 폐곡선 여부
import cv2
import matplotlib.pyplot as plt

image = cv2.imread('image99.jpg')
image_gray = cv2.cvtColor(image, cv2.COLOR_BGR2GRAY)
ret, thresh = cv2.threshold(image_gray, 230, 255, 0)
# cv2.bitwise_not(image) : 입력 이미지와 mask로 출력 이미지 생성, 마스크 배열이 포함되어 있다면, 해당 영역만 반전 연산을 수행
thresh = cv2.bitwise_not(thresh)

contours = cv2.findContours(thresh, cv2.RETR_TREE, cv2.CHAIN_APPROX_SIMPLE)
image = cv2.drawContours(image, contours[0], -1, (0, 0, 255), 4)

plt.imshow(cv2.cvtColor(image, cv2.COLOR_BGR2RGB))
plt.show()

contour = contours[0][0]
epsilon = 0.01 * cv2.arcLength(contour, True)
approx = cv2.approxPolyDP(contour, epsilon, True)
image = cv2.drawContours(image, [approx], -1, (0, 255, 0), 4)

plt.imshow(cv2.cvtColor(image, cv2.COLOR_BGR2RGB))
plt.show()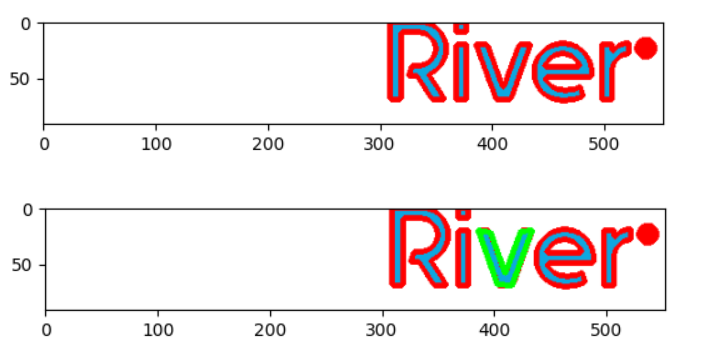
contour의 면적, 둘레, 특징
- cv2.contourArea(contour) : contour의 면적
- cv2.arcLength(contour) : contour의 둘레
- cv2.moments(contour) : contour의 특징
import cv2
import matplotlib.pyplot as plt

image = cv2.imread('image99.jpg')
image_gray = cv2.cvtColor(image, cv2.COLOR_BGR2GRAY)
ret, thresh = cv2.threshold(image_gray, 230, 255, 0)
# cv2.bitwise_not(image) : 입력 이미지와 mask로 출력 이미지 생성, 마스크 배열이 포함되어 있다면, 해당 영역만 반전 연산을 수행
thresh = cv2.bitwise_not(thresh)

# 임계값 처리 과정을 거친 image를 hierarchy(계층)을 포함하여 끝점만 남기고 다 삭제
contours = cv2.findContours(thresh, cv2.RETR_TREE, cv2.CHAIN_APPROX_SIMPLE)
image = cv2.drawContours(image, contours[0], -1, (0, 0, 255), 4)

contour = contours[0][0]
# 넓이
area = cv2.contourArea(contour)
print(area)
# 길이(둘레)
length = cv2.arcLength(contour, True)
print(length)
# 특징
M = cv2.moments(contour)
print(M)

plt.imshow(cv2.cvtColor(image, cv2.COLOR_BGR2RGB))
plt.show()

.