OpenCV 도형그리기
cv2.line(image, start, end, thickness) : 직선을 그리는 함수
cv2.rectangle(image, start, end, color, thickness) : 직선을 그리는 함수
cv2.circle(image, center, radian, color, thickness) : 원을 그리는 함수
cv2.polylines(image, points, is_closed, color, thickness) : 다각형을 그리는 함수
- points : 꼭짓점들
- is_closed : 닫힌 도형 여부
cv2.putText(image, text, position, font_type, font_scale, color) : 텍스트를 그리는 함수
import cv2
import numpy as np
import matplotlib.pyplot as plt

image = np.full((512, 512, 3), 255, np.uint8)
# (0,0)부터 (255, 255)까지 두께가 3인 직선 그리기
image1 = cv2.line(image, (0, 0), (255, 255), 3)
# 왼쪽 위(20, 20)부터 오른쪽 아래(255, 255)까지 두께가 3인 사각형 그리기
image2 = cv2.rectangle(image, (20, 20), (255, 255), (255, 0, 0), 3)
# 중심이 (400, 400)이고 반지름이 100이고 두께가 3인 원 그리기
image3 = cv2.circle(image, (400, 400), 100, 3)
# points 안에 있는 좌표들을 직선으로 연결한 두께가 4인 다각형 그리기
points =np.array([[10, 10], [120, 340], [182, 500], [250, 370]])
image4 = cv2.polylines(image, [points], True, (0, 0, 255), 4)
# (0, 400)을 시작으로 Hello World라는 단어 그리기
image5 = cv2.putText(image, "Hello World", (0, 400), cv2.FONT_ITALIC, 2, (255, 0, 0))

plt.imshow(image1)
plt.imshow(image2)
plt.imshow(image3)
plt.imshow(image4)
plt.imshow(image5)
plt.show()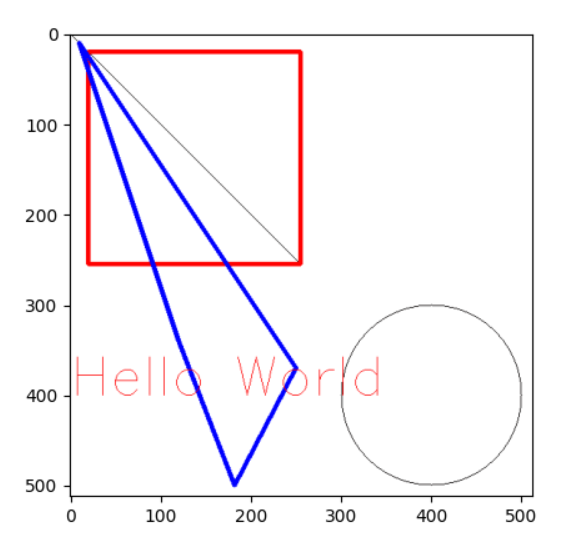

.