Intro
프로젝트를 진행하면서 PieChart를 구현할 일이 생겨 MPAndroidChart 라이브러리(MPAndroidChart Github)를 이용해서 구현해보려고 한다.
MPAndroidChart는 PieChart 외에도 LineChart, BarChart, ScatterChart 등 다양한 차트를 구현할 수 있게 지원해준다.
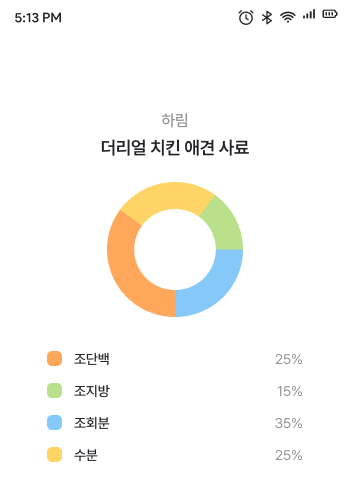
디자이너분이 디자인해주신 화면은 아래처럼 생겼다..! 최대한 비슷하게 만들어보자,,
문서
MPAndroidChart에 공식 문서(MPAndroidChart Document)가 존재하긴 하나 설명이 불친절하고 보기가 너무 힘들다.. 공식 문서만 보기 보다는 wiki(MPAndroidChart wiki)를 같이 보는 게 구현하기 훨씬 수월하다.
구현
dependency 추가
- build.gradle(Module :app)
dependencies {
    implementation 'com.github.PhilJay:MPAndroidChart:v3.1.0'
}- settings.gradle
dependencyResolutionManagement {
    ...
    repositories {
        ...
        maven { url 'https://jitpack.io' }
    }
}
settings.gradle과 app 단위 build.gradle에 dependency를 추가해준다.
xml
dependency를 추가했다면 xml에 사용하고자 하는 차트를 넣어준다.
태그에 com.github.mikephil.charting.charts.를 작성하면 아래 사진처럼 리스트가 나오는데 이중 사용하고자 하는 차트를 입력하면 된다.
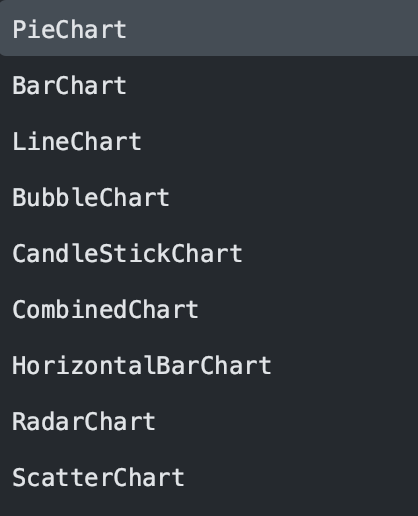
아래 코드는 PieChart를 적용한 예시이다.
<com.github.mikephil.charting.charts.PieChart
	android:id="@+id/piechart_feed_nutrient"
    android:layout_width="0dp"
    android:layout_height="0dp"
    android:layout_marginHorizontal="112dp"
    android:layout_marginTop="24dp"
    app:layout_constraintDimensionRatio="1:1"
    app:layout_constraintEnd_toEndOf="parent"
    app:layout_constraintStart_toStartOf="parent"
	app:layout_constraintTop_toBottomOf="@id/textview_feed_name" />
Fragment
import android.os.Bundle
import android.view.LayoutInflater
import android.view.View
import android.view.ViewGroup
import androidx.core.content.ContextCompat
import androidx.fragment.app.Fragment
import com.github.mikephil.charting.animation.Easing
import com.github.mikephil.charting.data.PieData
import com.github.mikephil.charting.data.PieDataSet
import com.github.mikephil.charting.data.PieEntry
import com.project.meongcare.databinding.FragmentFeedBinding

class FeedFragment : Fragment() {

    private var _binding: FragmentFeedBinding? = null
    private val binding get() = _binding!!

    override fun onCreateView(
        inflater: LayoutInflater,
        container: ViewGroup?,
        savedInstanceState: Bundle?,
    ): View {
        _binding = FragmentFeedBinding.inflate(inflater, container, false)
        return binding.root
    }

    override fun onViewCreated(view: View, savedInstanceState: Bundle?) {
        super.onViewCreated(view, savedInstanceState)
        initNutrientPieChart()
    }

    private fun initNutrientPieChart() {
    	// 데이터 추가는 Entry 클래스를 이용한다.
        // PieChart를 이용할 것이기 때문에 PieEntry를 활용해 입력할 데이터를 설정한다.
        val nutrientRatio = listOf(
            PieEntry(25f),
            PieEntry(15f),
            PieEntry(35f),
            PieEntry(25f),
        )

		// slice의 색상을 설정해주기 위해 색상값 list를 생성한다.
        val pieColors = listOf(
            resources.getColor(R.color.main3, null),
            resources.getColor(R.color.sub7, null),
            resources.getColor(R.color.sub6, null),
            resources.getColor(R.color.sub8, null),
        )

		// nutrientRatio 데이터의 개별적인 스타일링을 위해 DataSet을 생성한다.
		// ""에는 label 자리인데 필요가 없어서 빈 문자열로 뒀다.
        val dataSet = PieDataSet(nutrientRatio, "")

        // slice의 색상을 설정해준다.
        dataSet.colors = pieColors

        // true로 설정하면 slice 위에 Entry로 설정한 값이 보여진다.
        // 만들어야하는 디자인에는 값이 필요없어 false로 설정해줬다.
        dataSet.setDrawValues(false)

		// description.isEnabled : 차트 설명 유무 설정
        // legend.isEnabled : 범례 유무 설정
        // isRotationEnabled : 차트 회전 활성화 여부 설정
        // holeRadius : 차트 중간 구멍 크기 설정
        // setTouchEnabled : slice 터치 활성화 여부 설정
        // animateY(1200, Easing.EaseInOutCubic) : 애니메이션 시간, 효과 설정
        binding.piechartFeedNutrient.apply {
            data = PieData(dataSet)

            description.isEnabled = false
            legend.isEnabled = false
            isRotationEnabled = true
            holeRadius = 60f
            setTouchEnabled(false)
            animateY(1200, Easing.EaseInOutCubic)

            // animate()를 호출하면 차트를 새로 고치기 위해 invalidate()를 호출할 필요가 없다.
            animate()
        }
    }

    override fun onDestroyView() {
        super.onDestroyView()
        _binding = null
    }

}
결과
디자인과 거의 비슷하게 구현되었다!👏

Android Developer