
Goal
Prometheus metrics를 시각화해줄 툴인 Grafana를 k8s cluster에 배포한다.
배포 과정
Grafana 배포 전 해당 포스팅에 기재 해둔 것을 사전에 배포해야 한다.
wget https://raw.githubusercontent.com/sysnet4admin/_Book_k8sInfra/main/ch6/6.4.1/grafana-install.sh
wget https://raw.githubusercontent.com/sysnet4admin/_Book_k8sInfra/main/ch6/6.4.1/grafana-preconfig.sh
wget https://raw.githubusercontent.com/sysnet4admin/_Book_k8sInfra/main/ch6/6.4.1/grafana-volume.yaml

chmod +x grafana-install.sh
chmod +x grafana-preconfig.sh
grafana-preconfig.sh script중 경로, IP와 같이 변경해줘야할 사항을 환경에 맞게 변경한 후 shell script로 배포한다.
⚡ root@master ~/on-premise/grafana hoon ./grafana-preconfig.sh
[Step 1/4] Task [Check helm status]
[Step 1/4] ok
[Step 2/4] Task [Check MetalLB status]
[Step 2/4] ok
[Step 3/4] Task [Create NFS directory for grafana]
Failed to get unit file state for nfs.service: No such file or directory
/nfs_shared/grafana created
[Step 3/4] Successfully completed
[Step 4/4] Task [Create PV,PVC for grafana]
persistentvolume/grafana created
persistentvolumeclaim/grafana created
[Step 4/4] Successfully completed
⚡ root@master ~/on-premise/grafana hoon ./grafana-install.sh
NAME: grafana
LAST DEPLOYED: Tue Nov 8 16:24:02 2022
NAMESPACE: default
STATUS: deployed
REVISION: 1
NOTES:
1. Get your 'admin' user password by running:
kubectl get secret --namespace default grafana -o jsonpath="{.data.admin-password}" | base64 --decode ; echo
2. The Grafana server can be accessed via port 80 on the following DNS name from within your cluster:
grafana.default.svc.cluster.local
Get the Grafana URL to visit by running these commands in the same shell:
NOTE: It may take a few minutes for the LoadBalancer IP to be available.
You can watch the status of by running 'kubectl get svc --namespace default -w grafana'
export SERVICE_IP=$(kubectl get svc --namespace default grafana -o jsonpath='{.status.loadBalancer.ingress[0].ip}')
http://$SERVICE_IP:80
3. Login with the password from step 1 and the username: adminwget 하여 받은 파일을 모두 알맞게 수정했다면 정상적으로 배포가 완료된다.
하지만, nfs-server ip를 수정하지 않아서 아래와 같이 mount faield가 되었다.
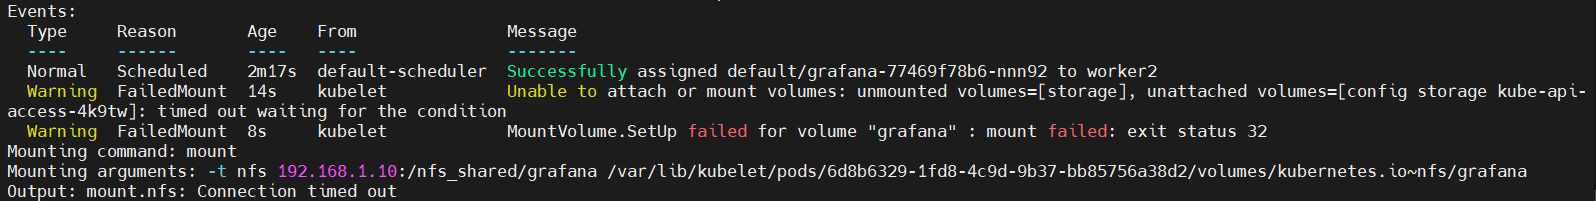
배포한 deploy 를 삭제하고 ./grafana-install.sh 를 통해 재설치 해야하는데 아래와 같은 상황이다.
⚡ root@master ~/on-premise/grafana hoon ./grafana-install.sh
Error: cannot re-use a name that is still in usesol) helm chart 삭제 후 재 설치
⚡ root@master ~/on-premise/grafana hoon helm list
NAME NAMESPACE REVISION UPDATED STATUS CHART APP VERSION
grafana default 1 2022-11-08 16:24:02.200757524 +0900 KST deployed grafana-5.3.0 7.0.3
jenkins default 1 2022-11-08 16:21:58.365689248 +0900 KST deployed jenkins-2.7.1 lts
prometheus default 1 2022-11-07 15:41:52.171092129 +0900 KST deployed prometheus-11.6.0 2.19.0helm delete grafana # helm chart 삭제
k delete deploy grafana # deploy 삭제
k delete svc grafana # service 삭제
./grafana-install.sh # 재배포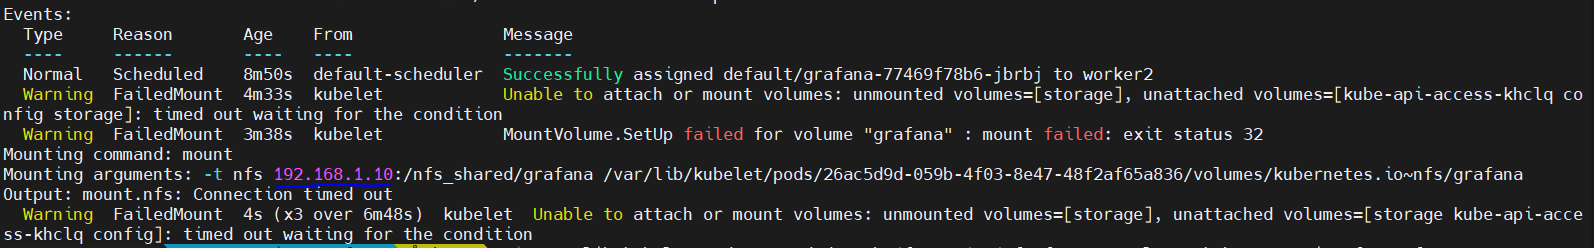
yaml 파일 수정후에도 192.168.8.100 으로 IP가 바뀌지 않아서 failed mount 에러가 뜬다.
알고보니 pv, pvc는 삭제하지 않아서 그랬다...
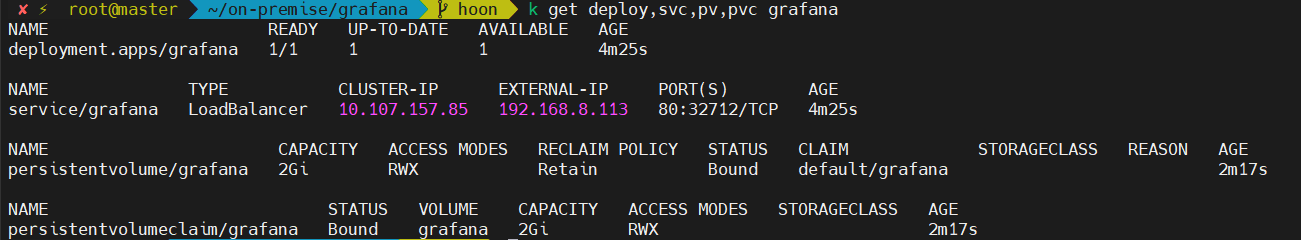
k delete pv,pvc,svc,deploy grafana
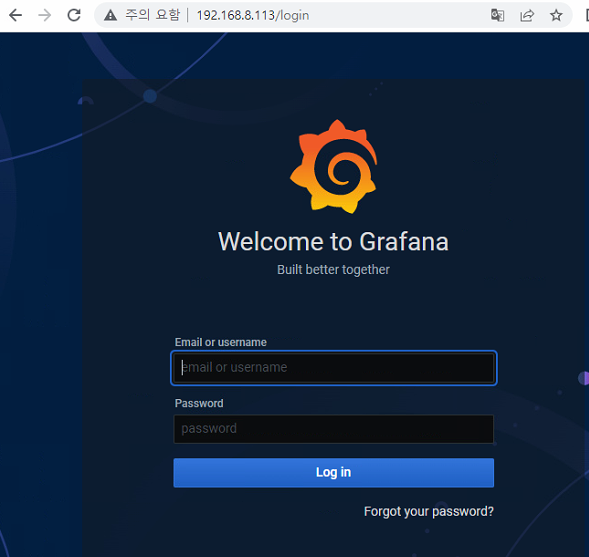
helm delete grafana배포 완료
Reference
- https://malwareanalysis.tistory.com/196
- https://github.com/sysnet4admin/_Book_k8sInfra/tree/main/ch6
- 조훈, 심근우, 문성주. 『컨테이너 인프라 환경 구축을 위한 쿠버네티스/도커』길벗, 2021