🔨micrometer prometheus
spring에서 기본적으로 제공해주는 micrometer를 사용해보자.
👉user-service 수정
<!-- micrometer prometheus -->
<dependency>
    <groupId>io.micrometer</groupId>
    <artifactId>micrometer-registry-prometheus</artifactId>
</dependency>
의존성을 추가해주고
management:
  endpoints:
    web:
      exposure:
        include: refresh, health, beans, busrefresh, info, metrics, prometheus
yml 설정파일에 info, metrix, prometheus를 추가해주었다.
@RestController
@RequestMapping("/")
@RequiredArgsConstructor
public class UserController {

    private final Environment env;
    private final Greeting greeting;
    private final UserService userService;

    @GetMapping("/health_check")
    @Timed(value = "users.status", longTask = true)
    public String status(){
        return String.format("It's Working in User Service"
                + ", port(local.server.port) = " + env.getProperty("local.server.port")
                + ", port(server.port) = " + env.getProperty("server.port")
                + ", token secret = " + env.getProperty("token.secret")
                + ", token expiration time = " + env.getProperty("token.expiration_time")
        );
    }

    @GetMapping("/welcome")
    @Timed(value = "users.welcome", longTask = true)
    public String welcome(){
        //return env.getProperty("greeting.message");
        return greeting.getMessage();
    }

}
@Timed 어노테이션을 추가해주고 value는 우리가 구분할 이름이다.
👉gateway 수정
<!-- micrometer prometheus -->
<dependency>
    <groupId>io.micrometer</groupId>
    <artifactId>micrometer-registry-prometheus</artifactId>
</dependency>
의존성 추가해주고
management:
  endpoints:
    web:
      exposure:
        include: refresh, health, beans, busrefresh, info, metrics, prometheus
yml 설정파일에 info, metrix, prometheus를 추가해주었다.
👉order-service 수정
<dependency>
    <groupId>org.springframework.boot</groupId>
    <artifactId>spring-boot-starter-actuator</artifactId>
</dependency>
<dependency>
    <groupId>org.springframework.cloud</groupId>
    <artifactId>spring-cloud-starter-bootstrap</artifactId>
</dependency>
<!-- micrometer prometheus -->
<dependency>
    <groupId>io.micrometer</groupId>
    <artifactId>micrometer-registry-prometheus</artifactId>
</dependency>
의존성 추가해주고
management:
  endpoints:
    web:
      exposure:
        include: refresh, health, beans, busrefresh, info, metrics, prometheus
yml 설정을 추가해준다.
👊확인하기
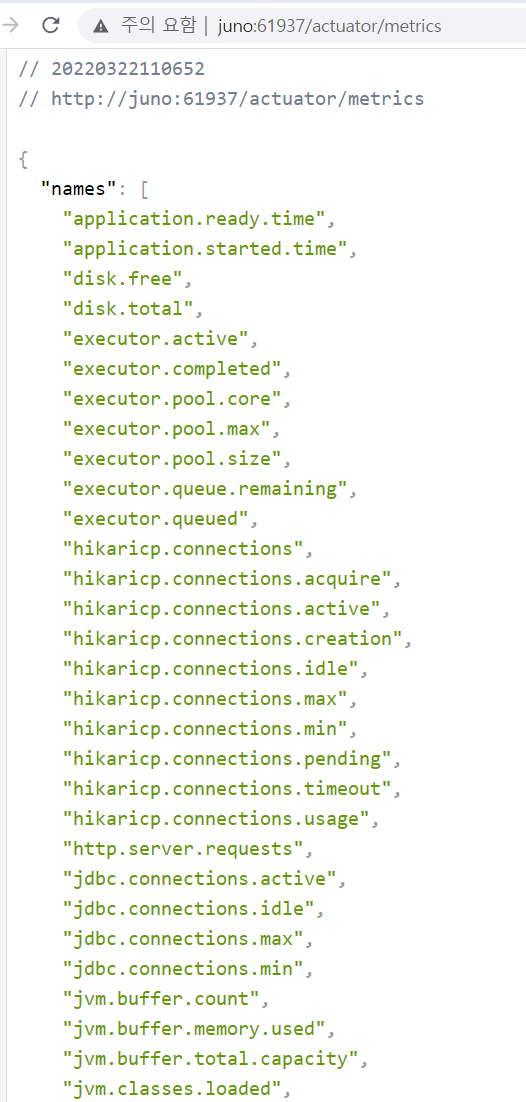
서버 실행후 metrics로 들어가면 다음과 같은 정보를 볼수 있다면 정상적으로 추가된것이 맞다.
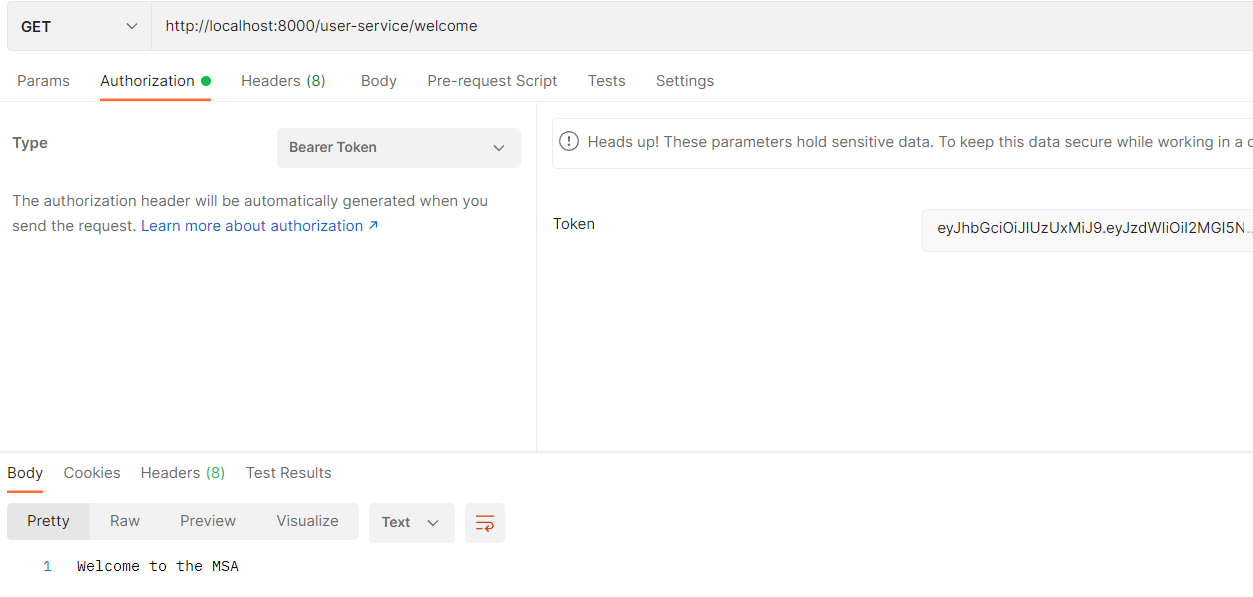
http://localhost:8000/user-service/welcome
http://localhost:8000/user-service/health_check
url을 요청한 후 metrics를 다시 요청해보자

이전에는 확인되지 않았던 user.status, user.welcome이 등록된 것을 확인할 수 있다. 이제부터 user.status, user.welcome의 지표를 수집하게 된다.
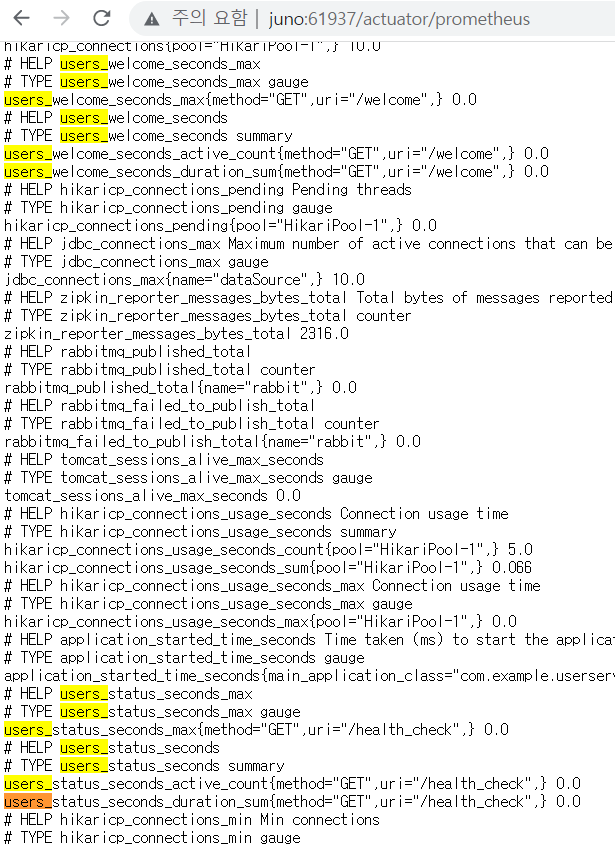
그리고나서 prometheus에서 지표가 저장되고 있다는 것을 확인할 수 있다.
🔨Prometheus & Grafana 설치
https://prometheus.io/download/
https://grafana.com/grafana/download
두 프로그램 모두 압축파일 형태로 설치해준다.
👉Prometheus 설정
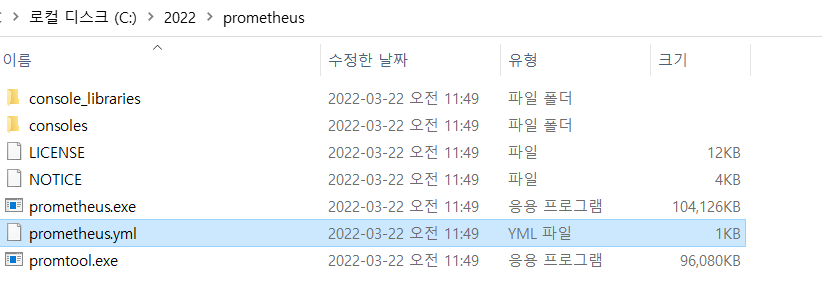
Prometheus를 설치하면 yml 파일을 확인할 수 있는데 해당 설정을 변경해주어서 사용하면 된다.
# my global config
global:
  scrape_interval: 15s # Set the scrape interval to every 15 seconds. Default is every 1 minute.
  evaluation_interval: 15s # Evaluate rules every 15 seconds. The default is every 1 minute.
  # scrape_timeout is set to the global default (10s).

# Alertmanager configuration
alerting:
  alertmanagers:
    - static_configs:
        - targets:
          # - alertmanager:9093

# Load rules once and periodically evaluate them according to the global 'evaluation_interval'.
rule_files:
  # - "first_rules.yml"
  # - "second_rules.yml"

# A scrape configuration containing exactly one endpoint to scrape:
# Here it's Prometheus itself.
scrape_configs:
  # The job name is added as a label `job=<job_name>` to any timeseries scraped from this config.
  - job_name: "prometheus"

    # metrics_path defaults to '/metrics'
    # scheme defaults to 'http'.

    static_configs:
      - targets: ["localhost:9090"]
최초 설정은 이렇게 되어있는데
# my global config
global:
  scrape_interval: 15s # Set the scrape interval to every 15 seconds. Default is every 1 minute.
  evaluation_interval: 15s # Evaluate rules every 15 seconds. The default is every 1 minute.
  # scrape_timeout is set to the global default (10s).

# Alertmanager configuration
alerting:
  alertmanagers:
    - static_configs:
        - targets:
          # - alertmanager:9093

# Load rules once and periodically evaluate them according to the global 'evaluation_interval'.
rule_files:
  # - "first_rules.yml"
  # - "second_rules.yml"

# A scrape configuration containing exactly one endpoint to scrape:
# Here it's Prometheus itself.
scrape_configs:
  # The job name is added as a label `job=<job_name>` to any timeseries scraped from this config.
  - job_name: "prometheus"

    # metrics_path defaults to '/metrics'
    # scheme defaults to 'http'.

    static_configs:
      - targets: ["localhost:9090"]
  - job_name: 'user-service'  # 생성할 job의 이름
    scrape_interval: 15s      # 15초 마다 정보 파싱
    metrics_path: '/user-service/actuator/prometheus' # 정보를 파싱해올 url
    static_configs:
      - targets: ['localhost:8000'] # url host
  - job_name: 'order-service'
    scrape_interval: 15s
    metrics_path: '/order-service/actuator/prometheus' # 정보를 파싱해올 url
    static_configs:
      - targets: ['localhost:8000'] # url host
  - job_name: 'gateway'
    scrape_interval: 15s
    metrics_path: '/actuator/prometheus' # 정보를 파싱해올 url
    static_configs:
      - targets: ['localhost:8000'] # url host
- job_name: 'user-service' # 생성할 job의 이름
scrape_interval: 15s # 15초 마다 정보 파싱
metrics_path: '/user-service/actuator/prometheus' # 정보를 파싱해올 url
static_configs:
- targets: ['localhost:8000'] # url host
- job_name: 'order-service'
scrape_interval: 15s
metrics_path: '/order-service/actuator/prometheus' # 정보를 파싱해올 url
static_configs:
- targets: ['localhost:8000'] # url host
- job_name: 'gateway'
scrape_interval: 15s
metrics_path: '/actuator/prometheus' # 정보를 파싱해올 url
static_configs:
- targets: ['localhost:8000'] # url host해당 정보를 추가해주었다.
        - id: order-service
          uri: lb://ORDER-SERVICE
          predicates:
            - Path=/order-service/actuator/**
            - Method=GET,POST
          filters:
            - RemoveRequestHeader=Cookie
- RewritePath=/order-service(?<segment>.*), /$\{segment}gateway에 actuator 설정이 없어서 접근이 불가능하다. 해당 설정을 추가해주자.

prometheus 파일로 서버를 실행하자.
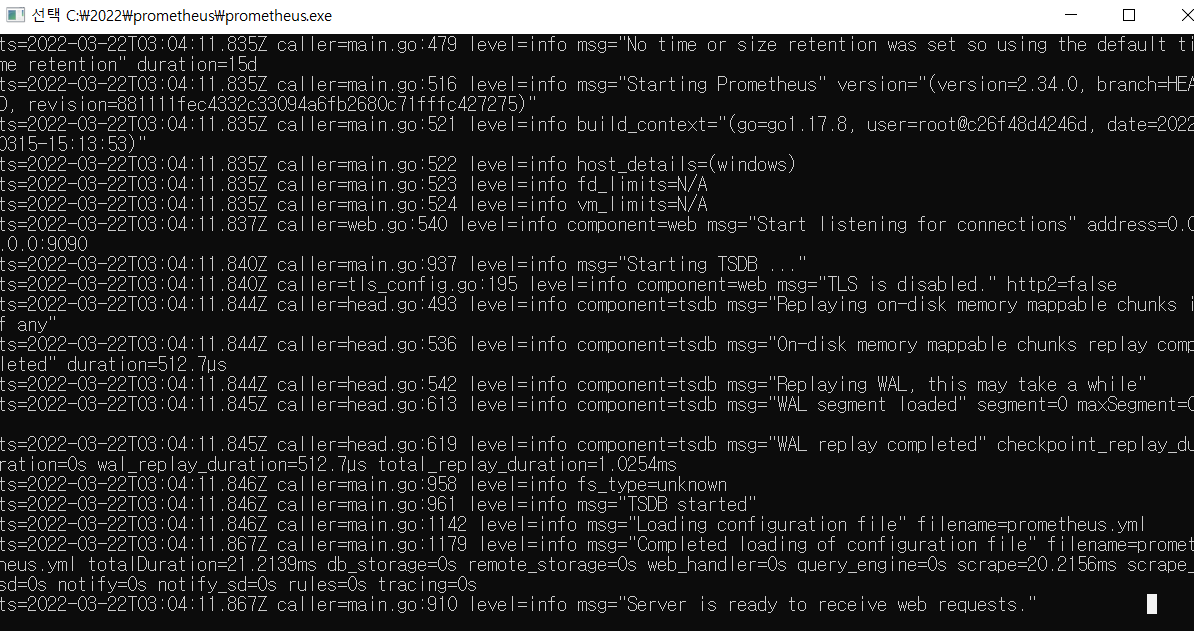
서버가 준비되었다고 뜨고
http://127.0.0.1:9090 으로 접속하면
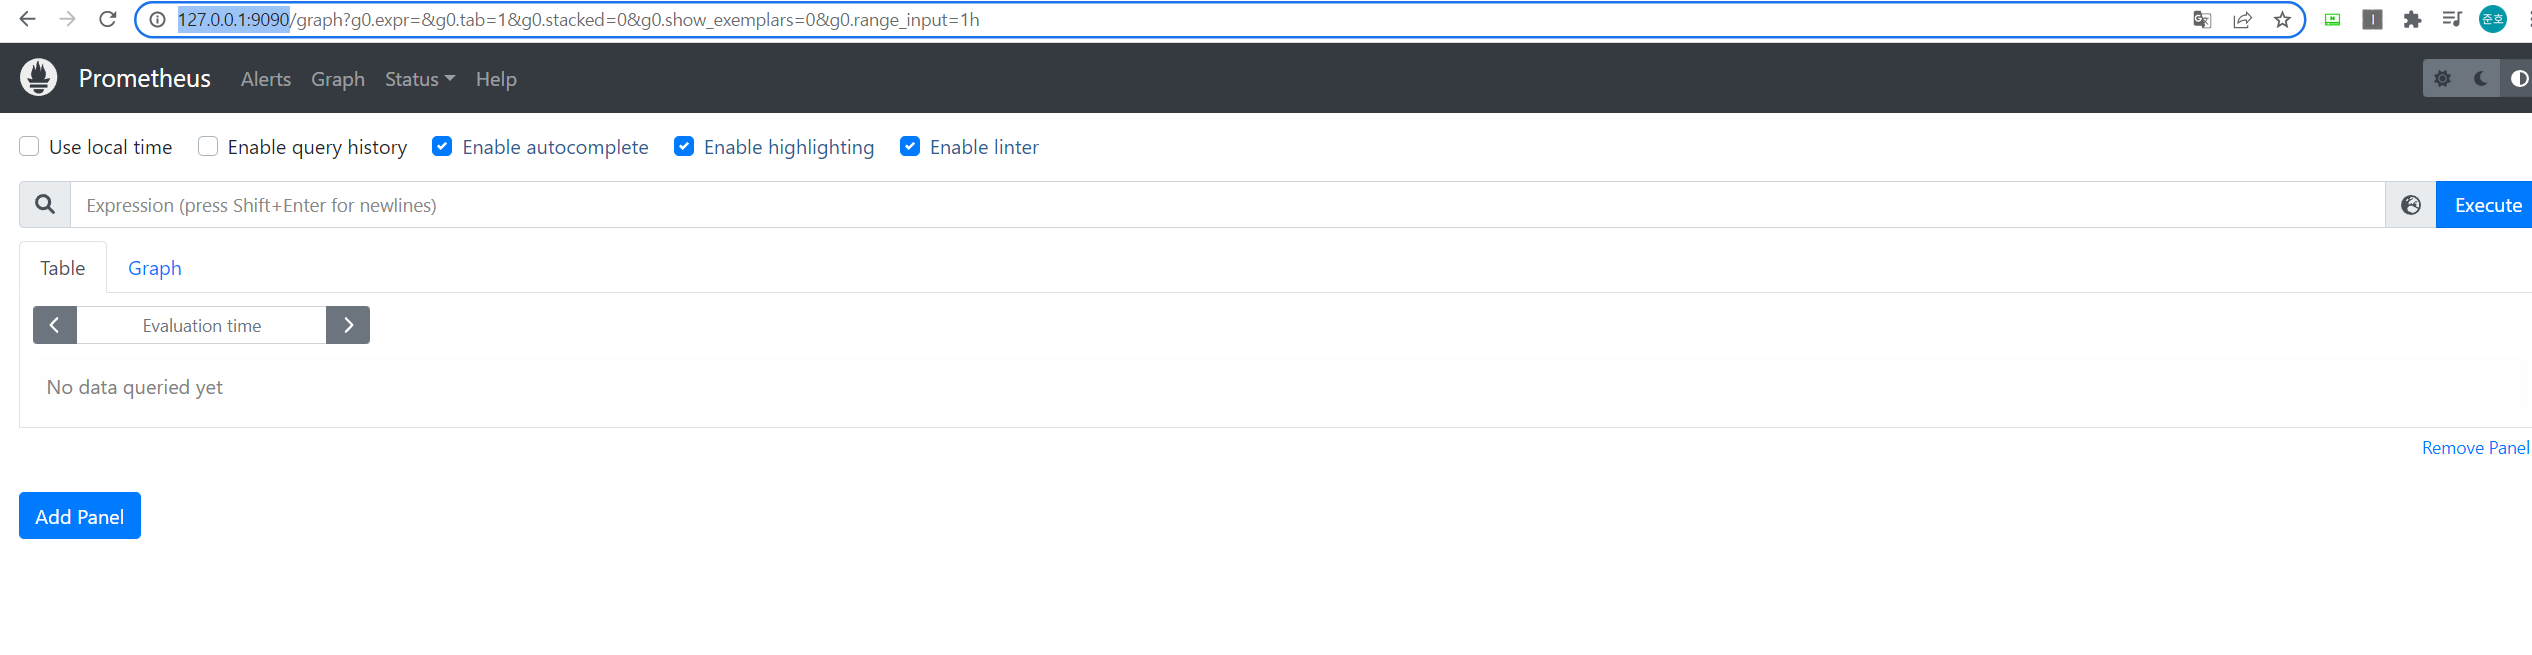
접속된 화면을 확인할 수 있다.
👉grafana 실행
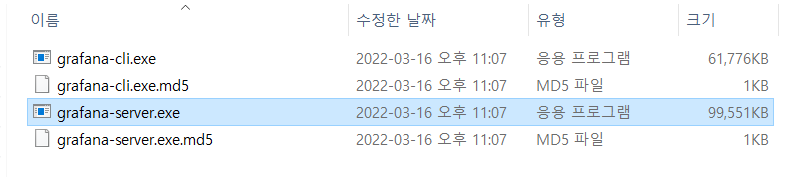
서버로 실행시켜주고
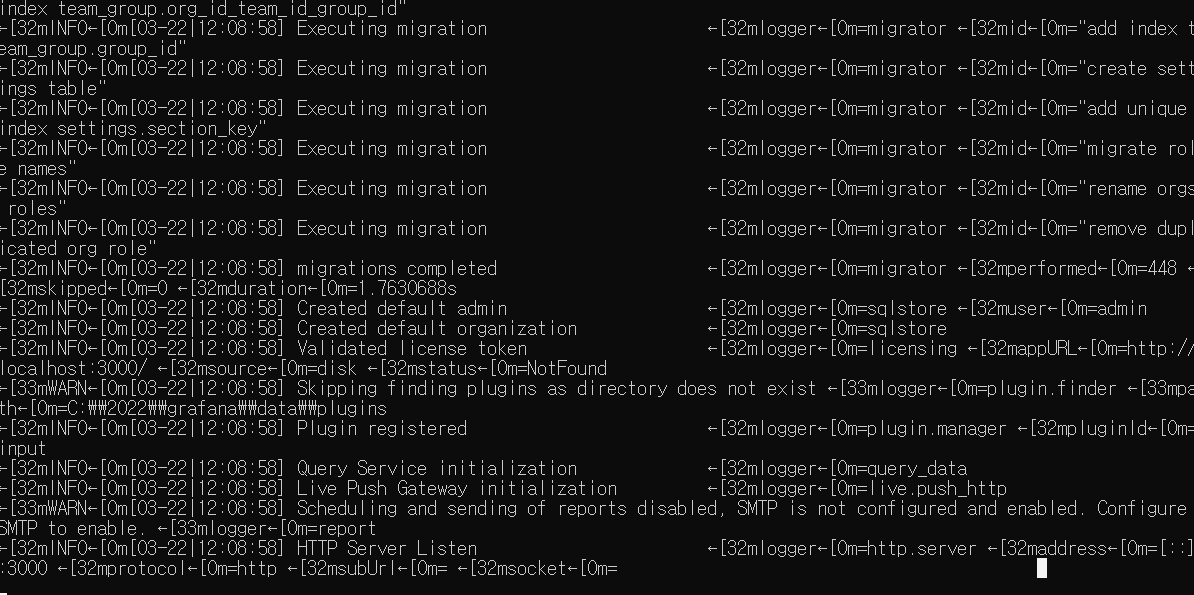
실행된 서버는 3000으로 열린다.
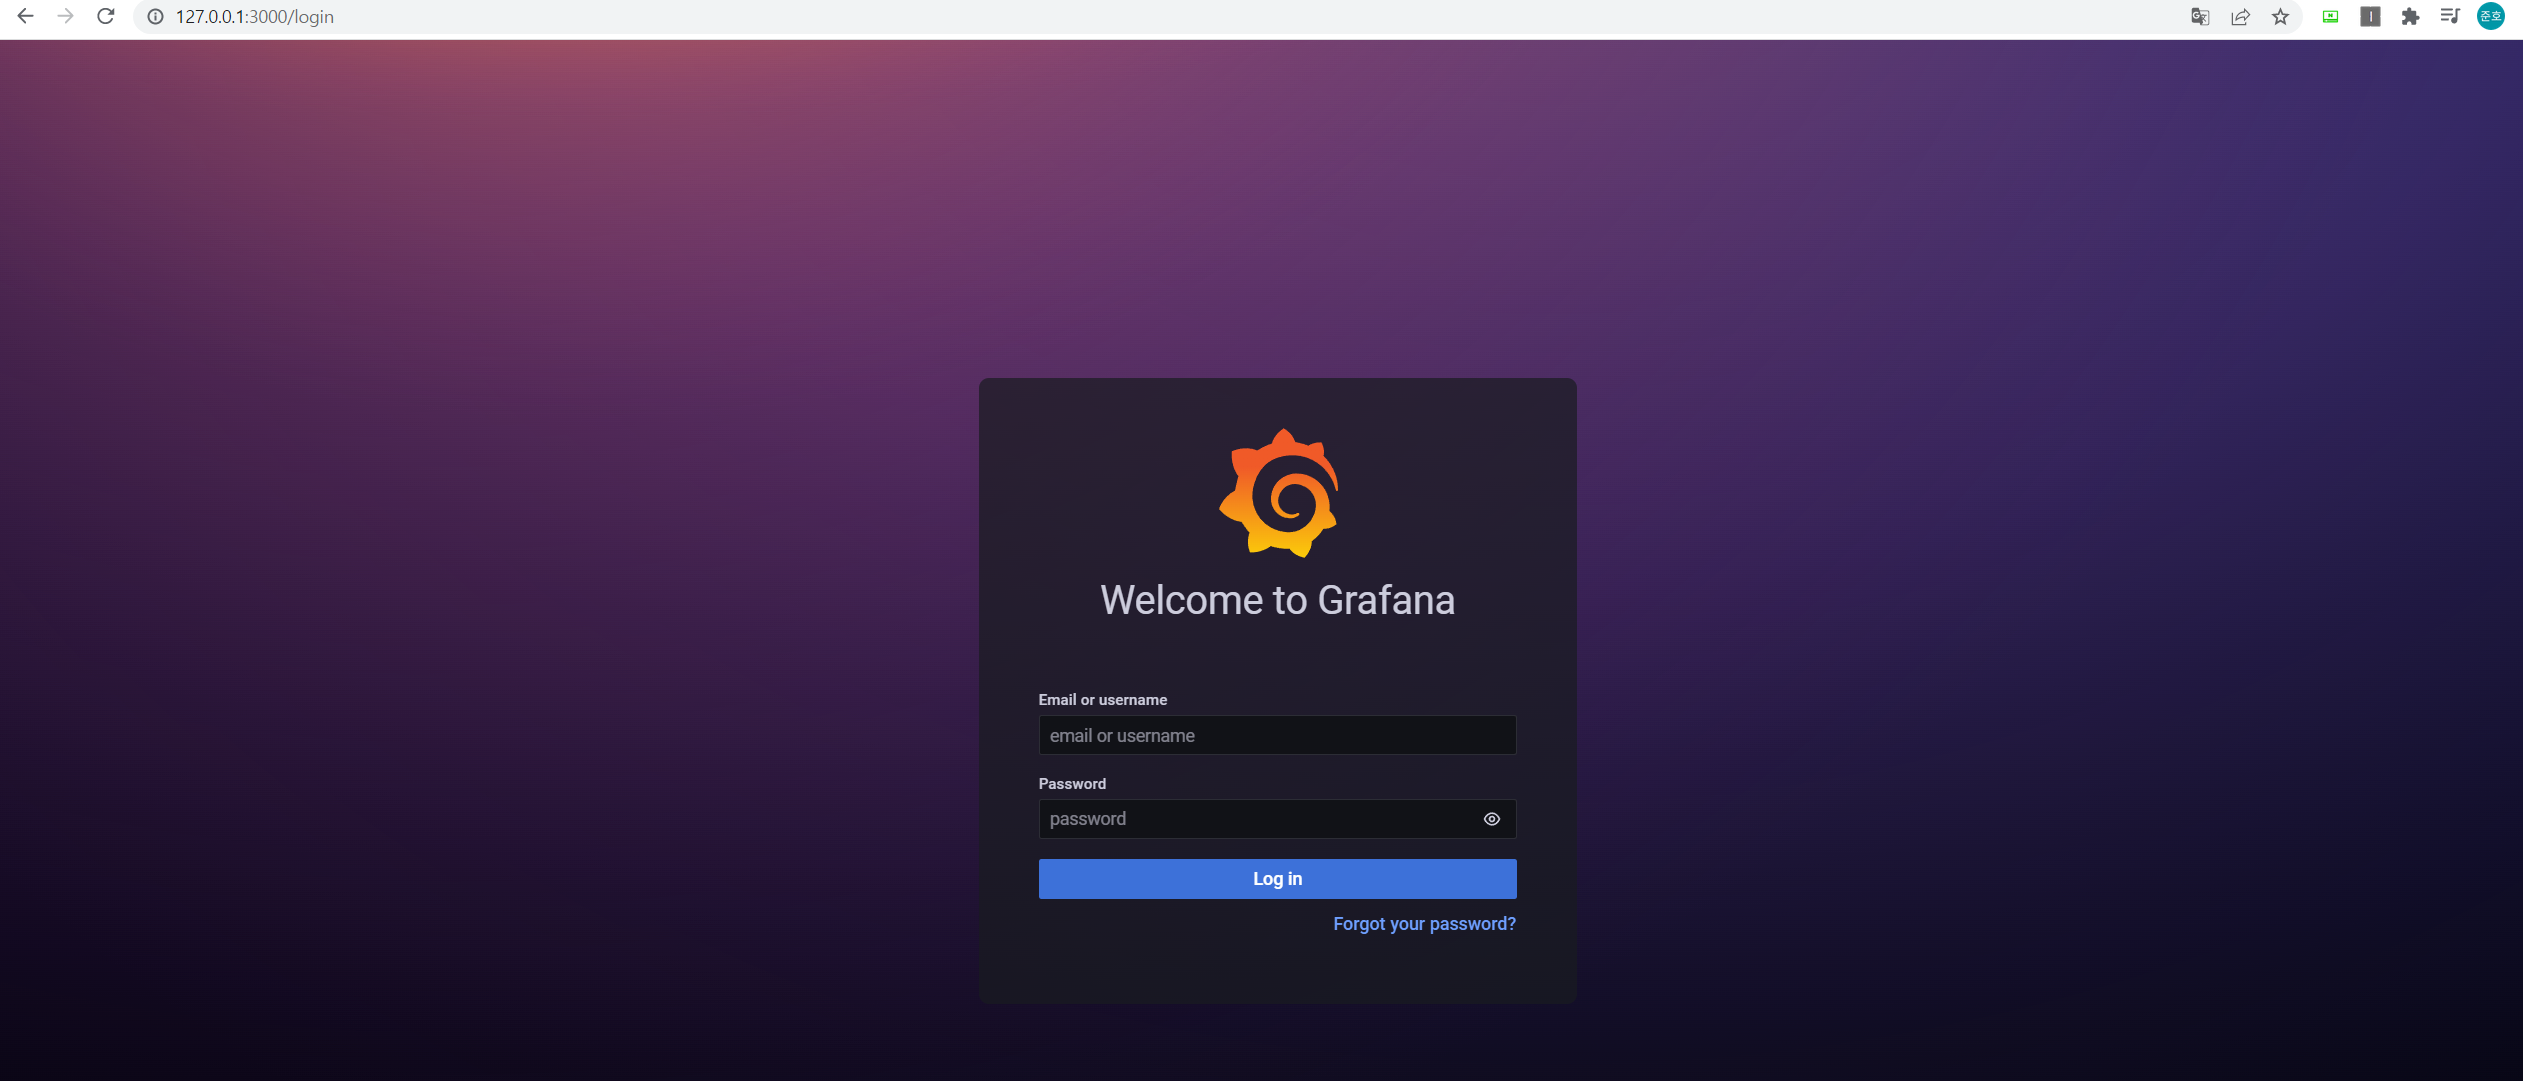
서버가 실행되고 최초 로그인은 아이디 : admin, 비밀번호 : admin으로 접속하면 된다.

그럼 비밀번호 변경하도록 유도하고 변경하고 접속하면 된다.
최초 서버 실행시 서버가 실행되는데까지 시간이 좀 걸린다 바로 접근이 안되면 조금만 더 기다렸다가 요청해보자.
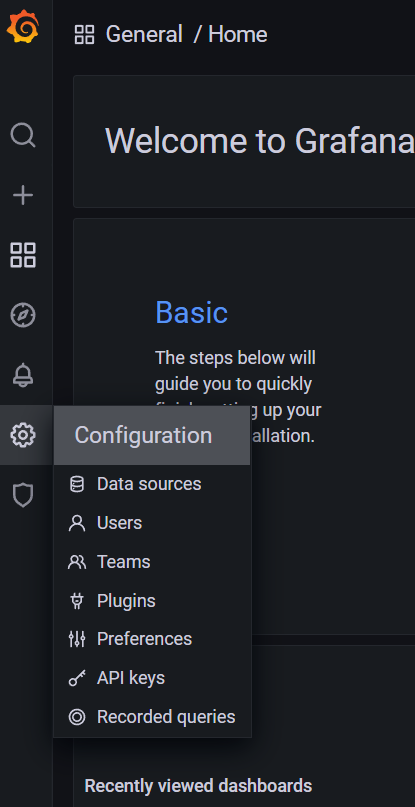
Configuration 누르고
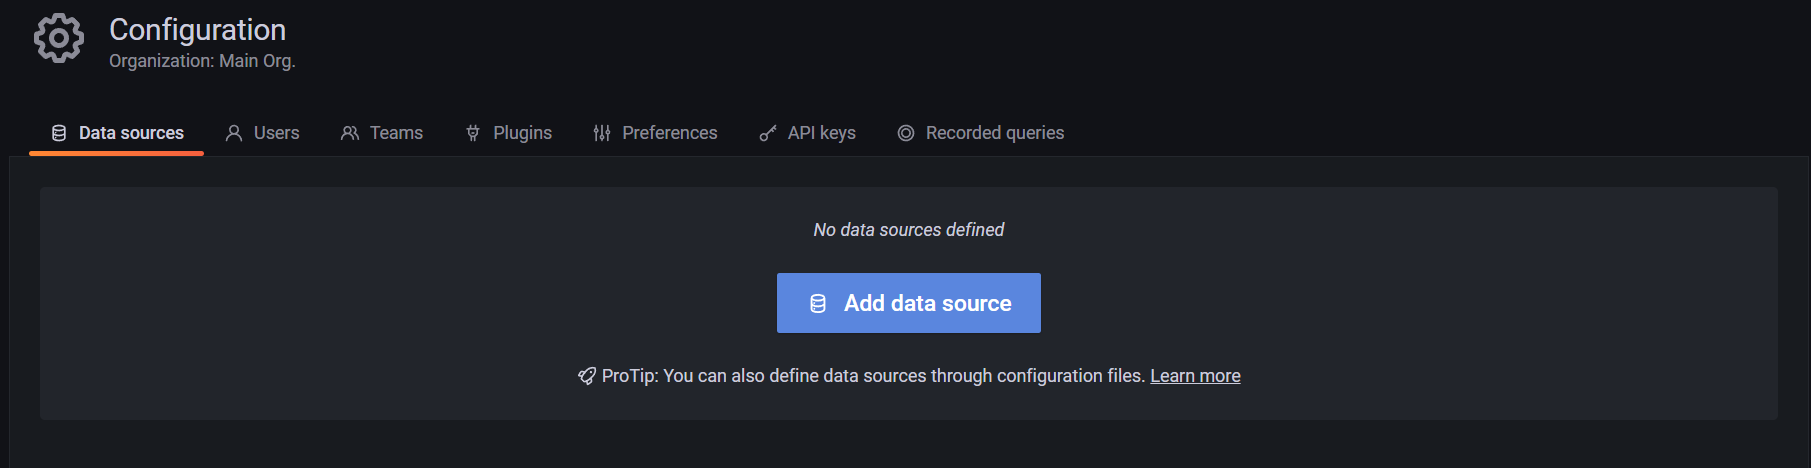
Add data source 클릭
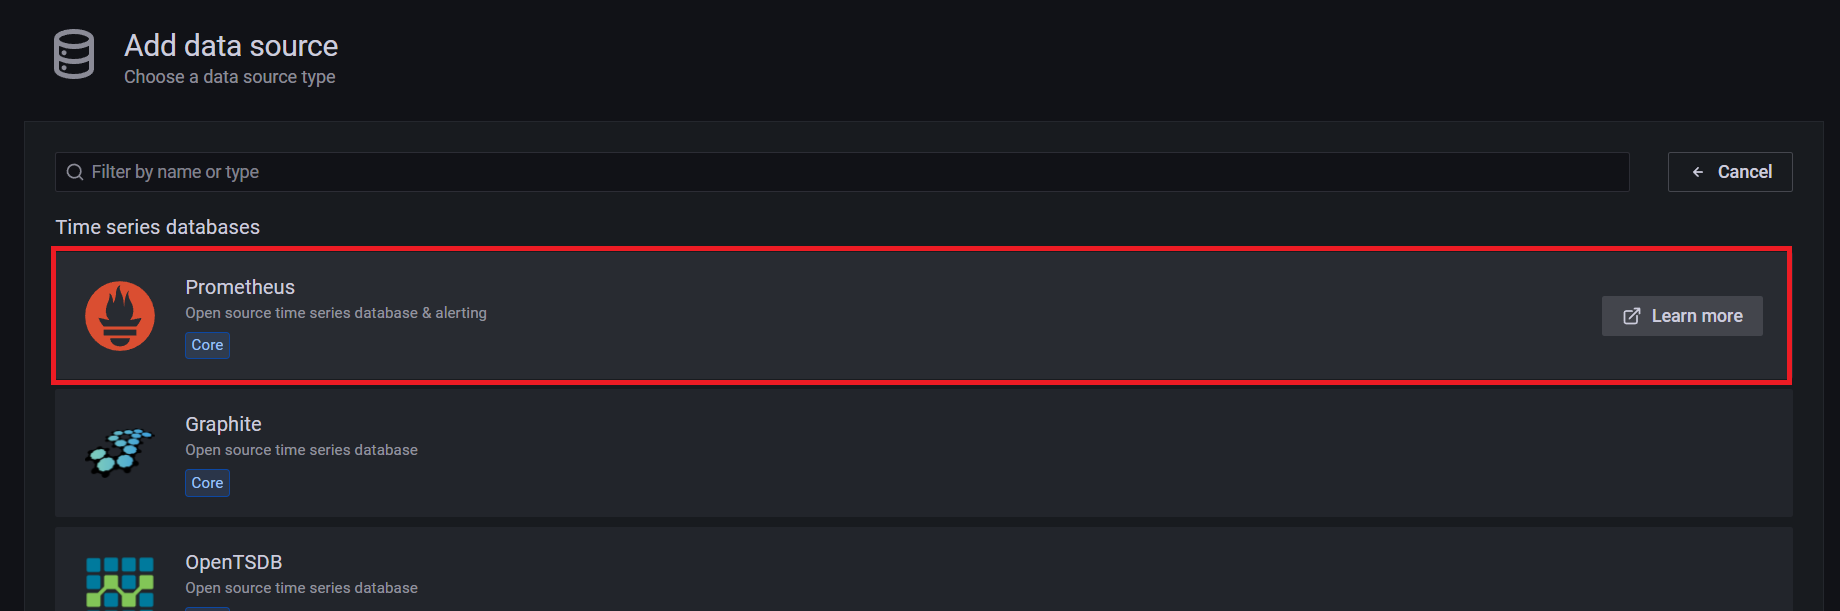
Prometheus 클릭
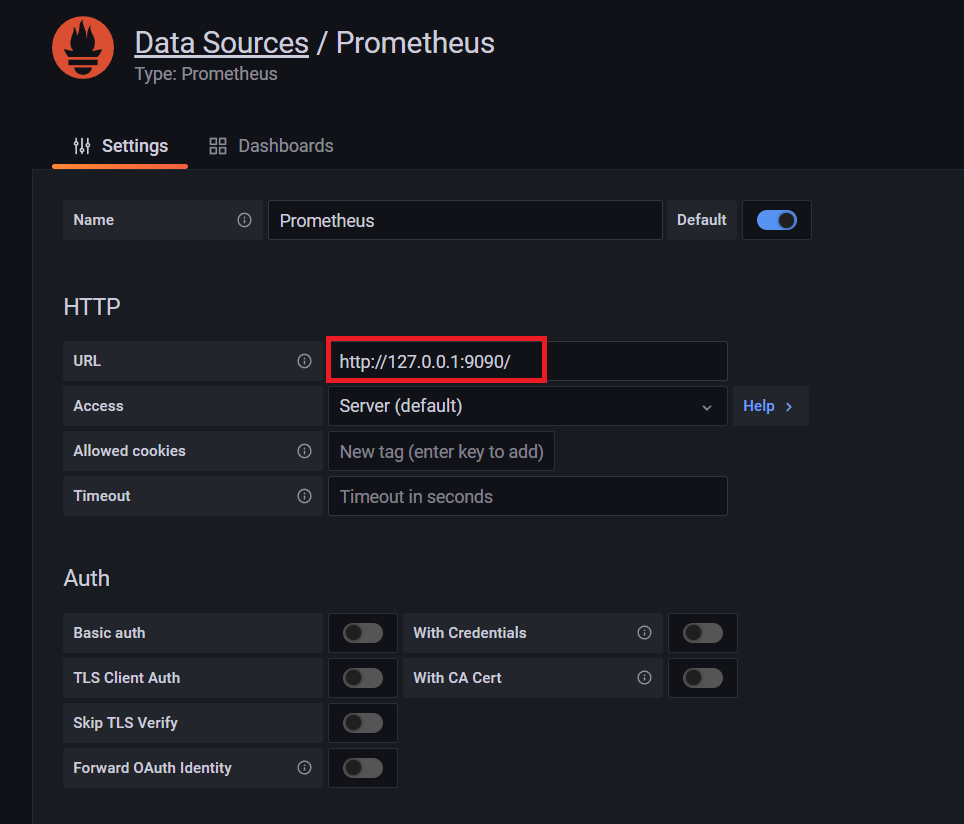
url입력 후
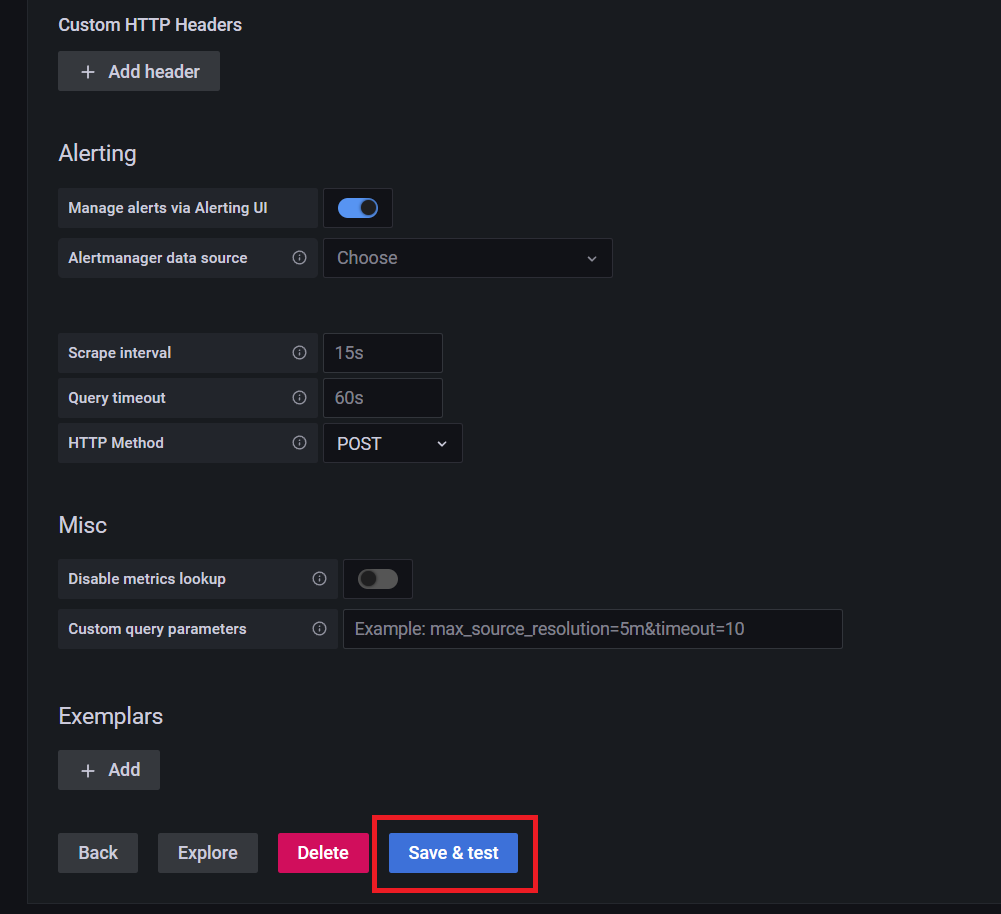
save 누르고 성공뜨면 된다.

정상 등록화면이다.
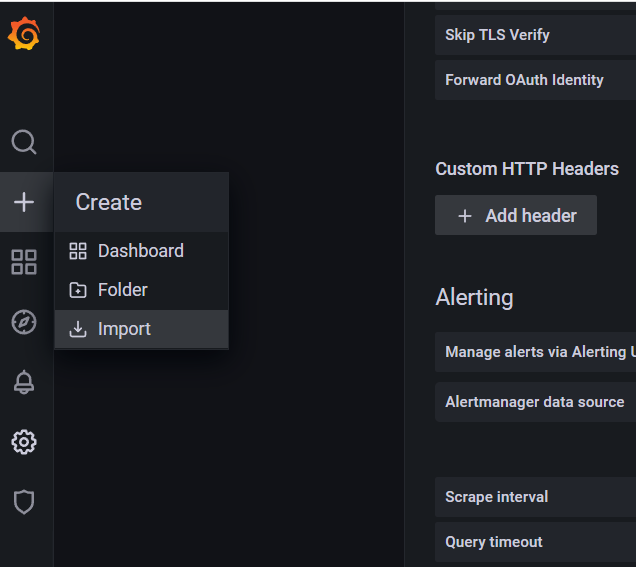
그 후에 Dashboard를 설정해줘야하는데 직접 만들어서 사용할수도 있지만 grafana에서 제공해주는 사용자들이 공유하는 Dashboard를 가져올수도 있다. Import를 누르고
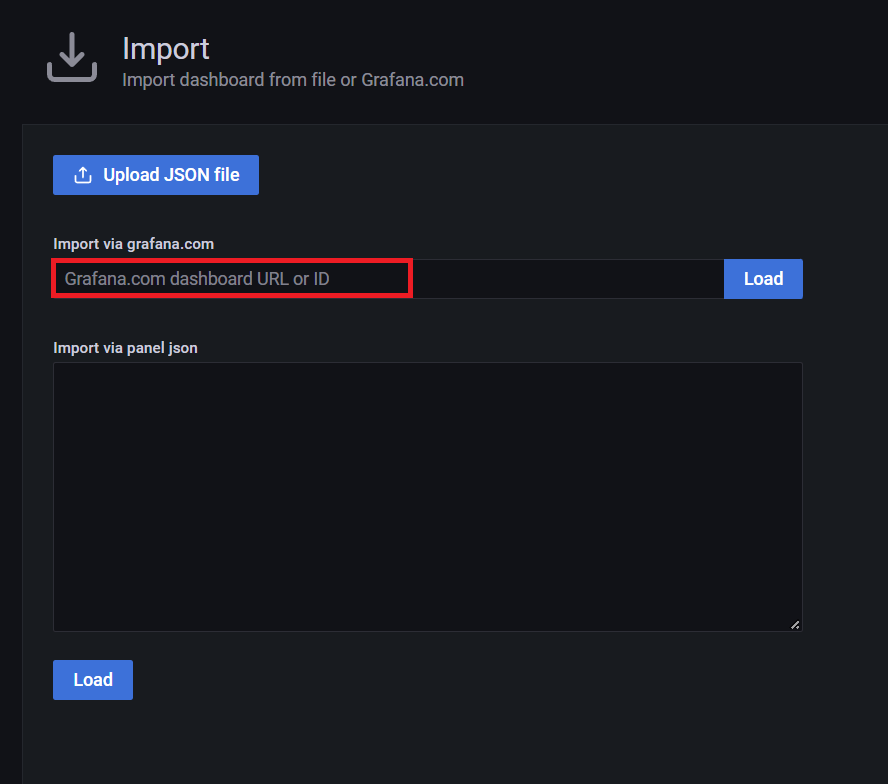
해당 부분의 ID나 URL을 입력해주면 된다.
https://grafana.com/grafana/dashboards/ 여기로 접근해서
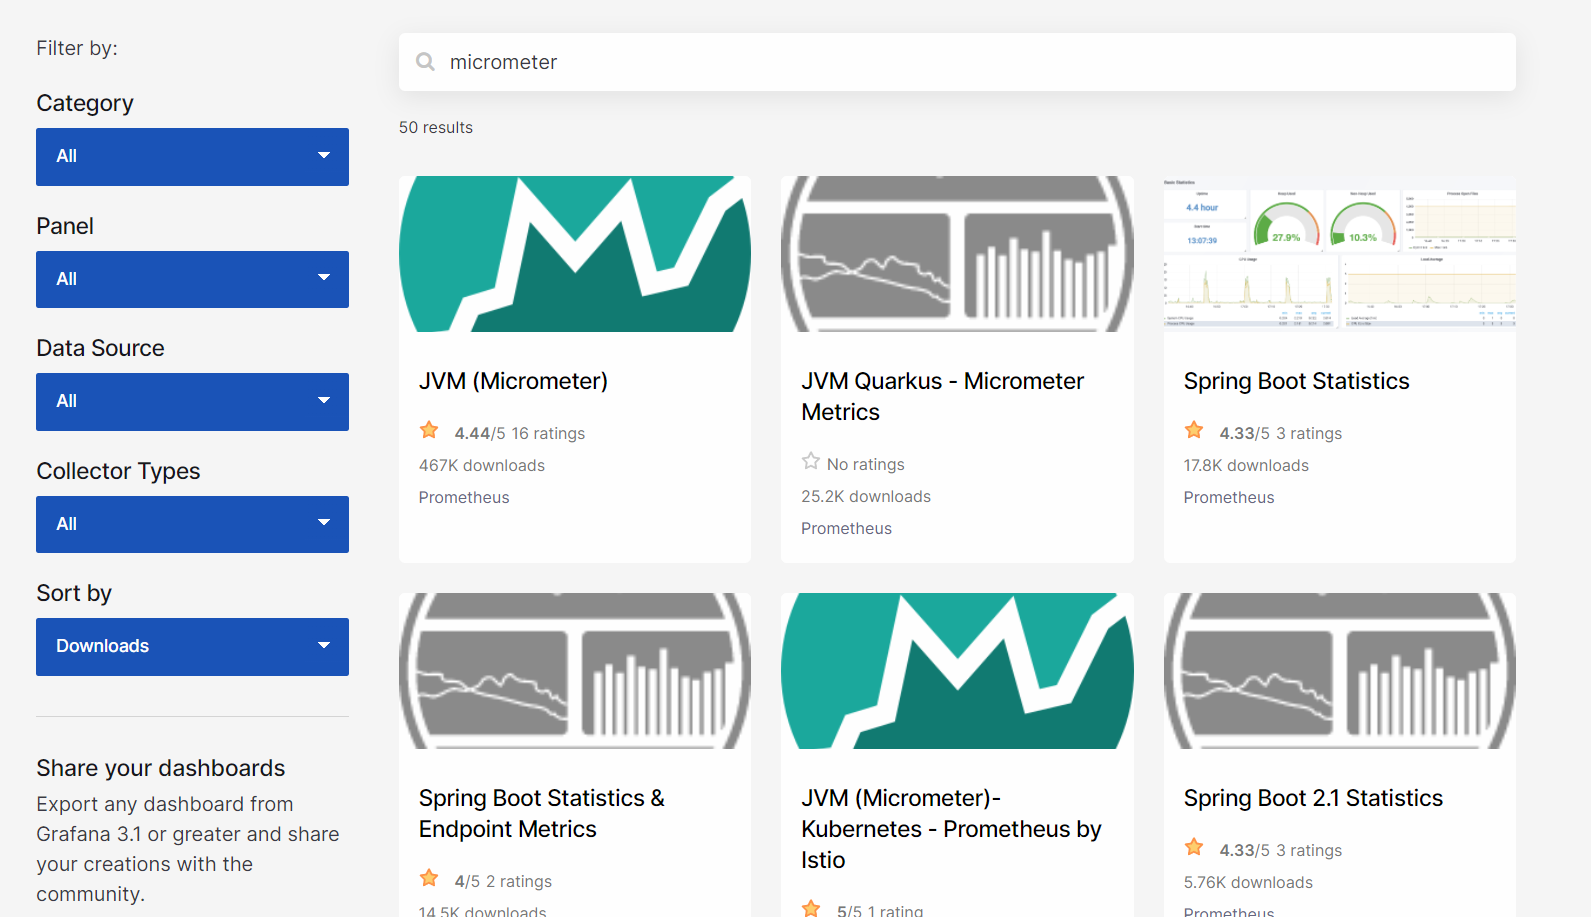
검색 후
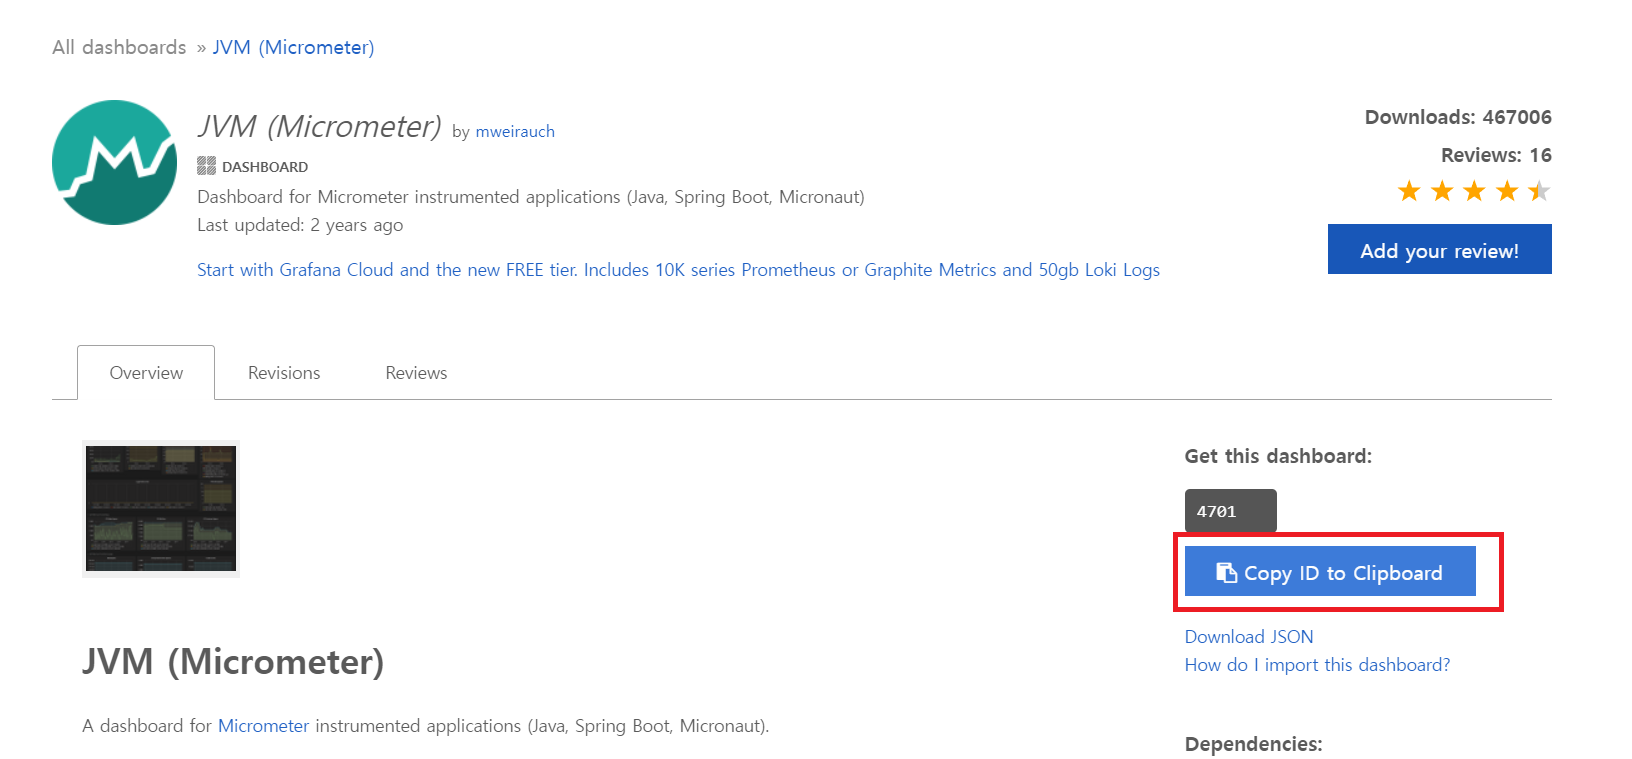
자신이 사용하기 적당한 대시보드를 찾아서 Copy 버튼을 눌러서 ID를 가져와서 바로 사용하면 된다.

붙여주고 Load를 누르면 된다.

그러면 대시보드의 정보를 가져오고 어떤 데이터 소스에 적용할지 선택해주면 된다.
그리고 Prometheus의 정보만 가져오는 대시보드도 있는데
ID 값 3662로 Import해주자
Import 전에 저장하겠냐고 물어보는 알림창이 뜨는데 저장하고 넘어가자
이전 방법과 동일하게 진행하면
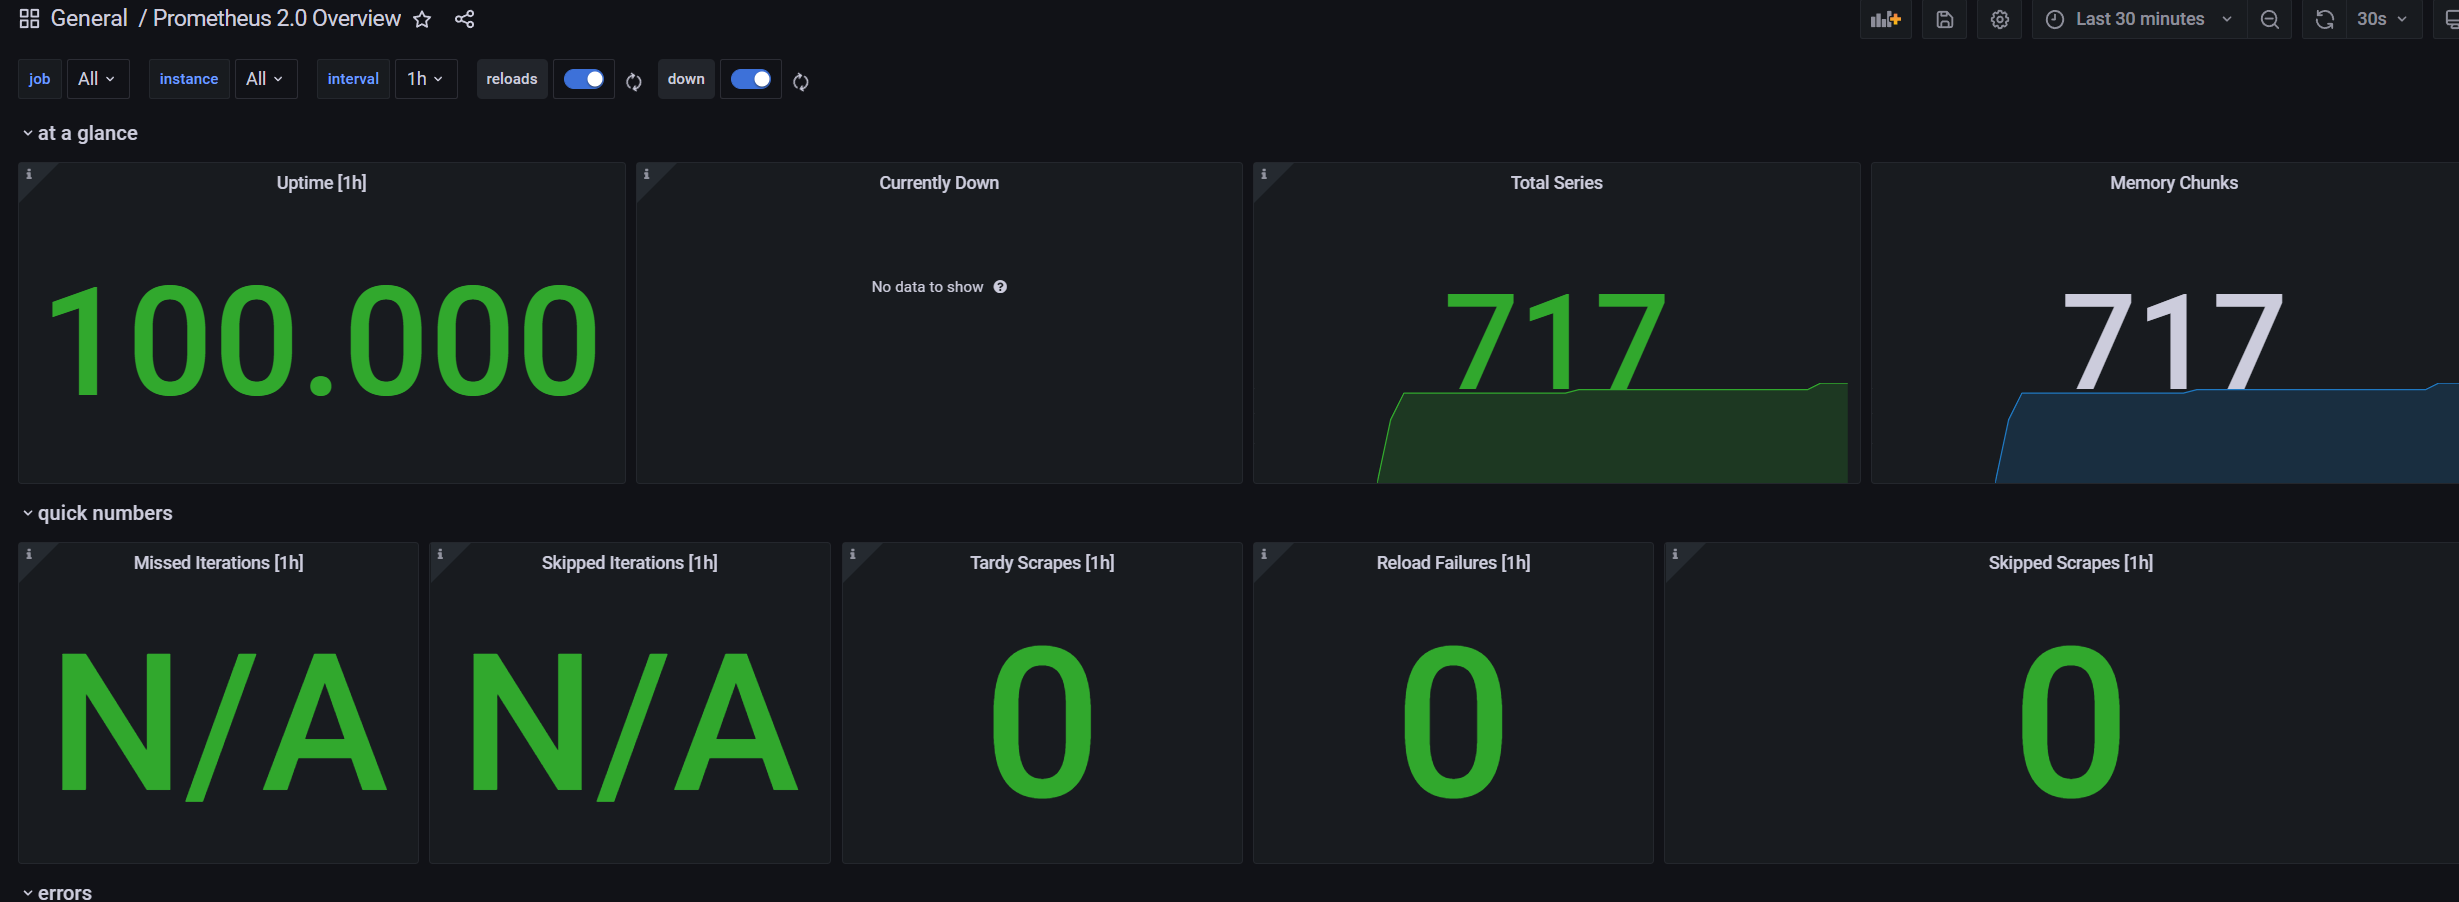
화면을 확인할 수 있다.
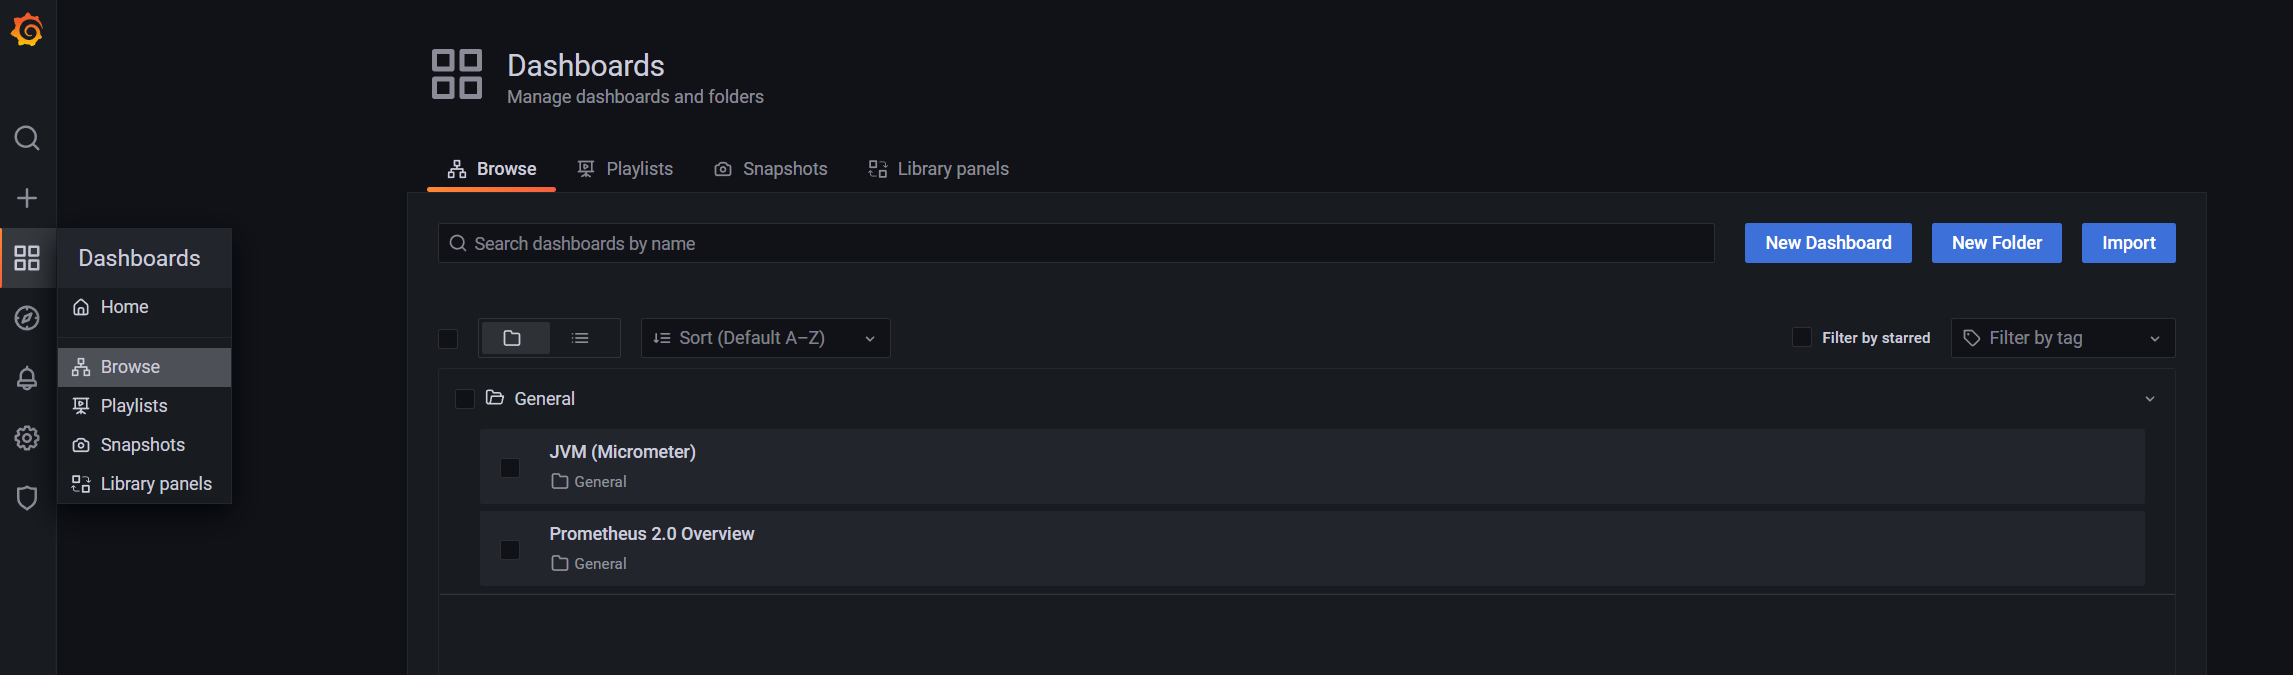
그러면 2개의 대시보드가 등록된 것을 확인할 수 있다.
마지막으로 Spring Cloud Gateway 대시보드를 추가해보자.
ID는 11506이다.
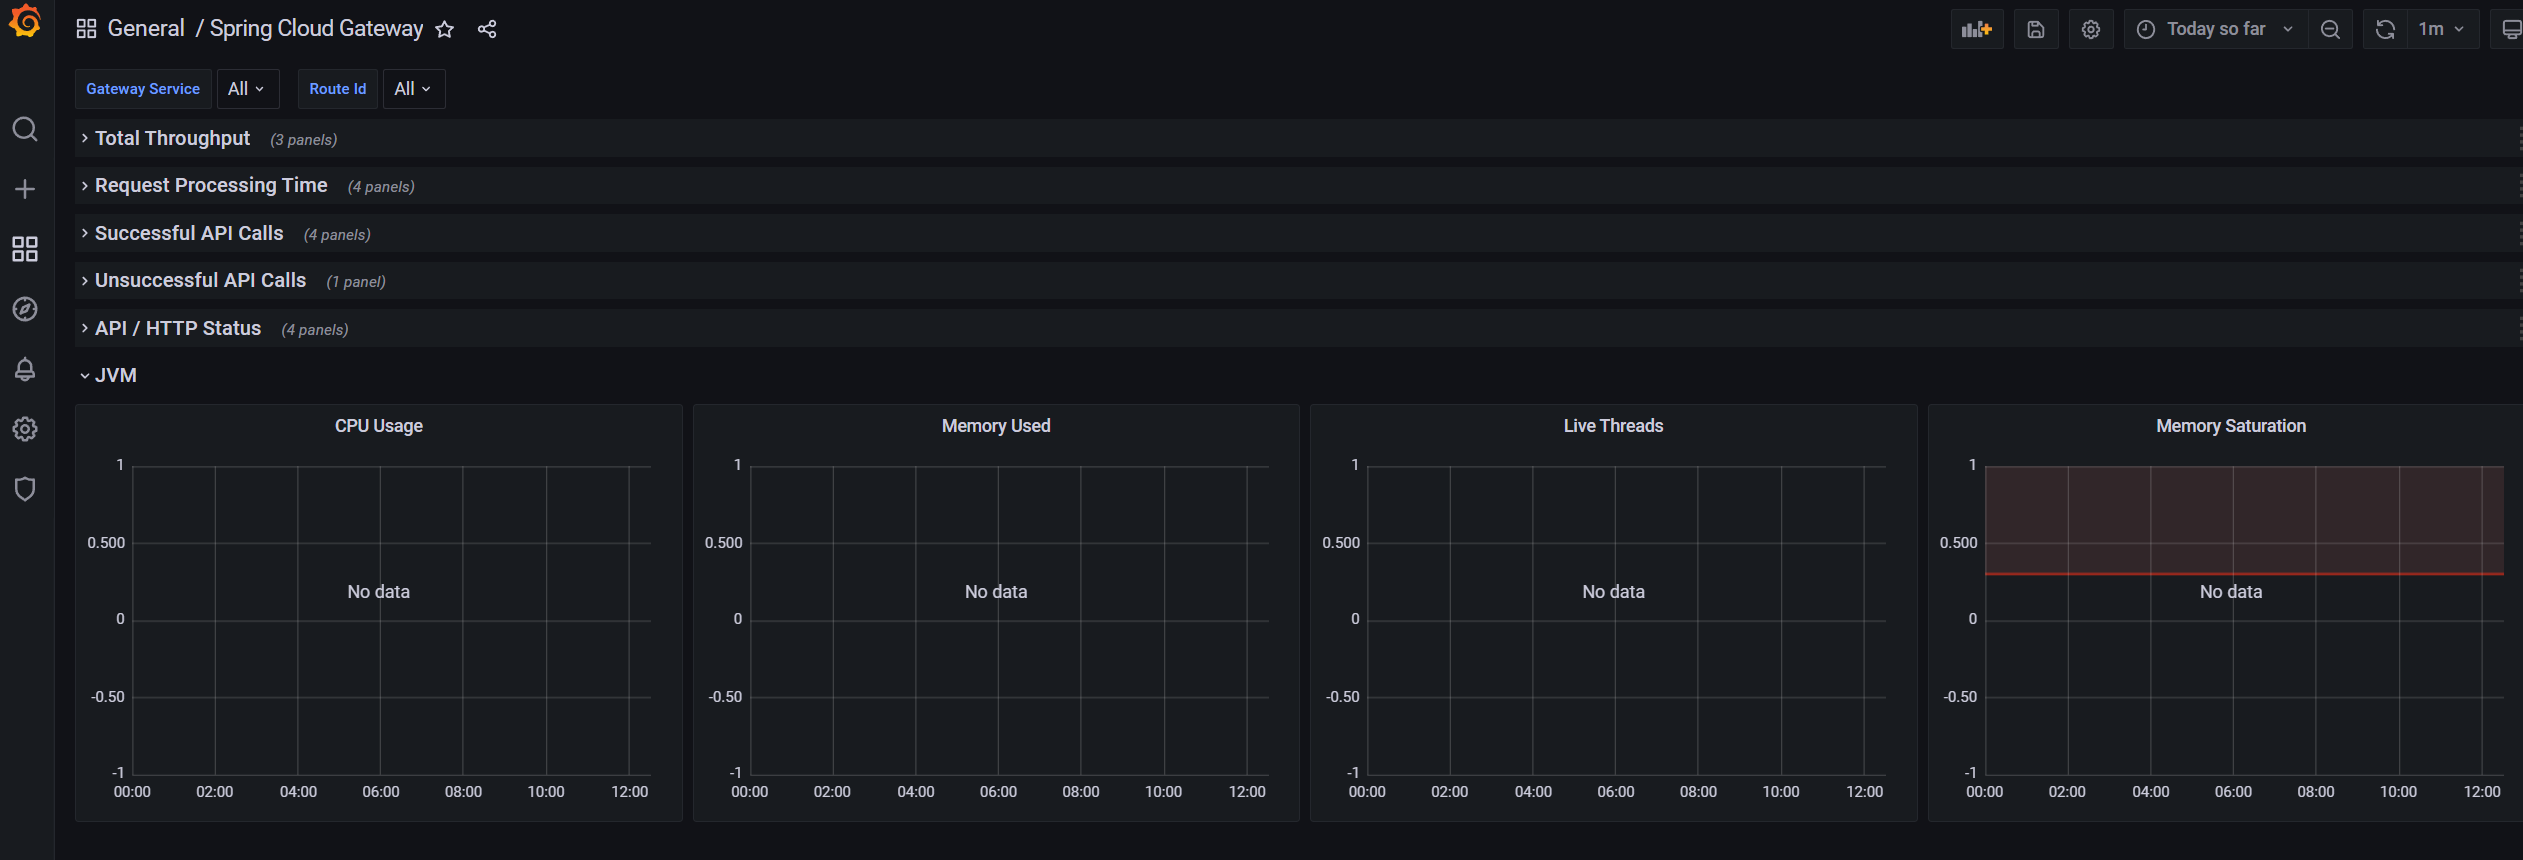
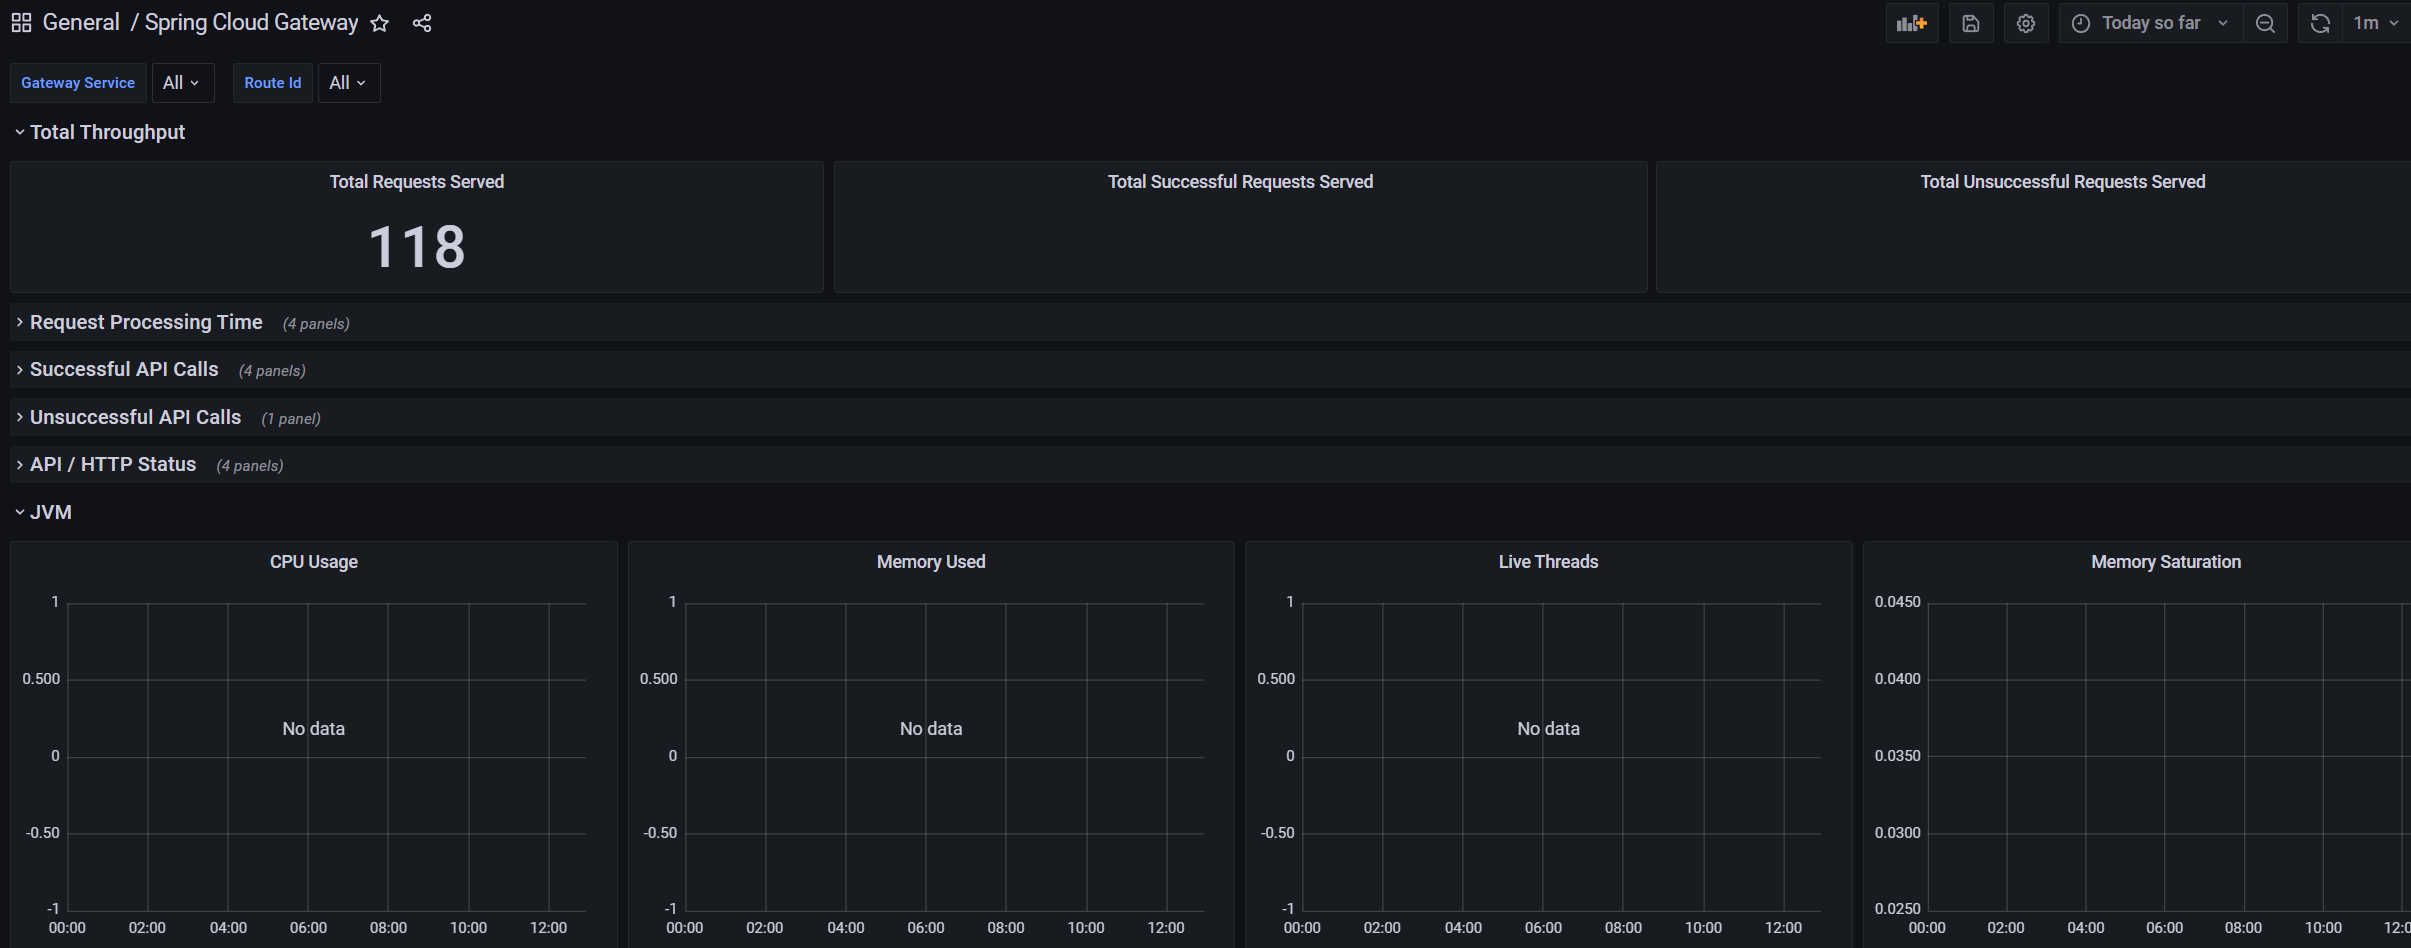
gateway까지 추가된 화면이다.
이제 정보가 모두 No data로 표시되는데 우리 설정이 달라서 그렇다. 설정을 추가해주자.
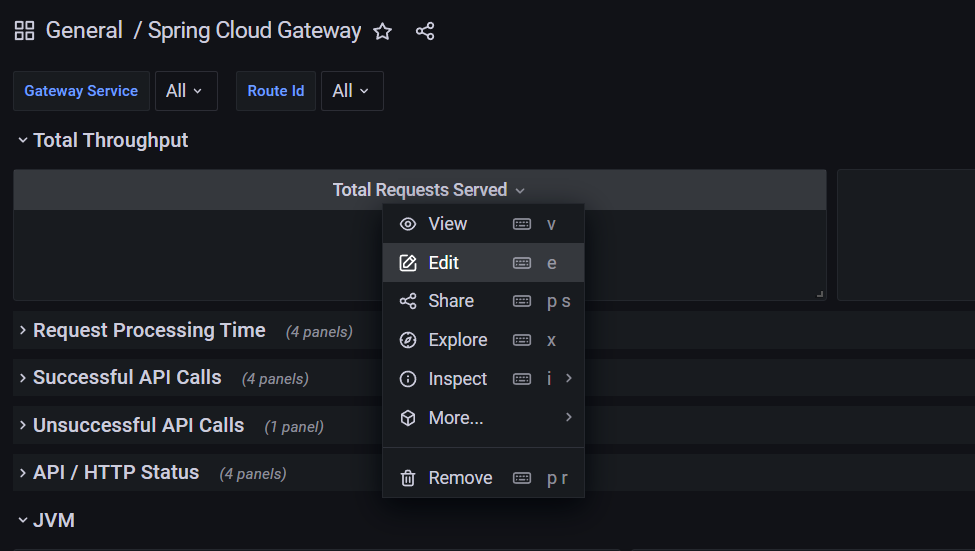
Edit을 눌러서
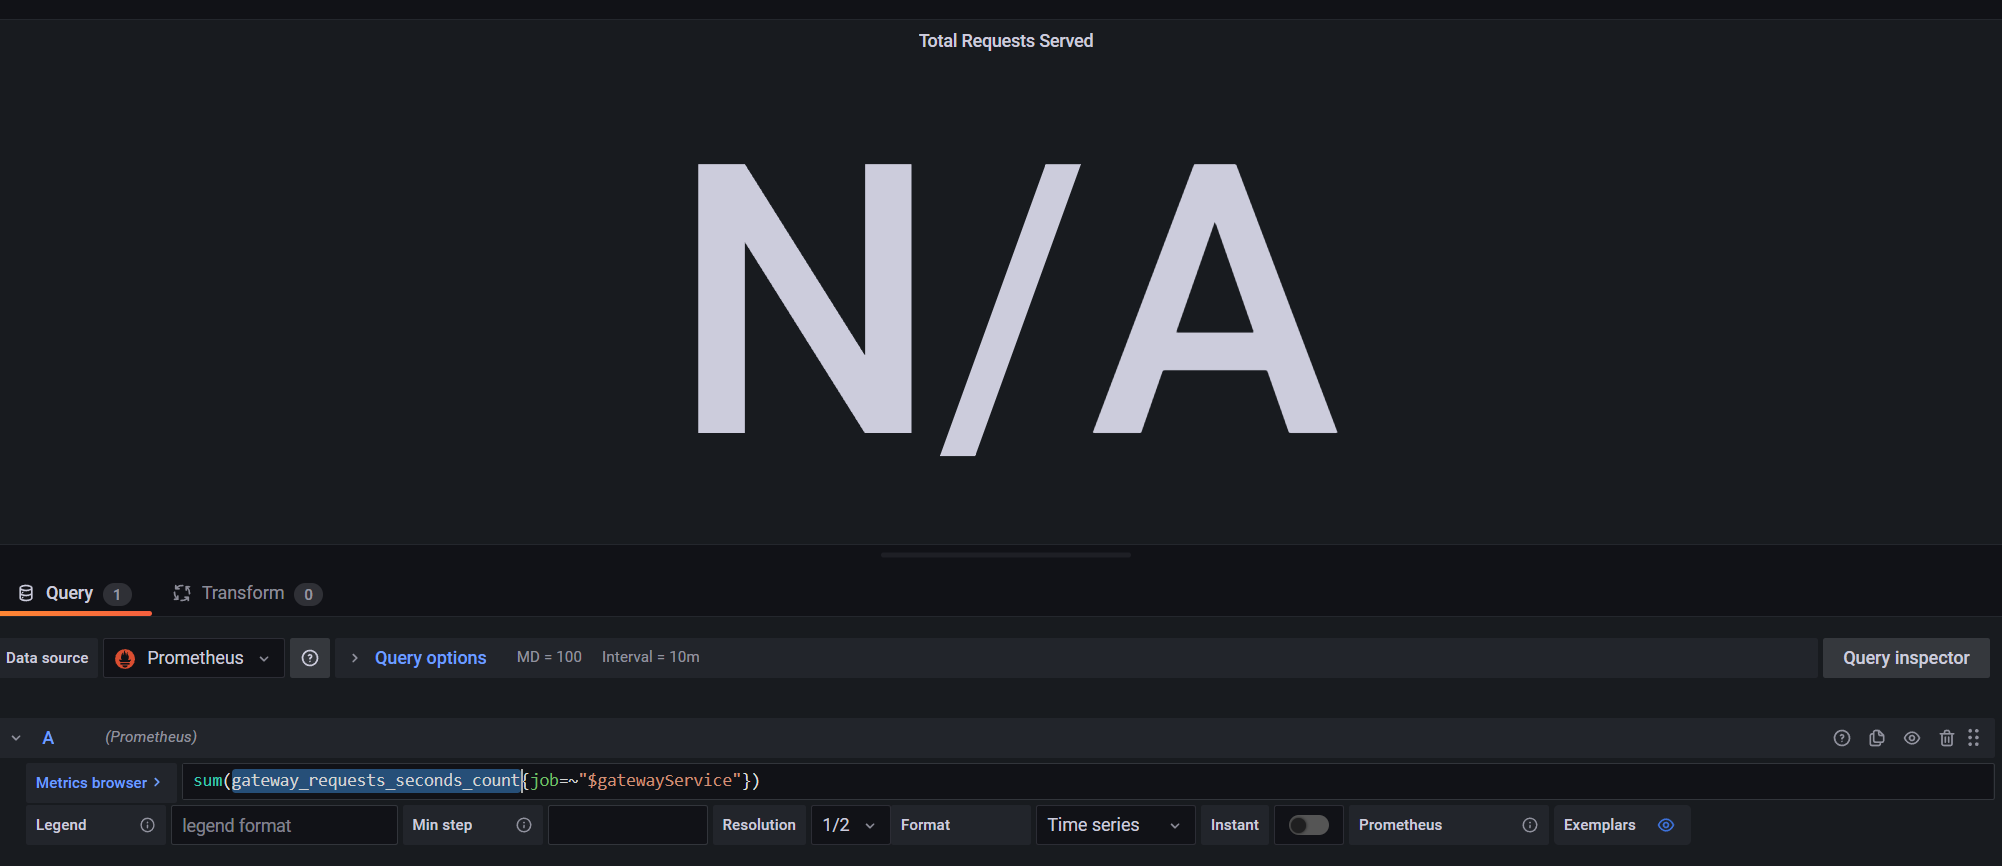
현재 gateway_requests_secounds_count를 기준으로 값을 가져오고 있다. 이걸 prometheus에서 값이 있는지 확인해보자.
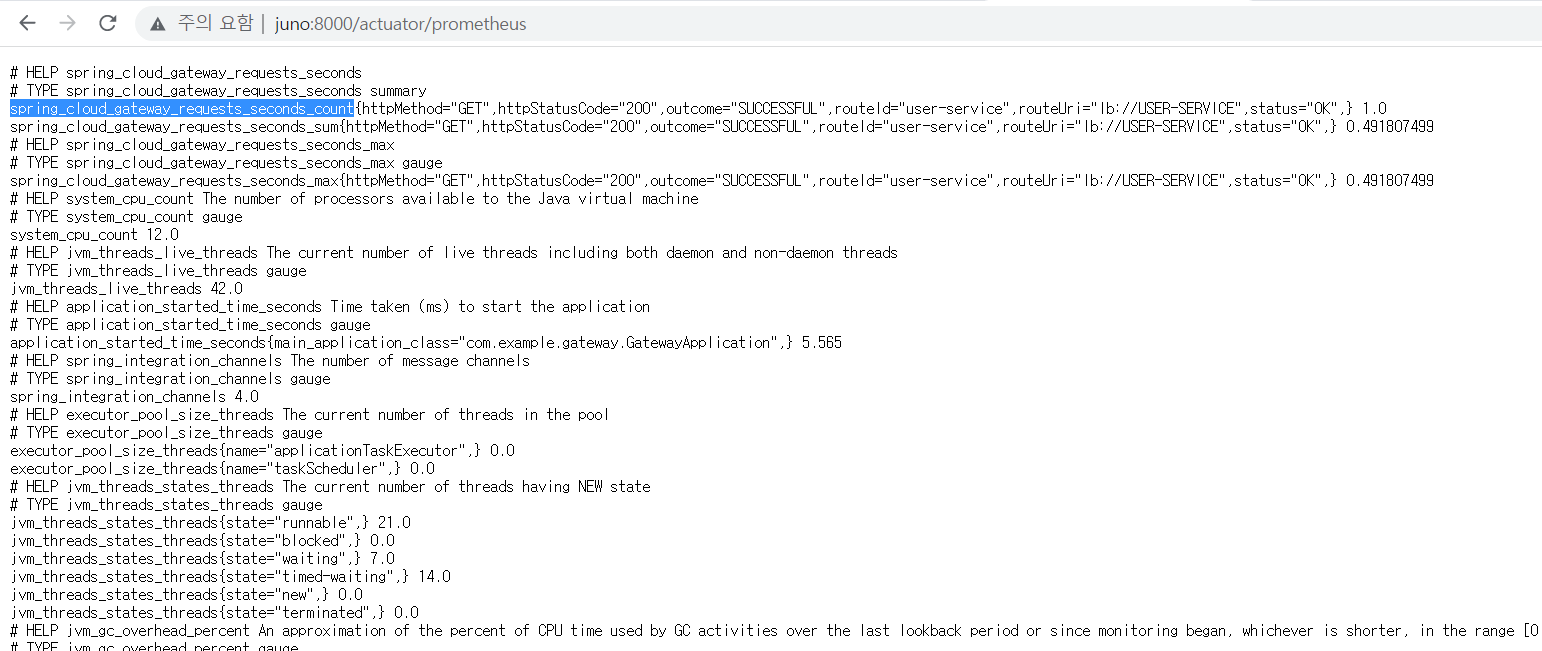

우리의 설정에서는 spring_cloud_gateway_requests_seconds_count 이 값으로 가져오고 있기 때문에 설정의 값을 해당 값으로 변경해줘야한다.

다음과 같이 변경했으며
sum(spring_cloud_gateway_requests_seconds_count{job=~"gateway"})sum(추적이름{job=~"$prometheus등록한job이름"})그 후 상단에 apply를 눌러주면
설정 정보를 확인할 수 있다.
처음에 값이 나오지 않아서 이것저것 세팅을 변경해봐야한다... 대시보드마다 설정이 다른거 같은데 이 부분은 깊게 공부하지 않는 이상 잘 모를거 같다. 인터넷에서 다른 분들이 잘 설명해놓은걸 따라가면서 하는게 나을거 같다.
이 부분에서 우리가 학습하고 넘어갈 부분은 대시보드를 가져와서 각 설정을 변경해 줄수 있다는 점을 확인하고 가면 좋을것 같다!