Prometheus란?
-
메트릭 수집, 시각화, 알림, 서비스 디스커버리 기능을 모두 가지고 있는 오픈소스 모니터링 툴이다.
-
시계열 데이터 수집하고 저장하는 데 사용된다. 이 값은 레이블이라는 Key-Value 쌍으로 타임스탬프와 함께 저장되어 시계열 데이터가 형상화된다.
-
지금은 독립형 오픈소스 프로젝트이며 많은 회사들이 사용 하고 있고, 또한 kubernetes에서도 Prometheus를 사용하여 매트릭 수집 및 대시보드 구축하는 방식을 장려하고 있다.
시계열 데이터란 일정한 시간 동안 수집 된 일련의 순차적으로 정해진 데이터 셋의 집합입니다. 시계열 데이터의 특징으로는 시간에 관해 순서가 매겨져 있다는 점과, 연속한 관측치는 서로 상관관계를 갖고 있습니다.Grafana란?
- Grafana Labs가 개발한 오픈소스 인터랙티브 데이터 시각화 플랫폼으로, 사용자가 하나의 대시보드(또는 여러 대시보드)로 통합된 차트와 그래프를 통해 데이터를 확인할 수 있어 데이터를 손쉽게 해석하고 이해할 수 있습니다.
- 또한 기존의 서버 환경, 쿠버네티스 클러스터 또는 다양한 클라우드 서비스 등 정보가 저장되어 있는 모든 위치에서 확보한 메트릭과 정보에 대한 쿼리를 작성하고 경고를 설정할 수 있습니다.
- 시계열 매트릭 데이터를 시각화 하는데 가장 최적화된 대시보드를 제공해주는 오픈소스 툴킷이다.
- 다양한 DB를 연결하여 DB의 데이터를 가져와 시각화 할 수 있으며, 그래프를 그리는 방법도 간단히 마우스 클릭으로 완료할 수 있다.
Prometheus 의 주요 기능
- 풀 방식의 메트릭 수집, 시계열 데이터 저장
- PromQL을 활용하여 저장된 시계열을 쿼리 및 집계
- 서비스 디스커버리
- 데이터 시각화
Prometheus의 아키텍쳐
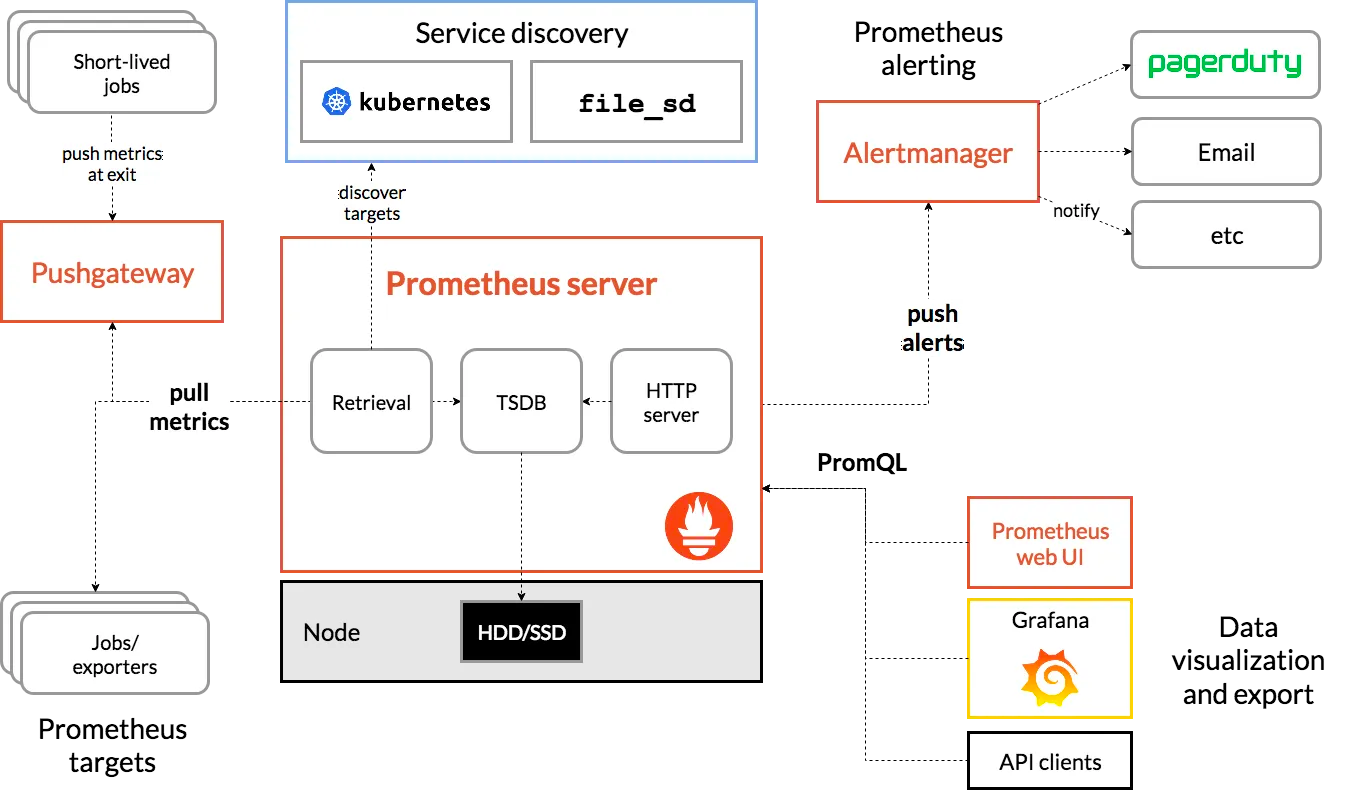
- Jobs/exporters는 실제로 매트릭을 수집하는 프로세스라고 보면 된다.
- 이 exporter가 매트릭을 수집하고 HTTP 통신을 통해 매트릭 데이터를 가져갈 수 있게 /metrics 라는 HTTP 엔드포인트를 제공한다.
- 그러면 Prometheus server가 이 exporter의 엔드포인트로 HTTP GET 요청을 날려 매트릭 정보를 수집(Pull)한다.
- 수집한 정보를 Prometheus가 제공하는 간단한 웹 뷰를 통해 조회할 수 있고 그 안에서 테이블 및 그래프 형태로 볼 수 있다.
- 하지만 시각화 도구가 부족해서 이를 직접 사용하지는 않고 대게 Grafana라는 Data Visualization tool을 이용하여 시각화하고 있다.
Prometheus 설치 방법
- docker-compose.yml 파일과 prometheus.yml 파일을 작성 후 명령어 실행
- prometheus 와 grafana 구동
docker-compose up -d- docker-compose.yml
version: '2.14.0'

services:

  prometheus:
    container_name: prometheus
    image: 'prom/prometheus:latest'
    user: root
    volumes:
      - ./prometheus.yml:/etc/prometheus/prometheus.yml
    ports:
      - '9090:9090'
    networks:
      - monitor-net
    restart: unless-stopped

  grafana:
    container_name: grafana
    image: 'grafana/grafana:latest'
    environment:
      - GF_SECURITY_ADMIN_USER=admin
      - GF_SECURITY_ADMIN_PASSWORD=admin
      - GF_USERS_ALLOW_SIGN_UP=false
    ports:
      - '3000:3000'
    depends_on:
      - prometheus
    networks:
      - monitor-net
    restart: unless-stopped

networks:
  monitor-net:
    name: monitor-net
driver: bridge- prometheus.yml
# 기본적인 전역 설정
global:
  scrape_interval: 15s # 15초마다 매트릭을 수집 default 1분
  evaluation_interval: 1m # 1분마다 규칙을 평가 default 1분

  external_labels: # 외부 시스템에 표시할 이 서버의 레이블
    monitor: 'jinhyung-monitor'

scrape_configs:
  - job_name: 'monitoring-app' # 잡 이름
    metrics_path: '/actuator/prometheus' # 메트릭을 수집할 path 설정
    static_configs:
- targets: [ 'host.docker.internal:8080' ] # 도커 인스턴스 내부 호스트:8080-
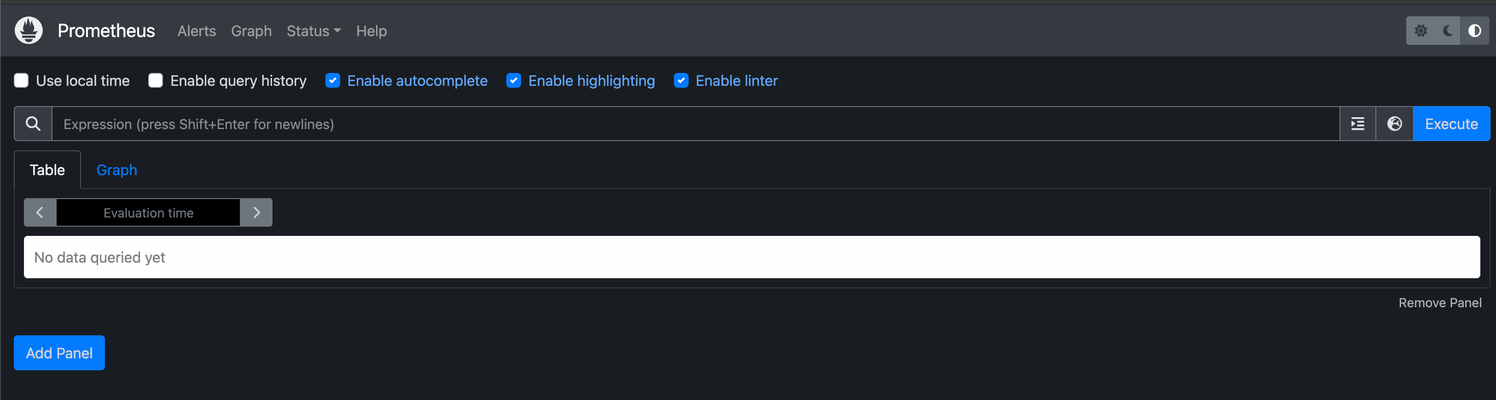
prometheus 콘솔 접속
- 정상 접속 확인 : http://localhost:9090/
- 아래처럼 화면이 보인다면 정상 구동
-
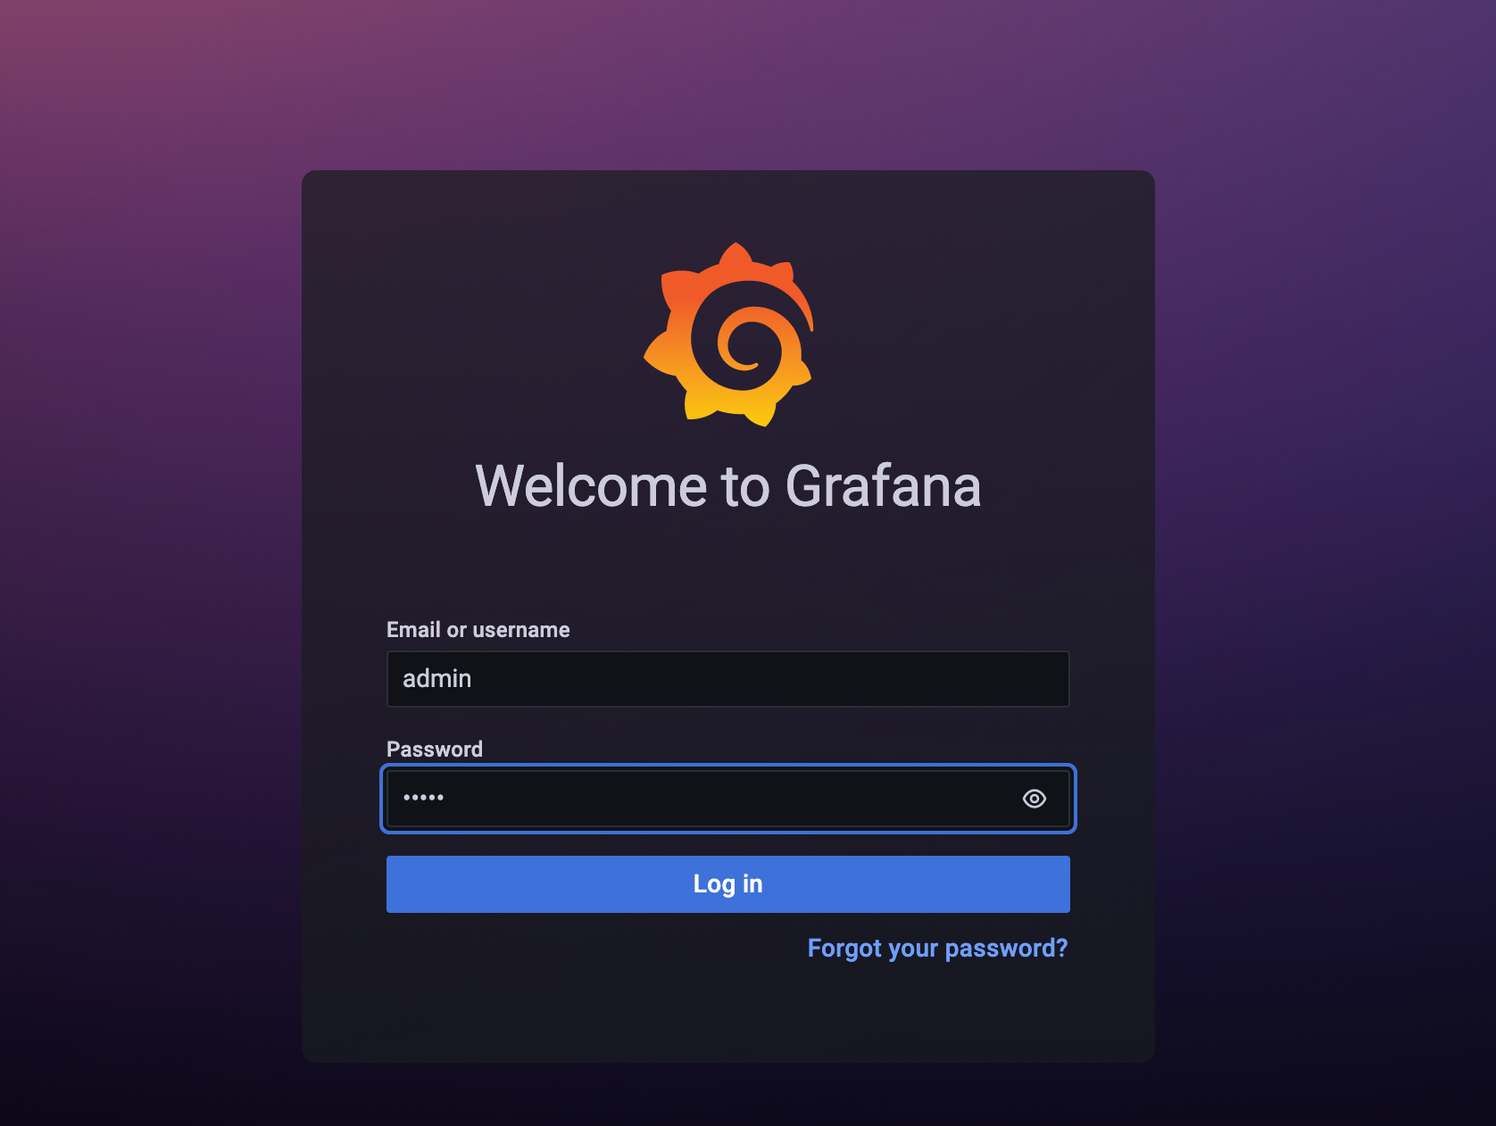
grafana dashboard 접속
- 정상 접속 확인 : http://localhost:3000/login
- 로그인 계정 : admin / admin
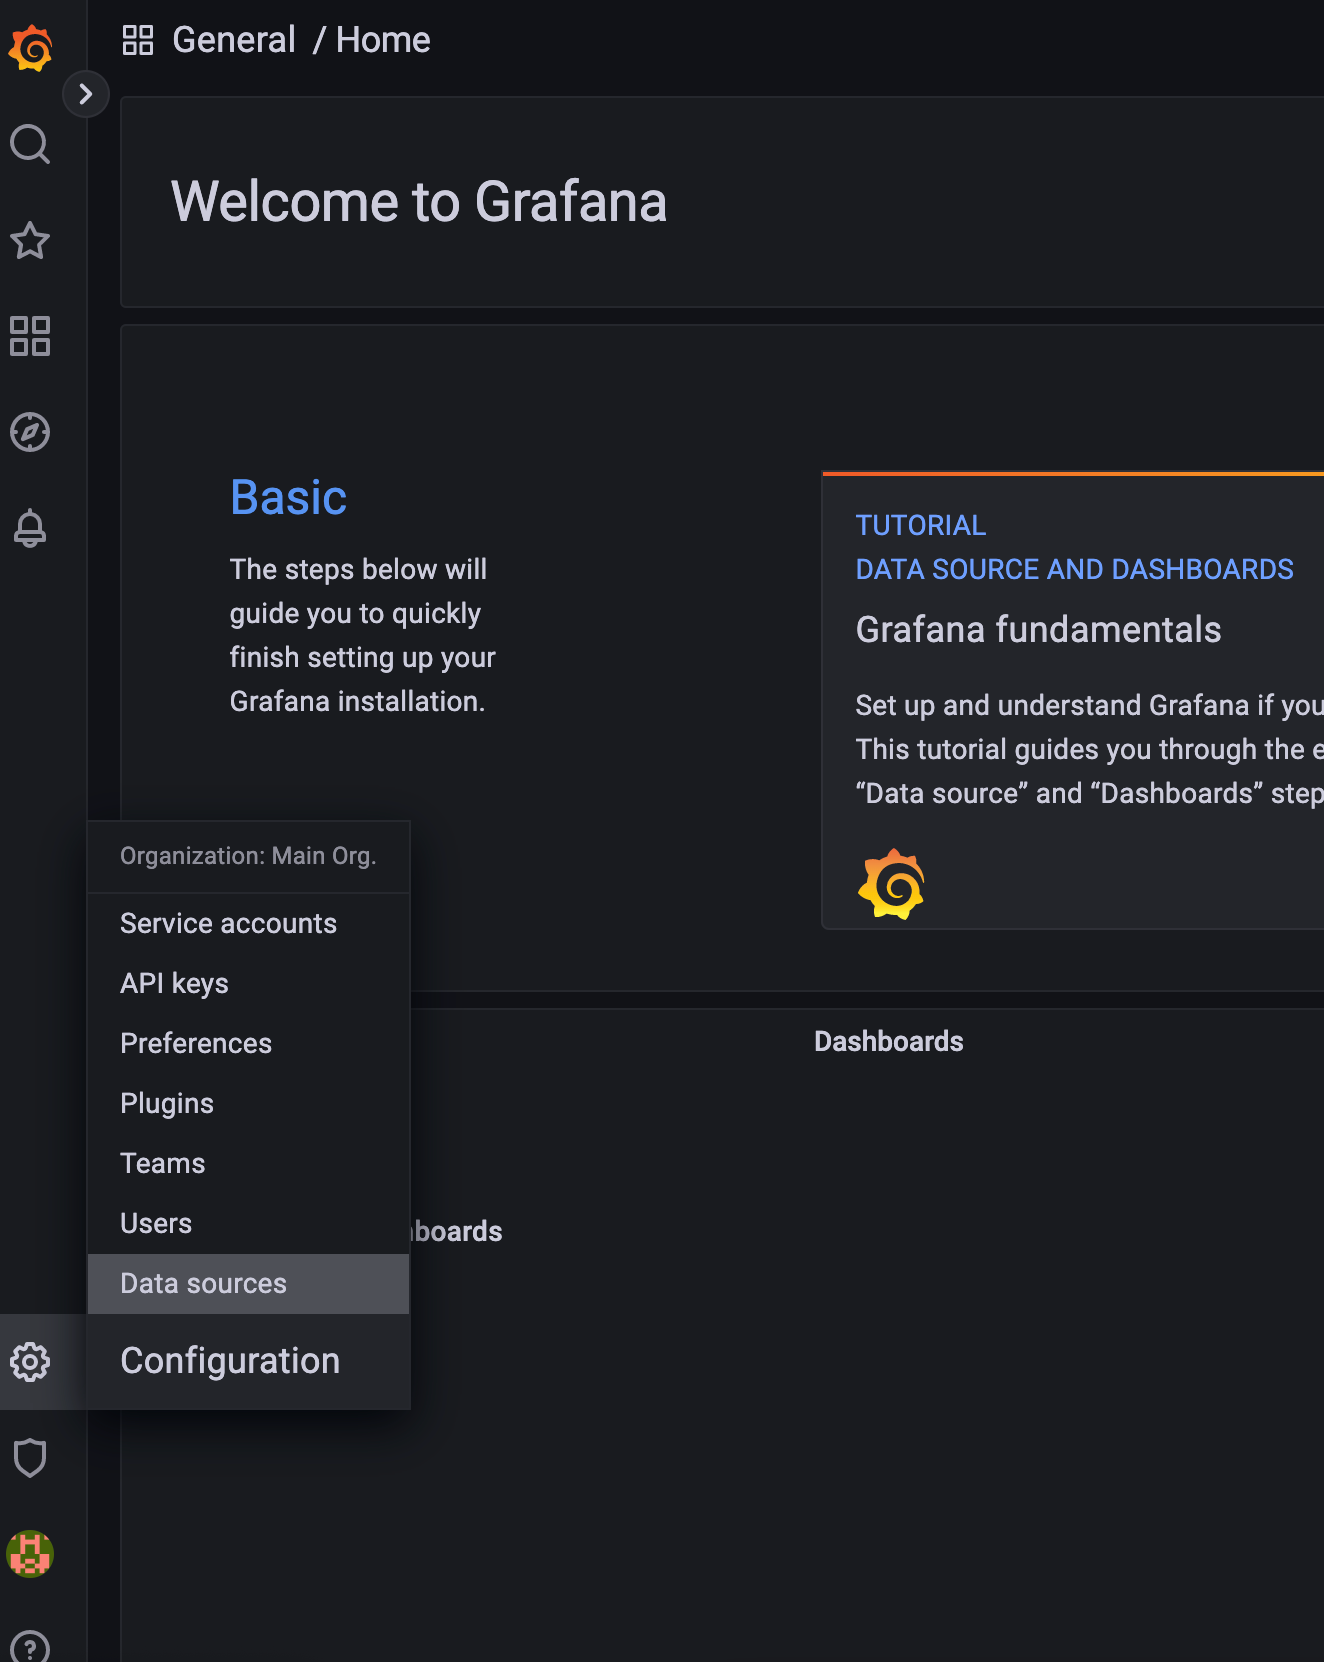
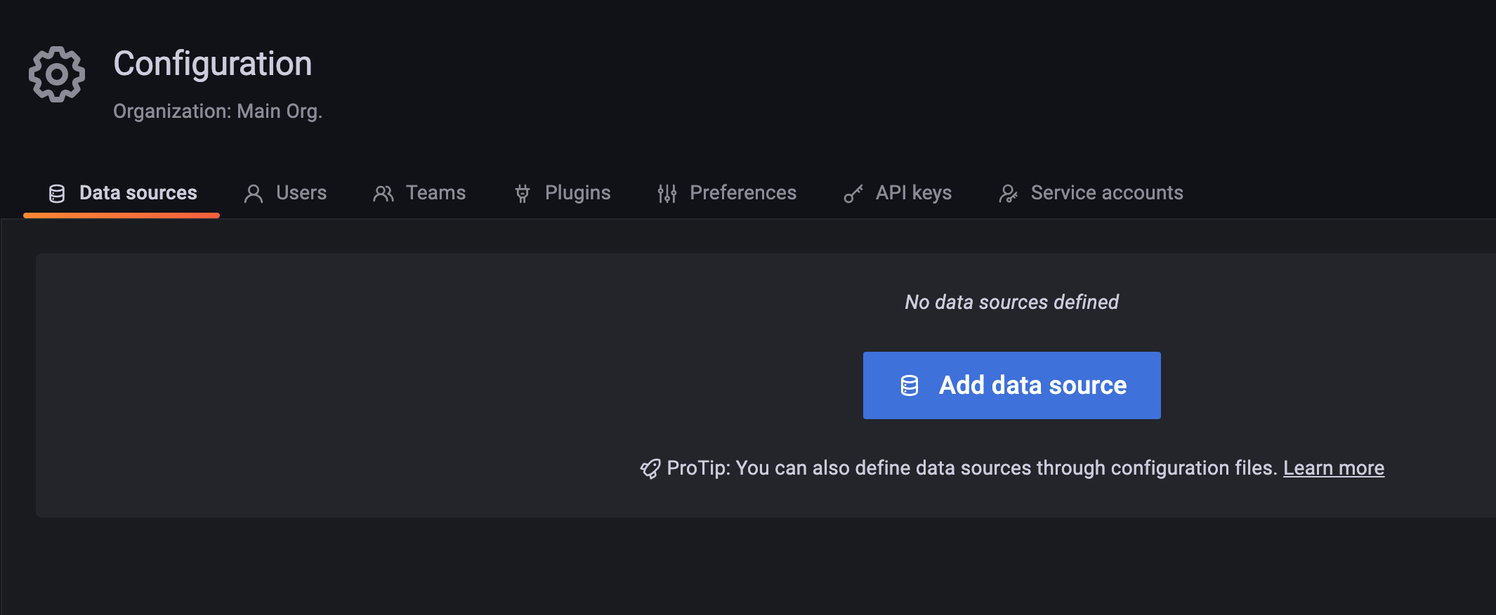
- [Configuration] - [Data sources] 클릭
- [Add data source] 클릭
- [Prometheus] 클릭
- HTTP - URL : http://prometheus:9090 입력 후 가장 하단에 [Save & test] 클릭
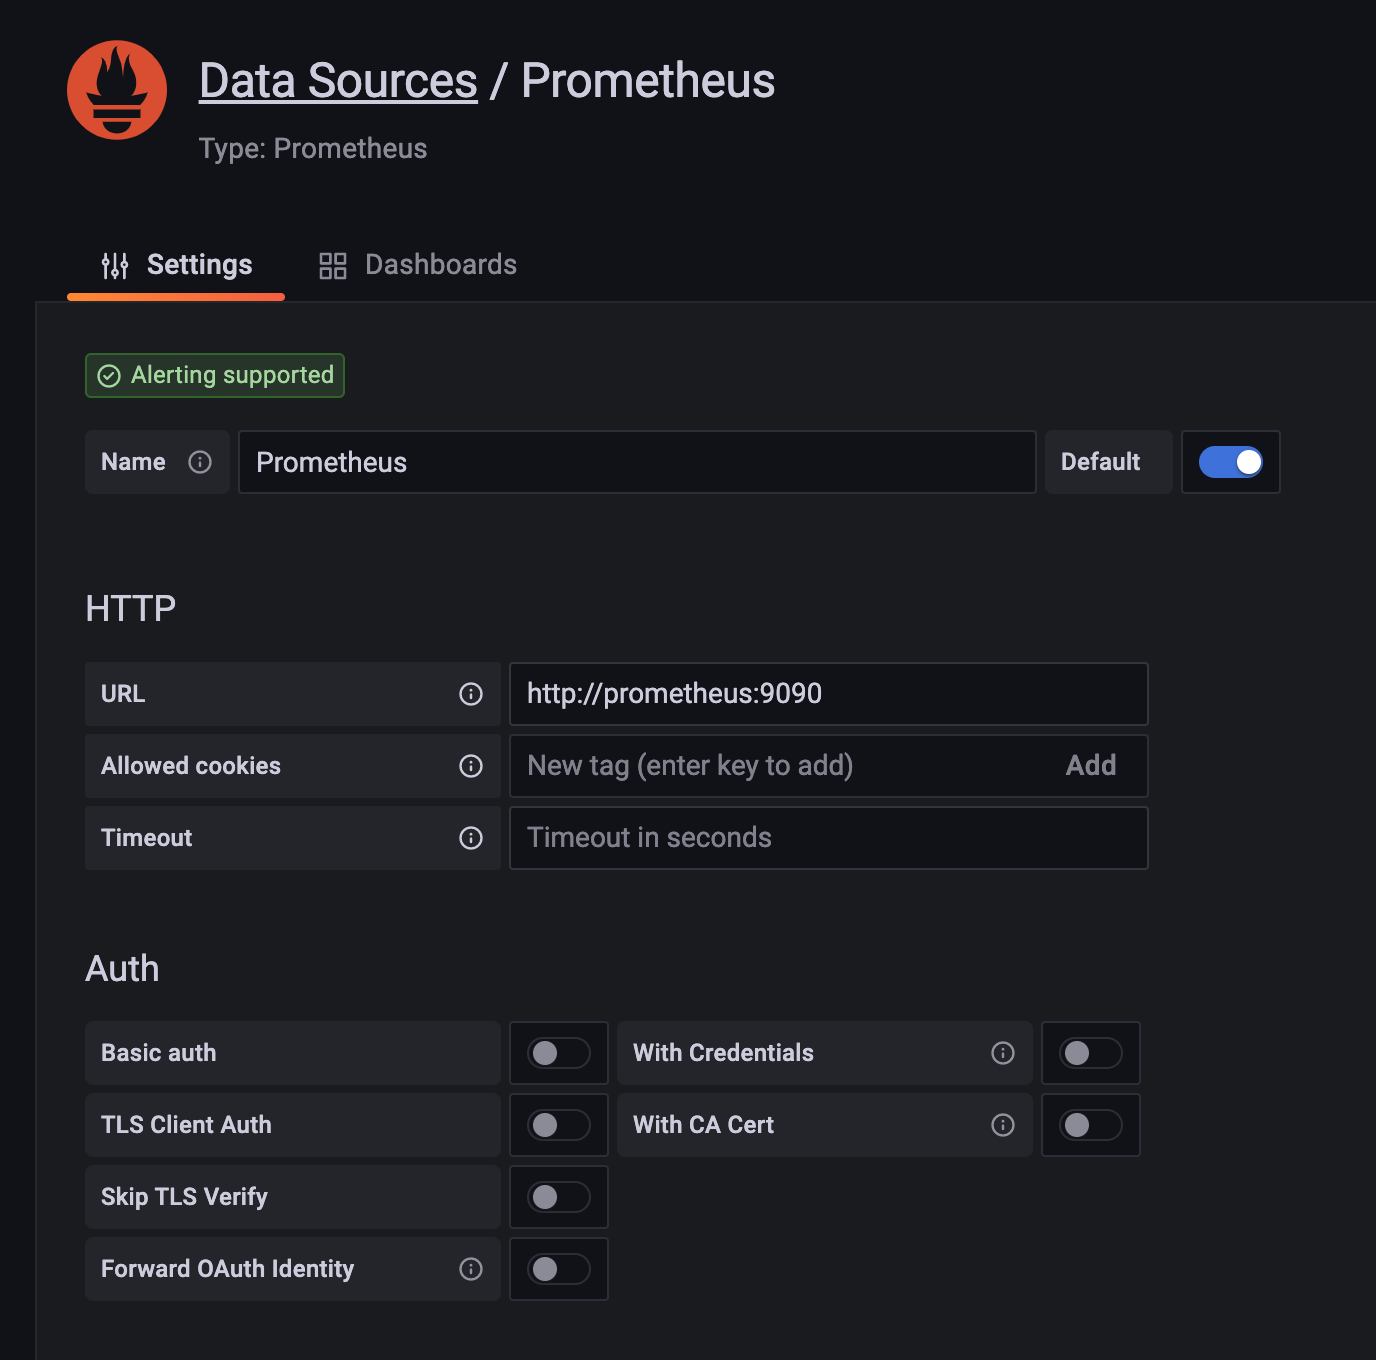
- HTTP - URL : http://prometheus:9090 입력 후 가장 하단에 [Save & test] 클릭
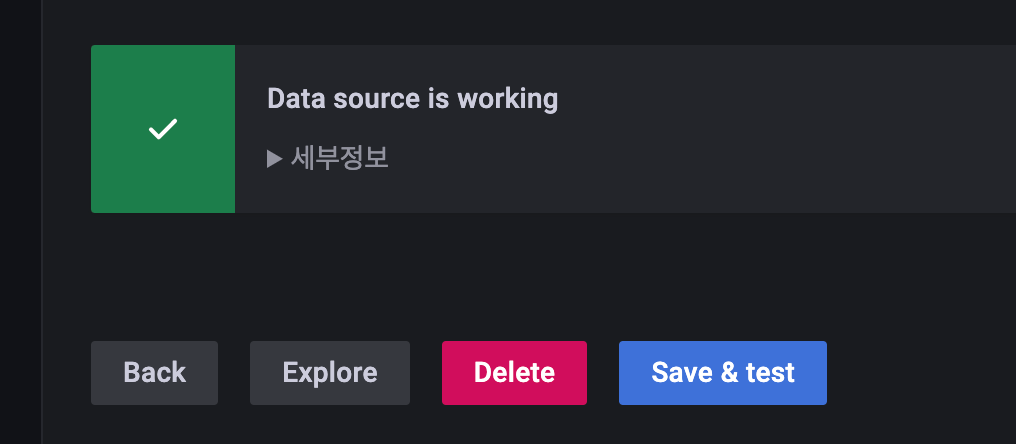
- 정상적으로 연결되었다면 [Data source is working] 이라는 문구가 나옴
Springboot 연동 방법
- dependency 추가
<dependency>
    <groupId>org.springframework.boot</groupId>
    <artifactId>spring-boot-starter-actuator</artifactId>
</dependency>
<dependency>
    <groupId>io.micrometer</groupId>
    <artifactId>micrometer-core</artifactId>
</dependency>
<dependency>
    <groupId>io.micrometer</groupId>
    <artifactId>micrometer-registry-prometheus</artifactId>
</dependency>- Actuator 설정 (applications.yml)
management:
  endpoint:
    metrics:
      enabled: true
    prometheus:
      enabled: true

  endpoints:
    web:
      exposure:
        include: health, info, metrics, prometheus

  metrics:
    tags:
application: ${spring.application.name}-
application 구동
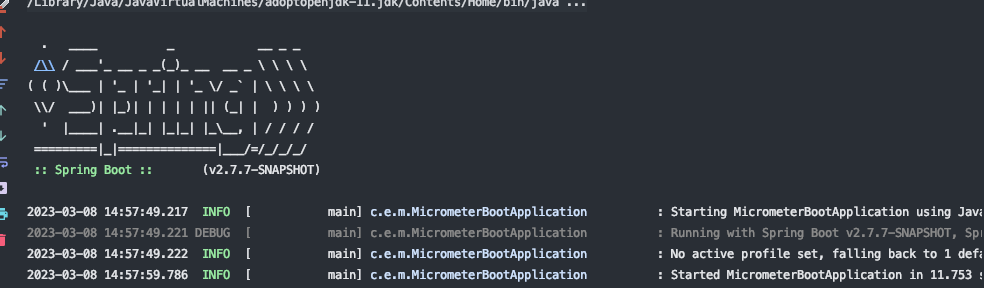
-
Actuator 확인
- http://localhost:8080/actuator 접속 후 아래처럼 json response 가 반환되는지 확인
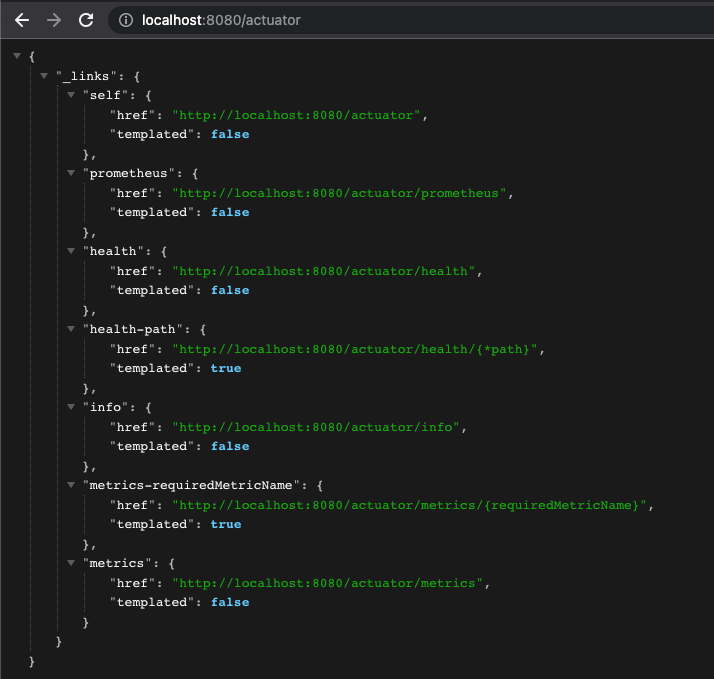
- http://localhost:8080/actuator 접속 후 아래처럼 json response 가 반환되는지 확인
-
prometheus metric 확인
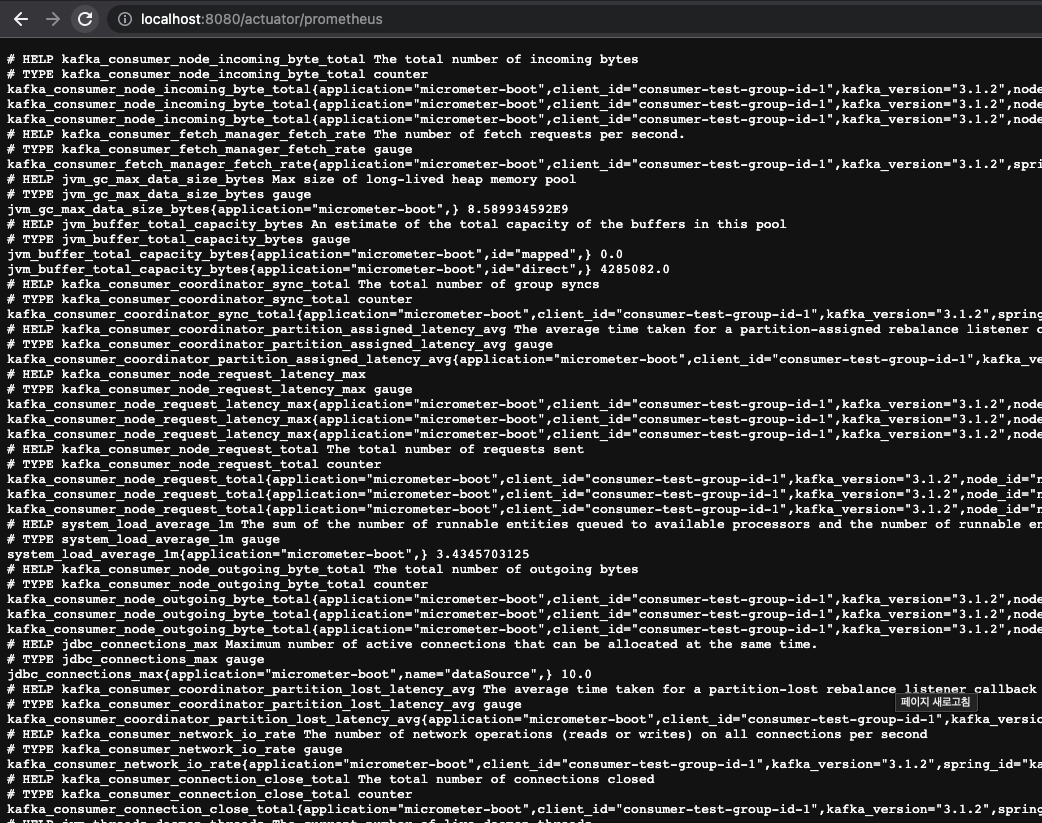
Metric 확인
-
prometheus 콘솔에서 “jvm_memory_used_bytes” 입력 후 [Execute] 클릭
- 보기 어렵다…
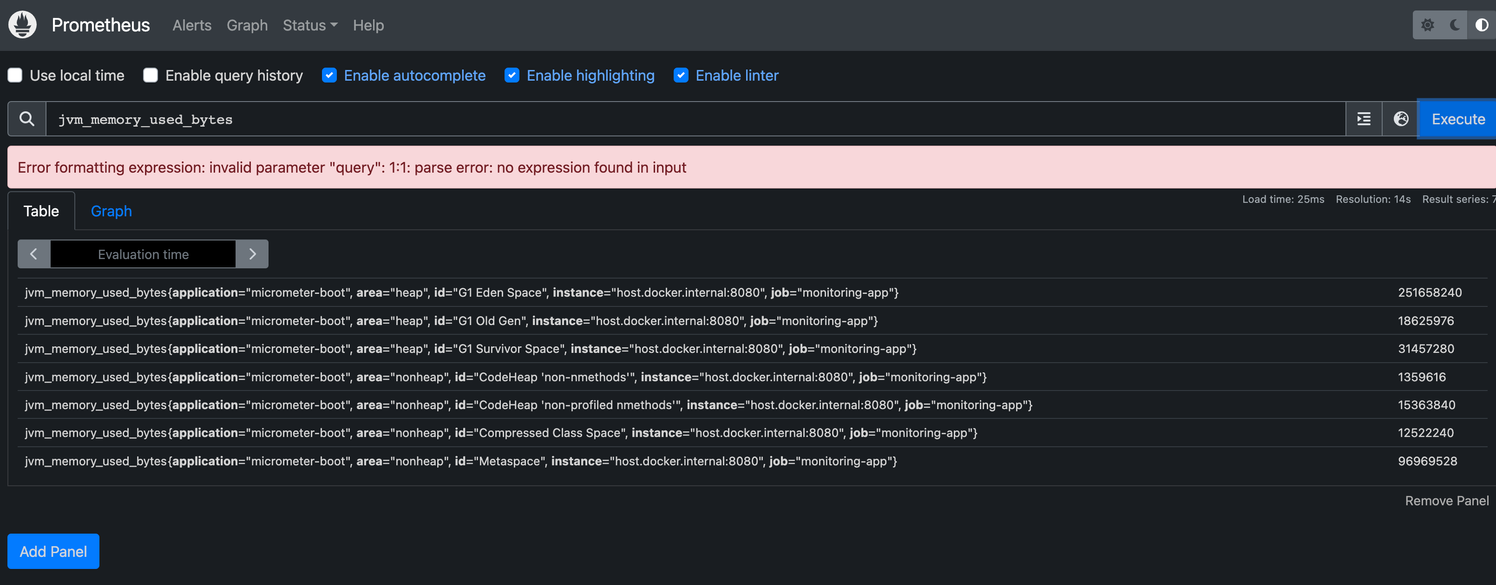
- 보기 어렵다…
-
Grafana 콘솔에서 “jvm_memory_used_bytes” 선택 후 [Run query] 클릭
- 그래도 보기 어렵다…
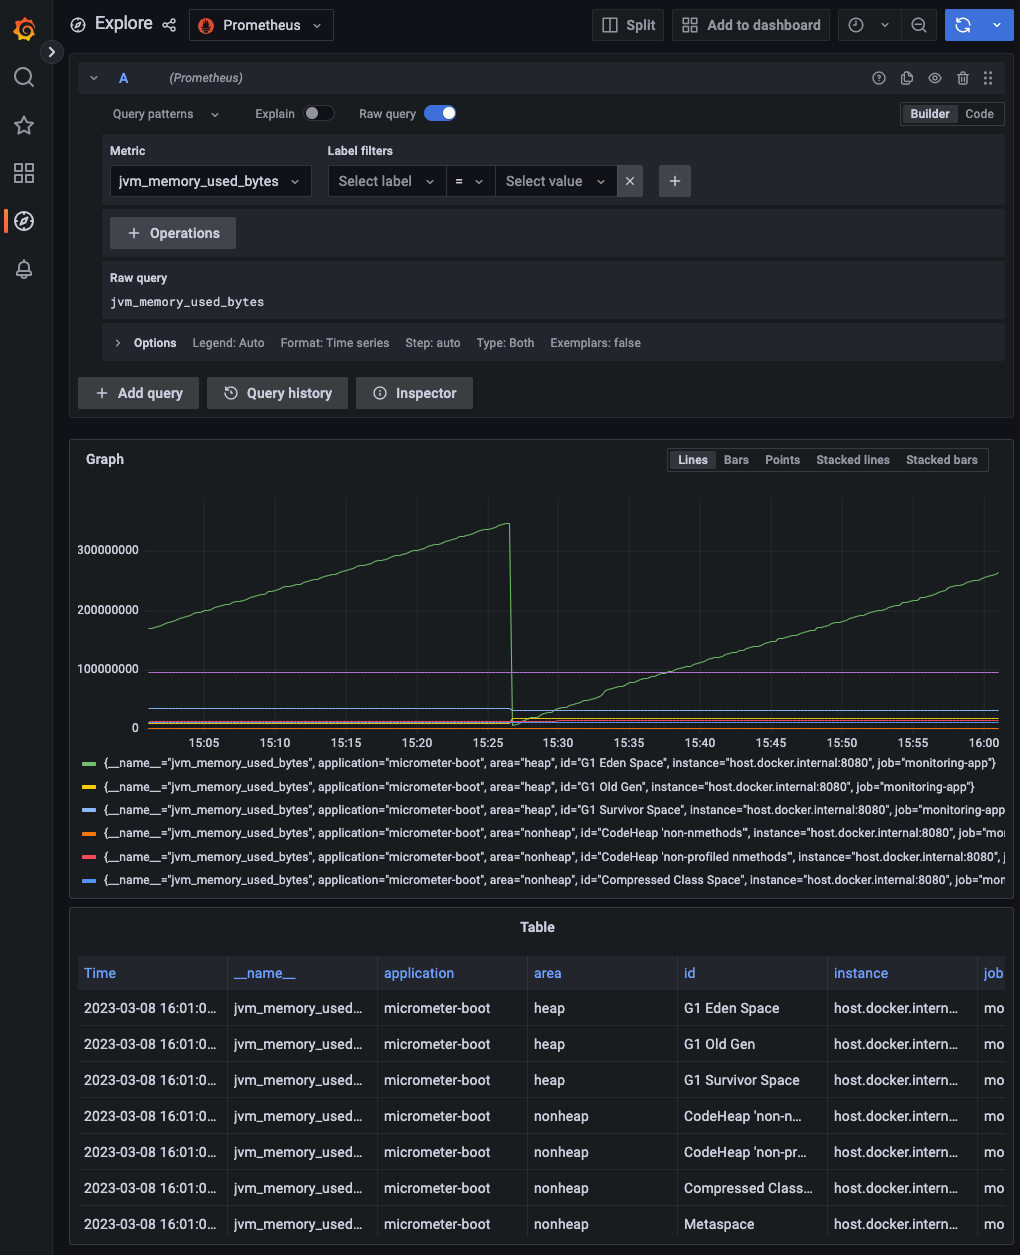
- 그래도 보기 어렵다…
Dashboard 만들기
-
springboot 검색 후 마음에 드는 template 클릭
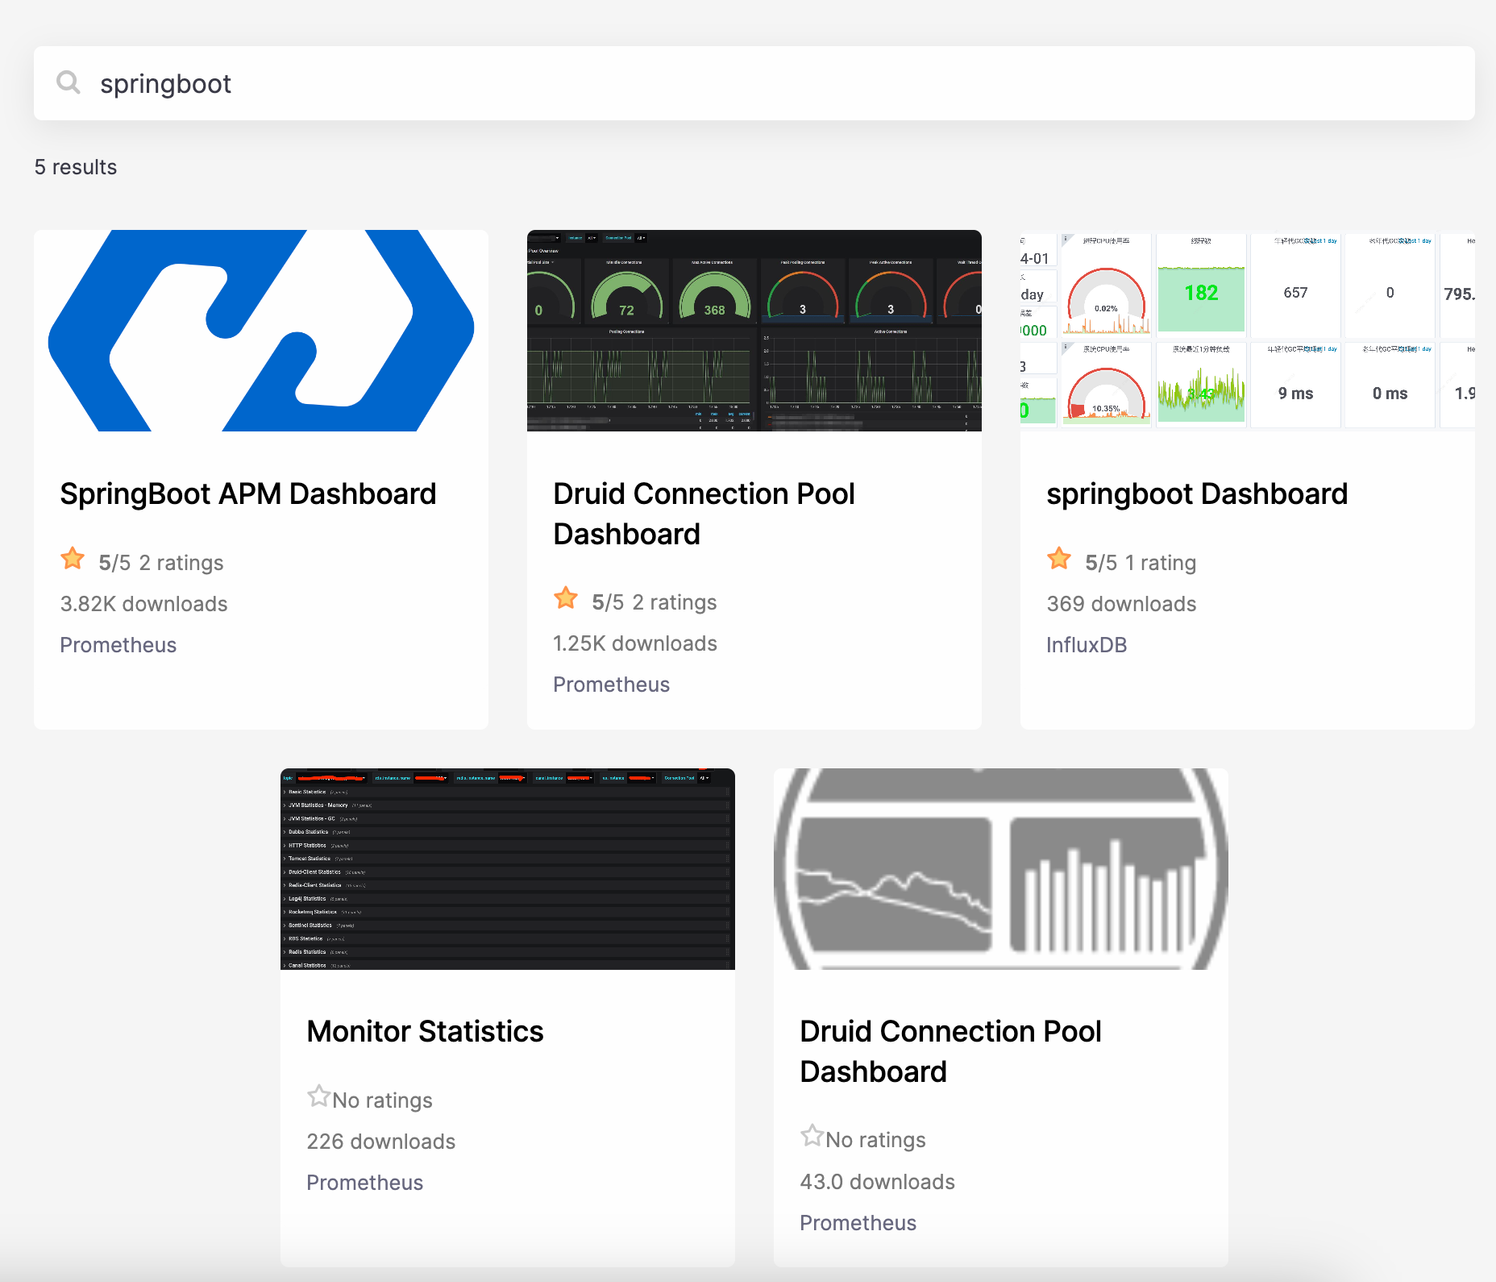
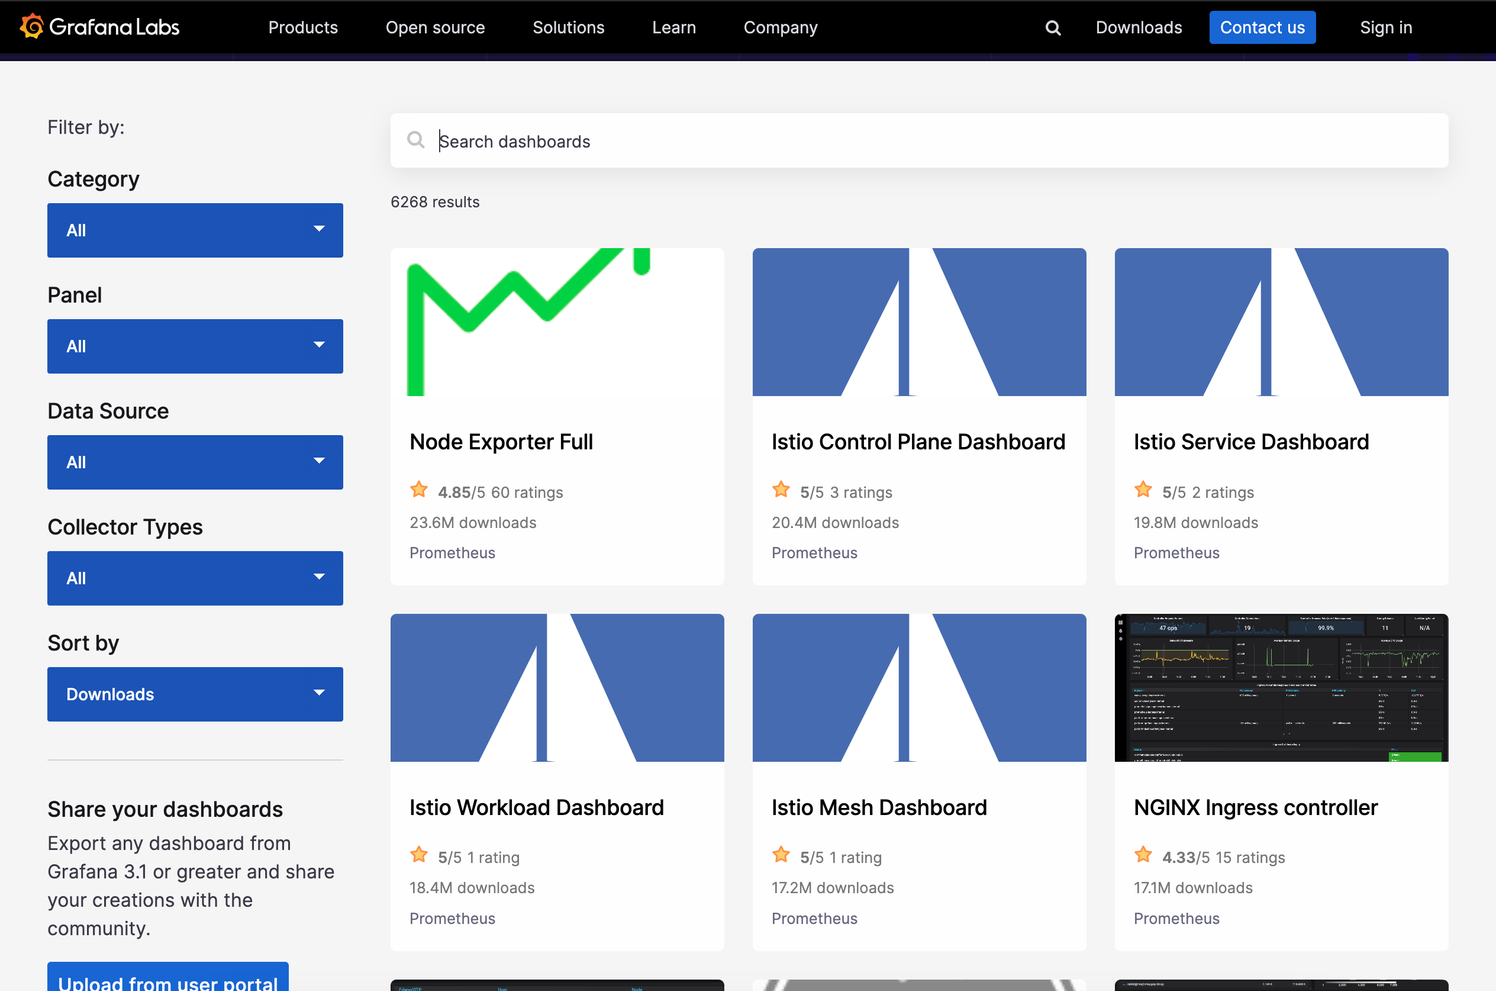
-
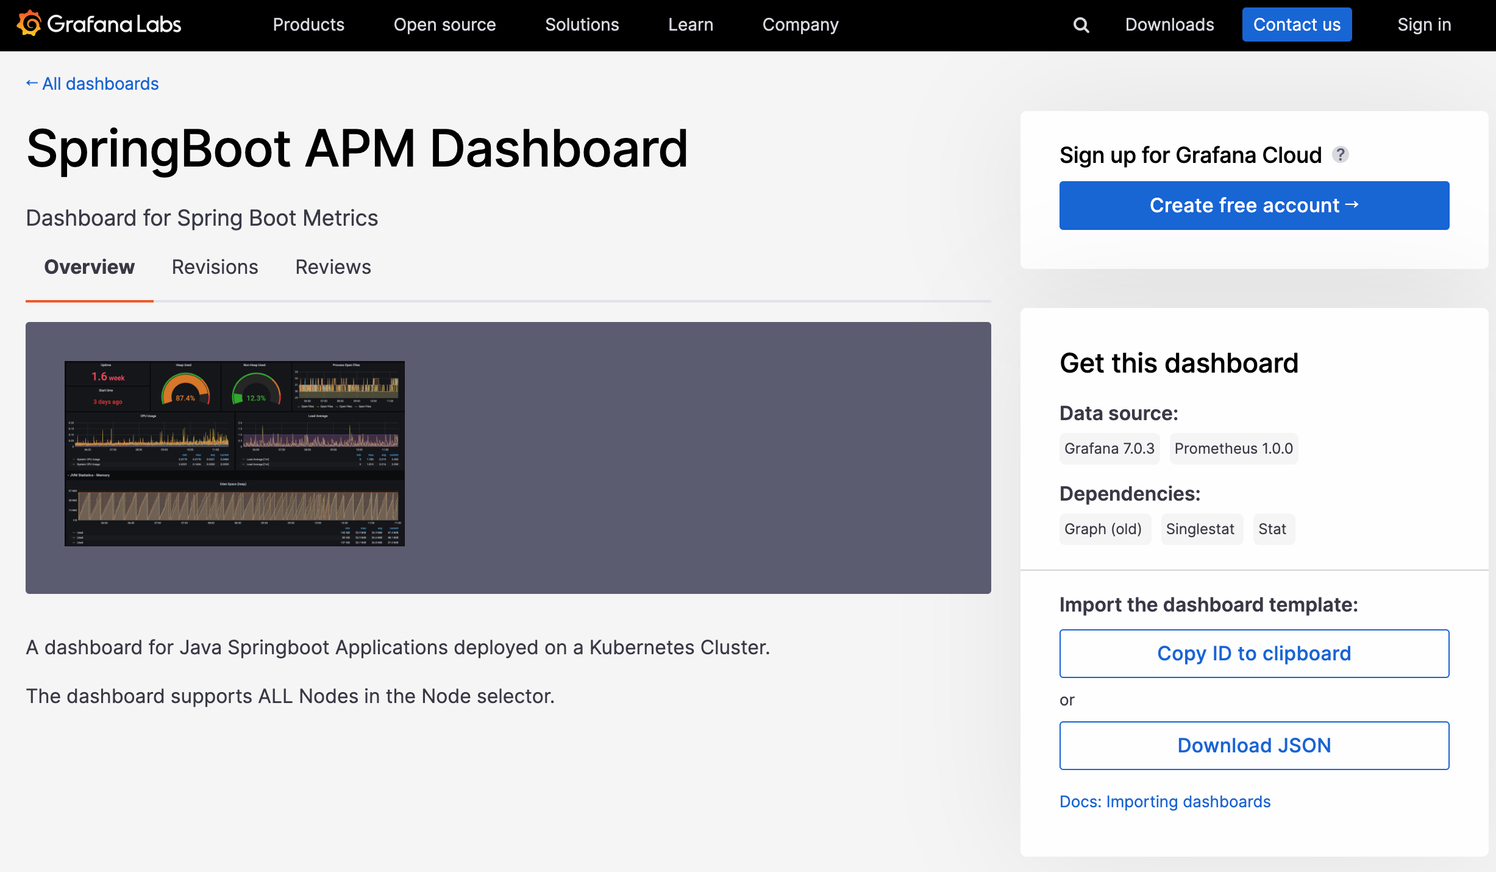
ID를 복사해서 사용하는 방법이 있고, JSON 파일을 받아서 사용하는 방법이 있다.
-
간단하게 ID를 복사해서 import 진행
-
[Copy ID to clipboard] 클릭
-
나의 grafana dashboard 화면으로 와서 New-Import 클릭
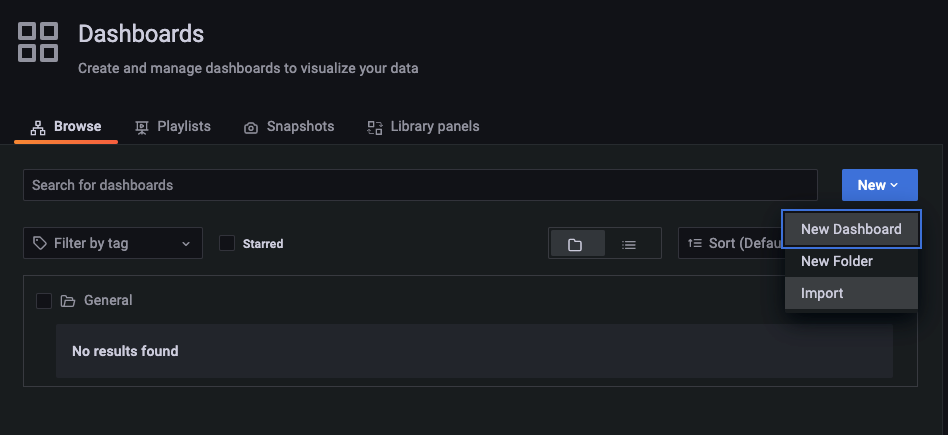
-
아까 복사한 ID를 넣고 Load 버튼을 클릭
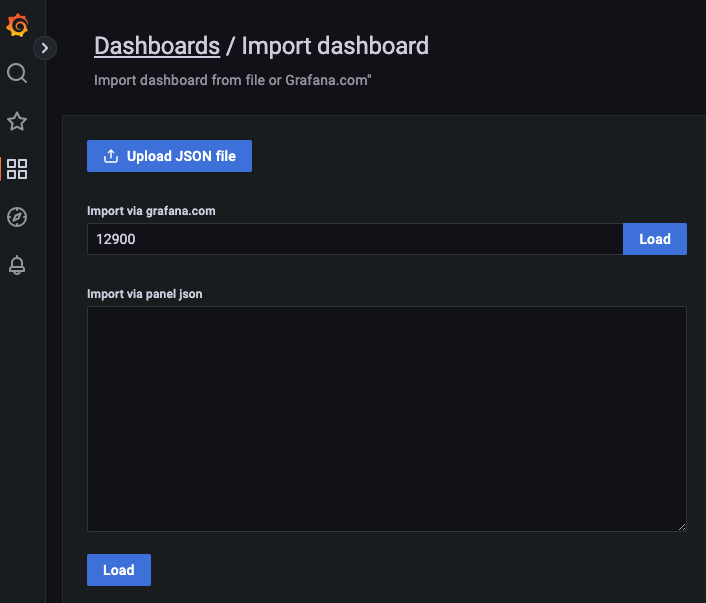
-
알아서 Dashboard template을 불러온다.
- 나머지는 그대로 두고 Prometheus 부분만 선택해주고 [Import] 클릭
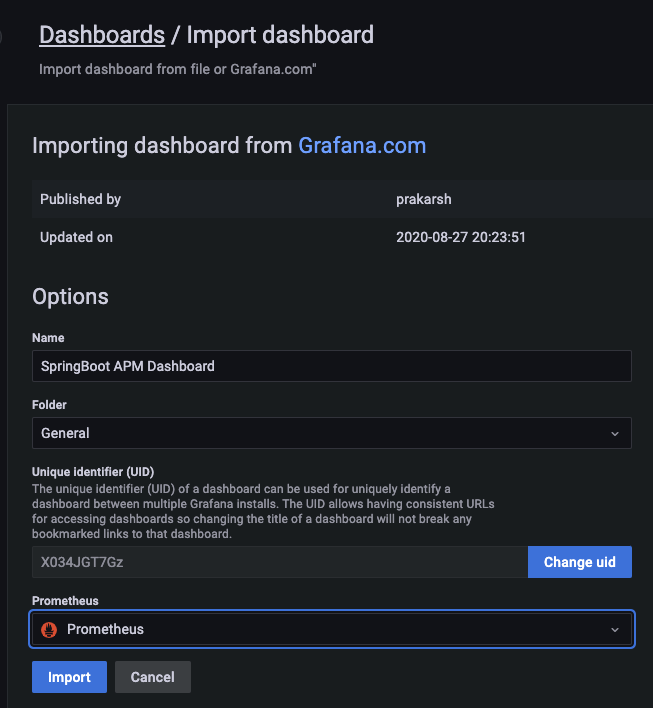
- 나머지는 그대로 두고 Prometheus 부분만 선택해주고 [Import] 클릭
-
멋진 APM 이 완성되었다.
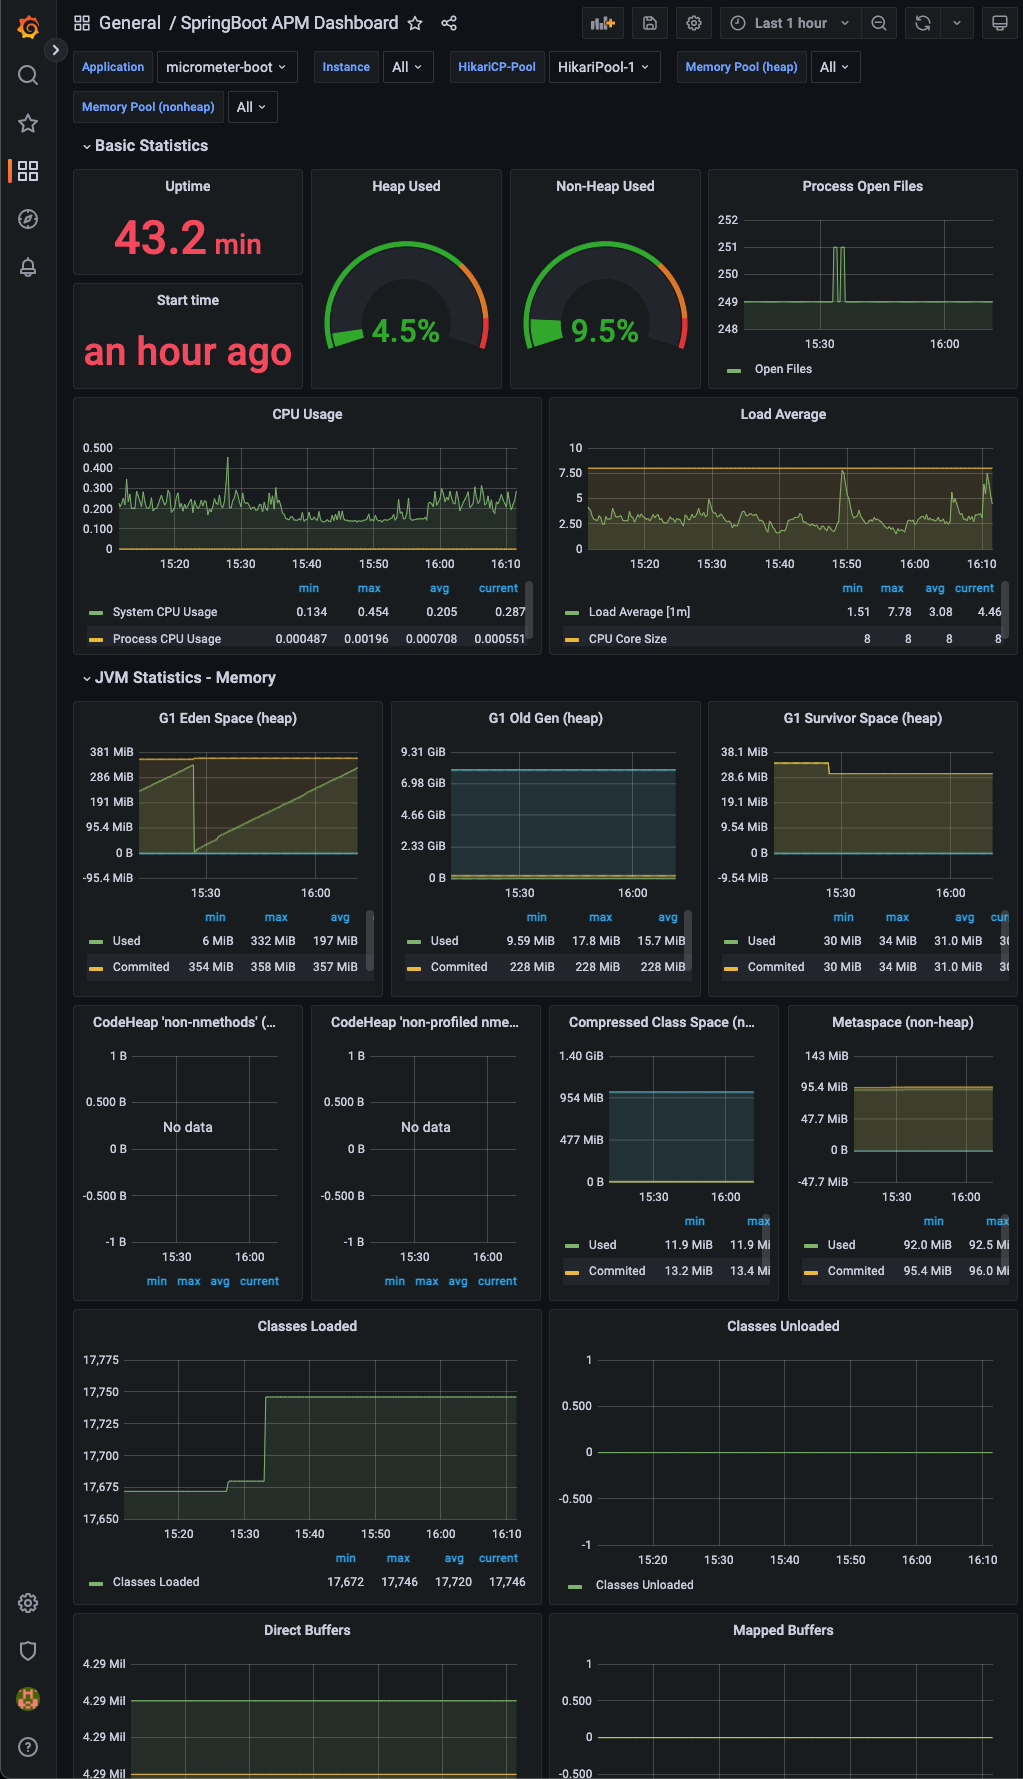
-
Custom Metric 추가
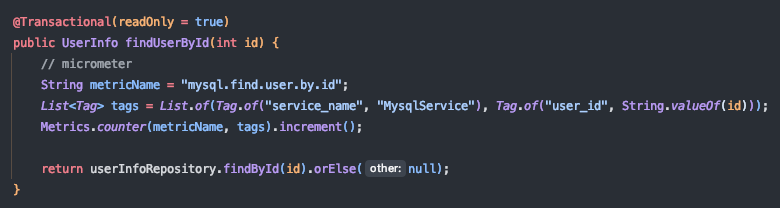
- 기본으로 제공해주는 Metric도 좋지만, Custom된 Metric을 추가하고 싶다.
- Metric 추가 코드 작성
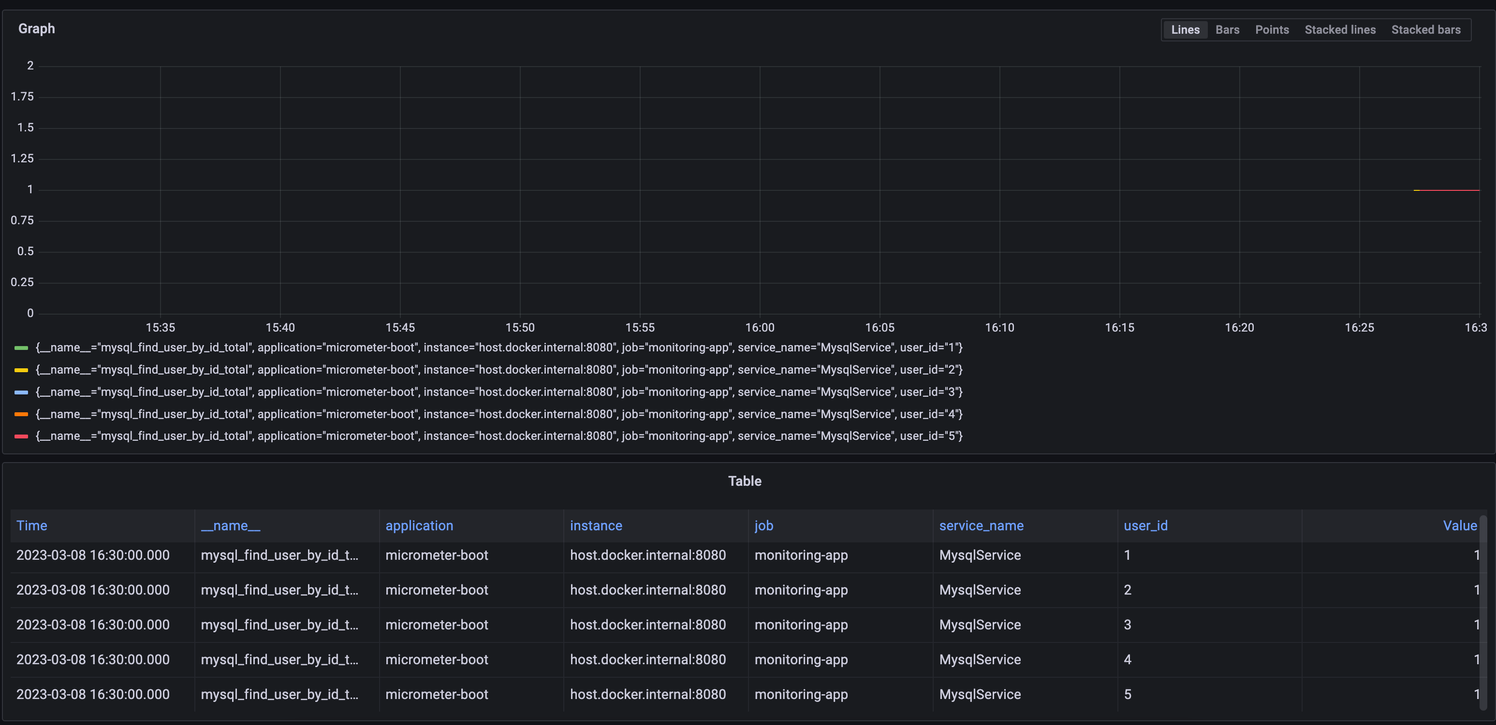
- (CASE1) 해당 코드 부분이 실행되도록 API 호출
- userId가 1,2,3,4,5를 조회하는 API를 한번씩 실행 함
- Grafana - Explore 메뉴에 들어가서 Metric을 보면 mysql_find_user_by_id_total이라는 항목이 생김
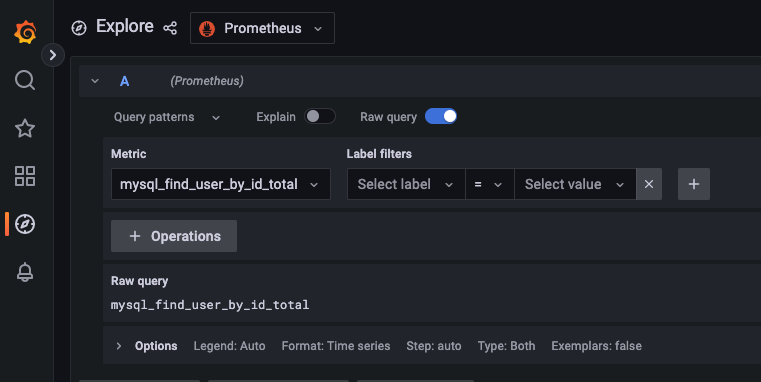
- 조회 결과
- user_id가 1,2,3,4,5인 항목의 value가 1씩 들어감
-
(CASE2) 해당 코드 부분이 실행되도록 API 호출
- userId가 999를 조회하는 API를 100번 실행 함
-
조회 결과
- user_id가 999인 항목의 value가 100으로 들어감
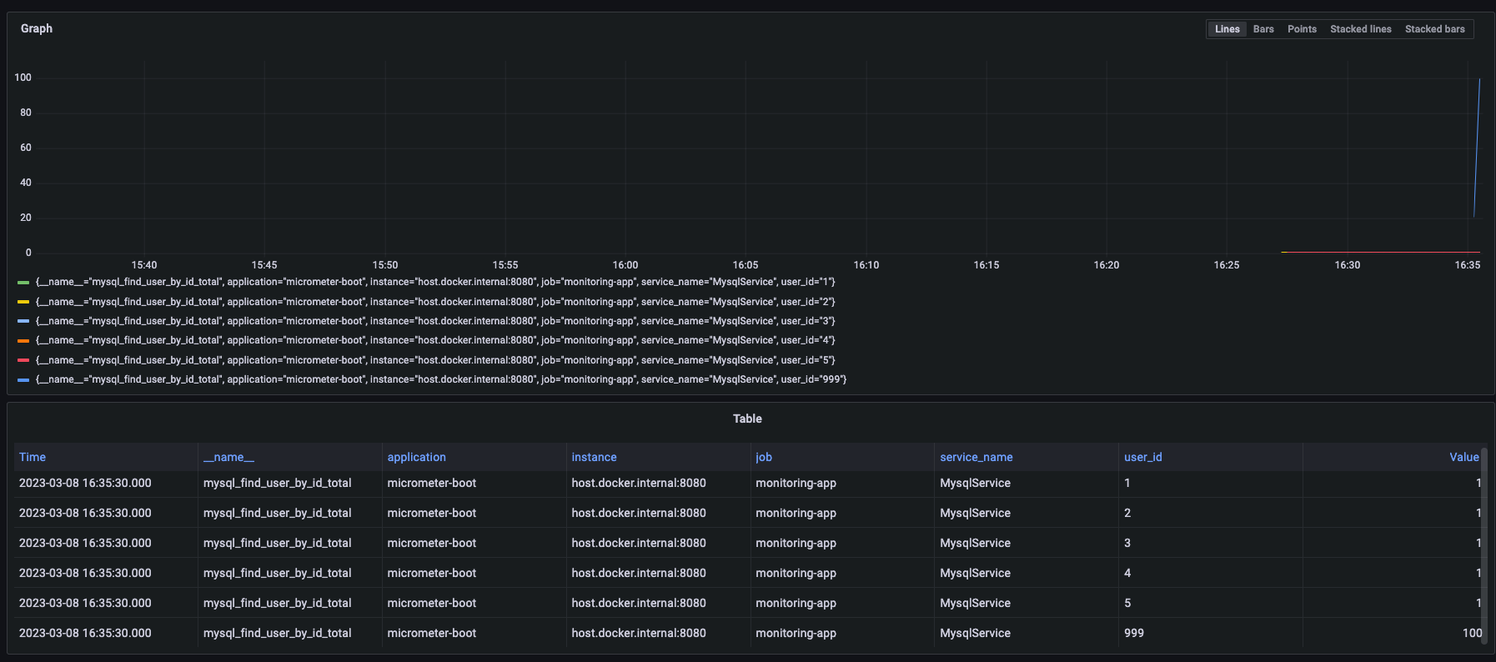
- user_id가 999인 항목의 value가 100으로 들어감
-
PromQL 활용
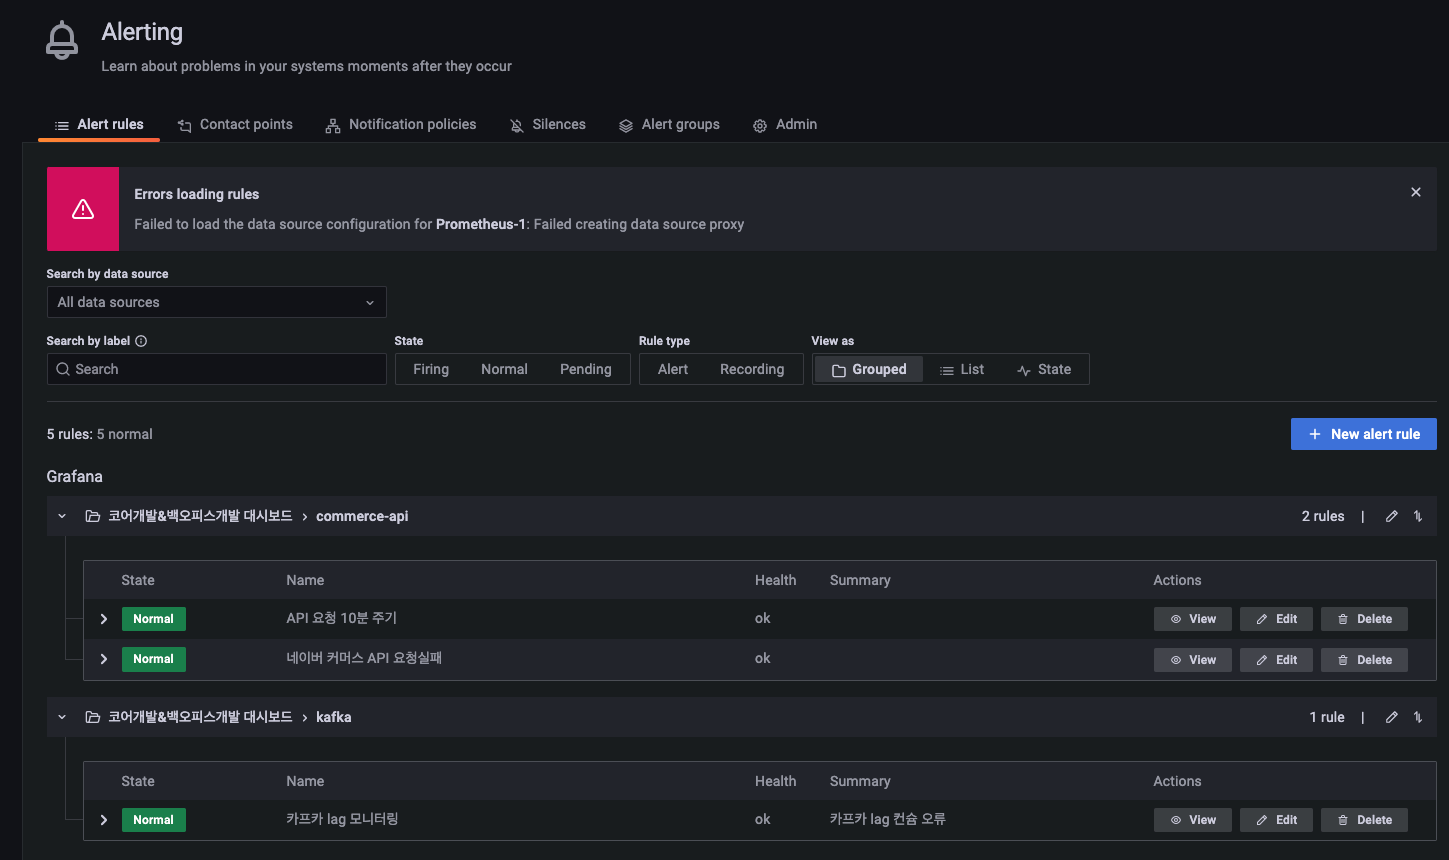
- PromQL을 활용하면 원하는 데이터만 추출할 수 있고, 추출한 데이터의 값을 기준으로 임계치를 설정하여 AlertManager에 등록하면, Teams 나 Slack 등 메신저로 Alert을 발송할 수 있음
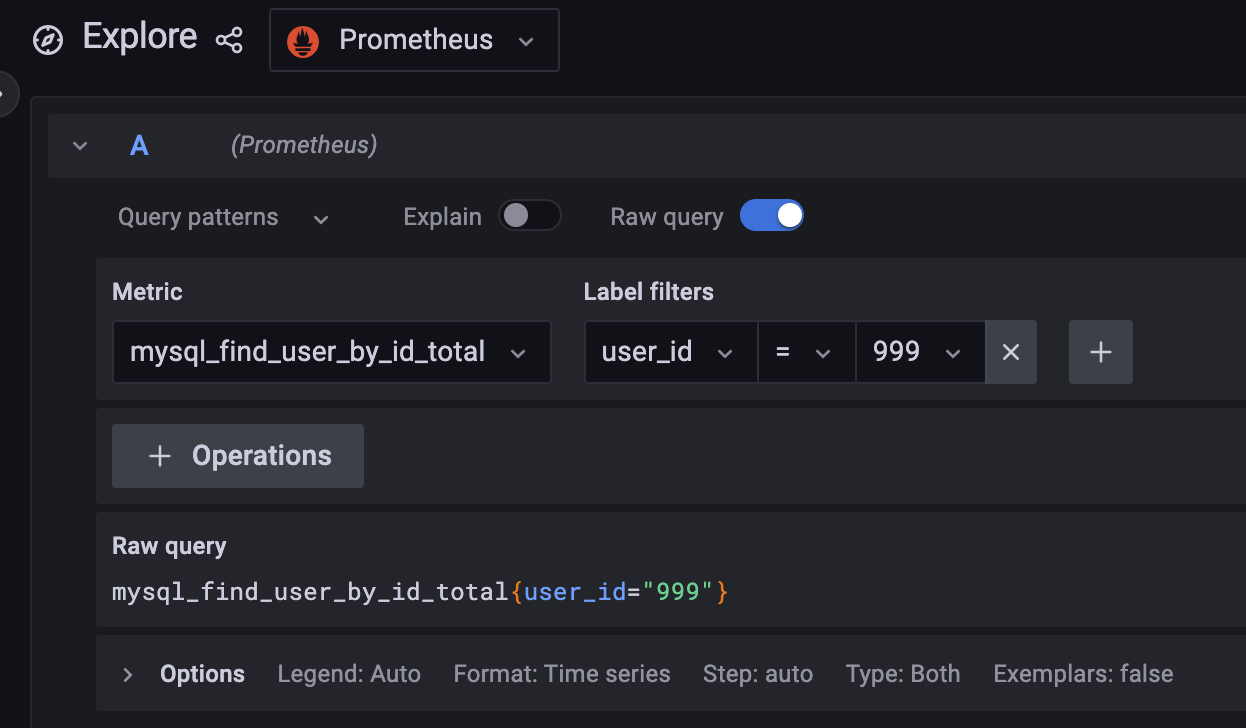
- PromQL을 활용하면 원하는 데이터만 추출할 수 있고, 추출한 데이터의 값을 기준으로 임계치를 설정하여 AlertManager에 등록하면, Teams 나 Slack 등 메신저로 Alert을 발송할 수 있음
-
현재 사용중인 grafana에 아래 사진처럼 alert이 등록되어있으며, 설정한 임계치가 초과하는 경우 Teams의 “[Notification] - [ERROR] 코어개발-백오피스개발팀” 채널로 메시지가 발송되고 있음
마무리
- prometheus, PromQL에 대한 이해도를 높이고 다양한 부분에 사용하여 운영 환경에 대한 Metric 수집 및 Alerting 까지 구성하여 System Monitoring을 강화하자.
- PromQL 참고자료 : https://velog.io/@zihs0822/PromQL-%EA%B0%9C%EB%85%90