1. 현재 EC2 인스턴스에 적용된 IAM 역할 에 정책 추가
IAM → 역할 → 현재 인스턴스의 IAM 역할
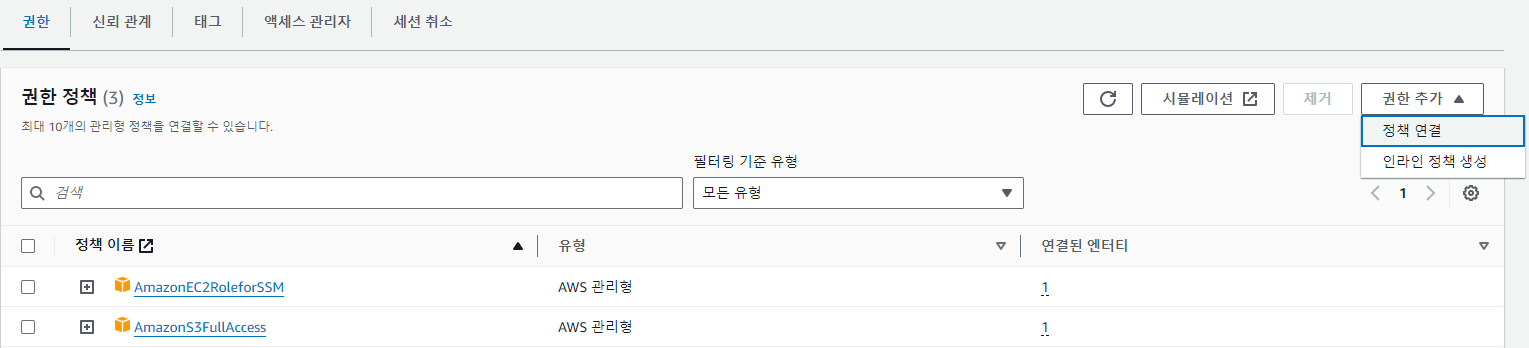
권한 정책 → 권한 추가 → 정책 연결
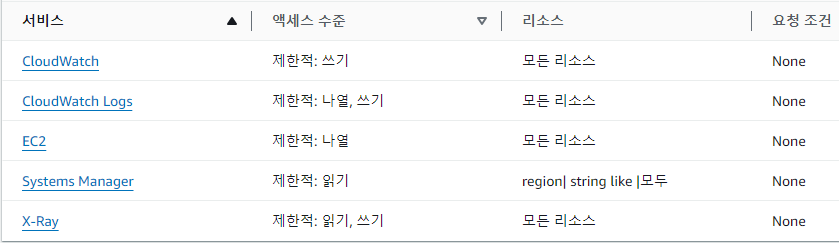
CloudWatchAgentServerPolicy 선택해서 권한 추가
CloudWatchAgentServerPolicy 정책에 허용된 권한들: CloudWatch Logs, EC2 등
2. EC2 인스턴스에 CloudWatch Agent 설치
ec2 인스턴스에 접속해서 CloudWatch 에이전트 설치
wget https://amazoncloudwatch-agent.s3.amazonaws.com/amazon_linux/amd64/latest/amazon-cloudwatch-agent.rpm
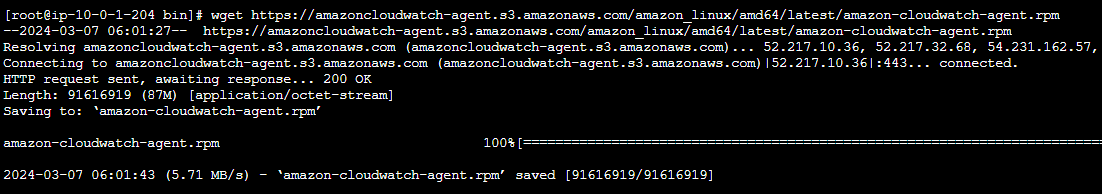
RPM 기반의 리눅스 시스템에서 Amazon CloudWatch Agent 패키지 설치
sudo rpm -U amazon-cloudwatch-agent.rpm
3. 에이전트 구성 파일 생성
sudo /opt/aws/amazon-cloudwatch-agent/bin/amazon-cloudwatch-agent-config-wizard
Which user are you planning to run the agent?
1. cwagent
2. root
3. others
CloudWatch Agent를 실행할 리눅스 사용자 계정을 선택
root: 시스템의 관리자 계정. root 계정으로 에이전트를 실행하면 에이전트가 시스템의 모든 부분에 접근할 수 있게 되므로 보안적인 리스크가 크다.
cwagent: CloudWatch Agent 전용으로 생성된 비교적 제한된 권한을 가진 사용자 계정 (권장)
→ cwagent 로 선택
Do you want to turn on StatsD daemon?
1. yes
2. no
CloudWatch 에이전트가 statsD 메트릭을 수직할 수 있도록 StatsD 데몬 활성화 여부
→ StatsD는 네트워크 통계 수집 도구로, 메트릭을 수직하고 그래프화하는 데 사용. 로그 수집과는 관련 없음
→ no 선택
Do you want to monitor metrics from CollectD?
1. yes
2. no
CollectD 메트릭 모니터링 여부. CPU 사용량, 메모리 사용, 디스크 I/O, 네트워크 트래픽 등)에서 메트릭을 수집하고, 이러한 데이터를 저장하거나 다른 도구로 전송하는 기능을 제공. 이 것도 로그 수집과는 관련 없음
→ no 선택
Do you want to monitor any host metrics? e.g. CPU, memory, etc.
1. yes
2. no
호스트 메트릭 모니터링 여부. 시스템의 CPU, 메모리 등의 메트릭을 모니터링
→ yes 선택
Do you want to monitor cpu metrics per core?
1. yes
2. no
CPU 메트릭을 코어별로 모니터링 여부. 프리 티어 한도 내에서 사용하는 경우 추가 비용이 발생하지 않지만, 초과하는 경우 CloudWatch의 가격 정책에 따라 비용 발생.
*Amazon CloudWatch 요금 정보
https://aws.amazon.com/ko/cloudwatch/pricing/
→ yes 선택 (나중에 변경 가능)
Do you want to add ec2 dimensions (ImageId, InstanceId, InstanceType, AutoScalingGroupName) into all of your metr
ics if the info is available?
1. yes
2. no
EC2 차원 추가 여부. EC2 인스턴스에 대한 메트릭을 더 상세하게 모니터링 할 수 있다.
→ yes 선택
Do you want to aggregate ec2 dimensions (InstanceId)?
1. yes
2. no
EC2 인스턴스에서 수집되는 메트릭 데이터에 대해 인스턴스 ID 별로 데이터를 집계할지의 여부.
yes를 선택하면, 각 EC2 인스턴스의 CPU 사용률, 메모리 사용량, 네트워크 트래픽 등을 개별적으로 확인할 수 있게 된다.
→ yes 선택
Would you like to collect your metrics at high resolution (sub-minute resolution)? This enables sub-minute resolu
tion for all metrics, but you can customize for specific metrics in the output json file.
1. 1s
2. 10s
3. 30s
4. 60s
고해상도 메트릭 수집 여부로 메트릭을 보다 빈번하게 수집하고 싶다면, 높은 해상도를 선택한다.
→ 기본 값인 60s 선택
Which default metrics config do you want?
1. Basic
2. Standard
3. Advanced
4. None
메트릭 모니터링의 범위를 결정
→ Standard 선택
여기까지 주로 메트릭스 (CPU 사용률, 디스크 사용량, 메모리 사용량 등 서버의 성능) 수집에 관한 설정만 함. 로그 수집에 관한 설정은 없음.
로그 파일의 경로와 로그를 수집할 방식에 대한 설정 추가 필요
Are you satisfied with the above config? Note: it can be manually customized after the wizard completes to add additional items.
1. yes
2. no
방금 구성한 설정에 만족하는지 물음
→ yes 선택
Do you have any existing CloudWatch Log Agent (http://docs.aws.amazon.com/AmazonCloudWatch/latest/logs/AgentReference.html) configuration file to import for migration?
1. yes
2. no
기존 로그 수집 설정(CloudWatch Logs 에이전트)을 새 CloudWatch Agent로 마이그레이션할지의 여부
→ no 선택
Do you want to monitor any log files?
1. yes
2. no
CloudWatch Agent를 사용하여 로그 파일을 모니터링할지의 여부로, 특정 로그 파일들을 CloudWatch Logs에 보내서 모니터링하고 싶을 때 선택
→ yes 선택
Log group class:
1. STANDARD 2. INFREQUENT_ACCESS
로그 데이터를 저장하는 방식을 선택하는 옵션
https://dev.classmethod.jp/articles/about-cloudwatch-ia-kr/ 참고
*비용
Standard : GB당 0.76 USD
Infrequent Access : GB당 0.38 USD
→ INFREQUENT_ACCESS 선택
Log Group Retention in days
1. -1
2. 1
3. 3
4. 5
5. 7
6. 14
7. 30
8. 60
로그 그룹에서 로그 데이터를 보관할 기간을 설정
개발 환경: 로그 데이터가 빠르게 변하고 주기적으로 확인하는 경우가 많으므로, 비용 절감을 위해 3 ~14일 권장
운영 환경:
- 중요도가 낮은 로그: 30 ~ 60 일로 설정 (일반적인 모니터링 및 장애 대응에 충분한 기간)
- 중요도가 높은 로그 (보안, 트랜잭션 등): 90 ~ 365 일로 장기간 설정 (특정 규정 준수 요구 사항이나 감사 목적을 위해)
→ 7일로 설정 (변경 가능)
Do you want to specify any additional log files to monitor?
1. yes
2. no
추가로 모니터링하고 싶은 로그 파일이 있는지의 여부. no로 선택해도 CloudWatch Agent의 설정 파일을 직접 수정하여 추가할 수 있음.
→ no로 선택
Do you want the CloudWatch agent to also retrieve X-ray traces?
1. yes
2. no
CloudWatch 에이전트가 Amazon X-Ray의 추적 데이터(트레이스)도 수집할지 여부. MSA, 쿠버네티스 같은 분산 환경에서 주로 사용
→ no 선택
Do you want to store the config in the SSM parameter store?
1. yes
2. no
SSM관련 서비스의 사용여부로, SSM 사용하려면 IAM role에 ssm 권한을 추가해야 한다.
→ no 선택
* 최종 config file 코드
Current config as follows:
{
        "agent": {
                "metrics_collection_interval": 60,
                "run_as_user": "cwagent"
        },
        "logs": {
                "logs_collected": {
                        "files": {
                                "collect_list": [
                                        {
                                                "file_path": "/var/log/myapp/logfile_*.log",
                                                "log_group_class": "INFREQUENT_ACCESS",
                                                "log_group_name": "GoohaeyouLogs",
                                                "log_stream_name": "goohaeyou-prod-i-인스턴스ID",
                                                "retention_in_days": 7
                                        }
                                ]
                        }
                }
        },
        "metrics": {
                "aggregation_dimensions": [
                        [
                                "InstanceId"
                        ]
                ],
                "append_dimensions": {
                        "AutoScalingGroupName": "${aws:AutoScalingGroupName}",
                        "ImageId": "${aws:ImageId}",
                        "InstanceId": "${aws:InstanceId}",
                        "InstanceType": "${aws:InstanceType}"
                },
                "metrics_collected": {
                        "cpu": {
                                "measurement": [
                                        "cpu_usage_idle",
                                        "cpu_usage_iowait",
                                        "cpu_usage_user",
                                        "cpu_usage_system"
                                ],
                                "metrics_collection_interval": 60,
                                "resources": [
                                        "*"
                                ],
                                "totalcpu": false
                        },
                        "disk": {
                                "measurement": [
                                        "used_percent",
                                        "inodes_free"
                                ],
                                "metrics_collection_interval": 60,
                                "resources": [
                                        "*"
                                ]
                        },
                        "diskio": {
                                "measurement": [
                                        "io_time"
                                ],
                                "metrics_collection_interval": 60,
                                "resources": [
                                        "*"
                                ]
                        },
                        "mem": {
                                "measurement": [
                                        "mem_used_percent"
                                ],
                                "metrics_collection_interval": 60
                        },
                        "swap": {
                                "measurement": [
                                        "swap_used_percent"
                                ],
                                "metrics_collection_interval": 60
                        }
                }
        }
}
config file 경로: /opt/aws/amazon-cloudwatch-agent/bin/config.json.
4. 아래의 명령어를 입력해 config file을 가져와서 CloudWatch에 업로드
sudo /opt/aws/amazon-cloudwatch-agent/bin/amazon-cloudwatch-agent-ctl -a fetch-config -m ec2 -s -c file:/opt/aws/amazon-cloudwatch-agent/bin/config.json
CloudWatch 에이전트 config file을 성공적으로 가져왔으며, 해당 파일의 유효성도 확인됨.
또한 서비스의 symbolic link도 생성.
→ 이제 config file 을 사용하여 에이전트를 시작할 수 있게 됨.
