Prometheus
- Metrics를 수집하고 모니터링 및 알람에 사용되는 오픈소스 애플리케이션
- Pull 방식의 구조와 다양한 Metrics Exporter 제공
- 시계열 DB에 Metrics 저장 -> 조회 가능(쿼리)
간단히 사용해보기
- 설치 아래링크에서 os에 맞게 설치
- 압축 풀기
- tar xvzf prometheus-2.31.0-rc.0.darwin-amd64.tar.gz
- prometheus.yml 수정 (scrape_configs 아래에 다음 내용 추가)
scrape_configs:
  # The job name is added as a label `job=<job_name>` to any timeseries scraped from this config.
  ...

  - job_name: "user-service"
    scrape_interval: 15s
    metrics_path: "/user-service/actuator/prometheus"
    static_configs:
      - targets: ["localhost:8000"]

  - job_name: "apigateway-service"
    scrape_interval: 15s
    metrics_path: "/actuator/prometheus"
    static_configs:
      - targets: ["localhost:8000"]

  - job_name: "order-service"
    scrape_interval: 15s
    metrics_path: "/order-service/actuator/prometheus"
    static_configs:
- targets: ["localhost:8000"]- 실행 (포트 9090)
- ./prometheus --config.file=prometheus.yml
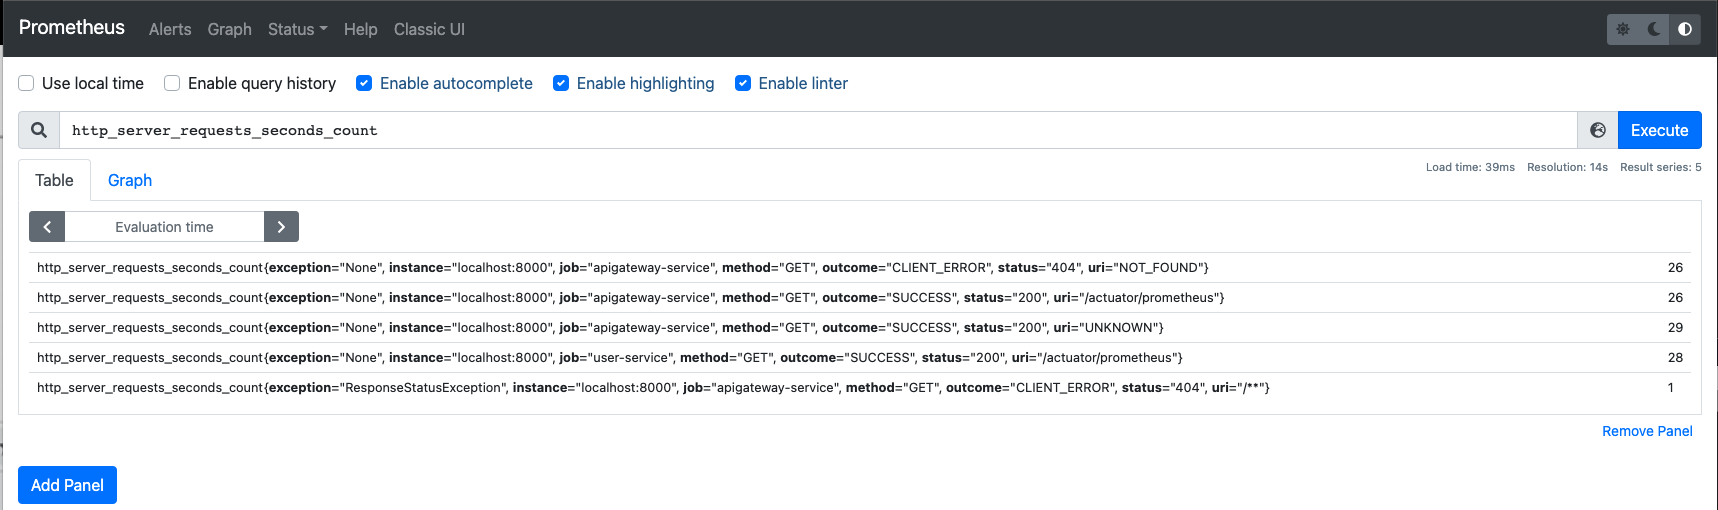 실행 시 대시보드에서 http_server_requests_seconds_count를 검색
- ./prometheus --config.file=prometheus.yml
Grafana
- 데이터 시각화, 모니터링 및 분석을 위한 오프소스 애플리케이션
- 시계열 데이터를 시각화하기 위한 대시보드 제공
간단히 사용해보기
- 설치
https://grafana.com/grafana/download?edition=oss&pg=get&plcmt=selfmanaged-box1-cta1&platform=mac - 실행 (포트 3000, 계정/비밀번호 : admin/admin)
./bin/grafana-server - 접속 후 Configuration에서 Prometheus 추가
- Create -> import 로 DashBoard생성
https://grafana.com/grafana/dashboards/?orderBy=downloads&direction=desc - 위의 링크에서 맞는 대시보드를 찾아서 id값을 임포트한다
- 기본설정과 다른 값들을 다 맞게 바꿔준다
ex) gateway_requests_seconds_count -> spring_cloud_gateway_requests_seconds_count
or
서비스명 변경하면 됨

Hi