오픈소스 차트 라이브러리 Vega 분석하기 #1
Vega란?
오픈소스 차트 라이브러리이다.
Vega의 라이센스는?
BSD-3이다. 상업적인 사용도 가능하고, 변경도 가능하고, 배포도 가능하고, 사적인 사용도 가능하다.
Vega의 장점은?
- 오픈소스 라이브러리
- JSON 하나로 모든 옵션들을 설정할 수 있다.
- 유저와 상호작용을 고려하고 만든 라이브러리이다.
- 키바나에서 쓰는 차트 라이브러리이다.
- 많은 예제들이 존재한다.
Vega 라인차트 예제
- 여기에 있는 예제 차트를 기반으로 차트를 하나 만들어보자.
아래와 같은 소스코드를 입력하면,
import React from 'react';
import {Vega} from 'react-vega';
import {Spec} from 'vega'; // 타입스크립트 사용

function Index() {
  const lineChart: Spec = {
    $schema: 'https://vega.github.io/schema/vega/v5.json',
    description: 'A basic line chart example.',
    width: 500,
    height: 200,
    padding: 5,

    signals: [
      {
        name: 'interpolate',
        value: 'linear',
        bind: {
          input: 'select',
          options: [
            'basis',
            'cardinal',
            'catmull-rom',
            'linear',
            'monotone',
            'natural',
            'step',
            'step-after',
            'step-before',
          ],
        },
      },
    ],

    data: [
      {
        name: 'table',
        values: [
          {x: 0, y: 28, c: 0},
          {x: 0, y: 20, c: 1},
          {x: 1, y: 43, c: 0},
          {x: 1, y: 35, c: 1},
          {x: 2, y: 81, c: 0},
          {x: 2, y: 10, c: 1},
          {x: 3, y: 19, c: 0},
          {x: 3, y: 15, c: 1},
          {x: 4, y: 52, c: 0},
          {x: 4, y: 48, c: 1},
          {x: 5, y: 24, c: 0},
          {x: 5, y: 28, c: 1},
          {x: 6, y: 87, c: 0},
          {x: 6, y: 66, c: 1},
          {x: 7, y: 17, c: 0},
          {x: 7, y: 27, c: 1},
          {x: 8, y: 68, c: 0},
          {x: 8, y: 16, c: 1},
          {x: 9, y: 49, c: 0},
          {x: 9, y: 25, c: 1},
        ],
      },
    ],

    scales: [
      {
        name: 'x',
        type: 'point',
        range: 'width',
        domain: {data: 'table', field: 'x'},
      },
      {
        name: 'y',
        type: 'linear',
        range: 'height',
        nice: true,
        zero: true,
        domain: {data: 'table', field: 'y'},
      },
      {
        name: 'color',
        type: 'ordinal',
        range: 'category',
        domain: {data: 'table', field: 'c'},
      },
    ],

    axes: [
      {orient: 'bottom', scale: 'x'},
      {orient: 'left', scale: 'y'},
    ],

    marks: [
      {
        type: 'group',
        from: {
          facet: {
            name: 'series',
            data: 'table',
            groupby: 'c',
          },
        },
        marks: [
          {
            type: 'line',
            from: {data: 'series'},
            encode: {
              enter: {
                x: {scale: 'x', field: 'x'},
                y: {scale: 'y', field: 'y'},
                stroke: {scale: 'color', field: 'c'},
                strokeWidth: {value: 2},
              },
              update: {
                interpolate: {signal: 'interpolate'},
                strokeOpacity: {value: 1},
              },
              hover: {
                strokeOpacity: {value: 0.5},
              },
            },
          },
        ],
      },
    ],
  };

  return (
    <div>
      <Vega spec={lineChart} />
    </div>
  );
}

export default Index;
아래와 같은 차트가 나온다. 사실 별로 예쁘진 않은 것 같다.
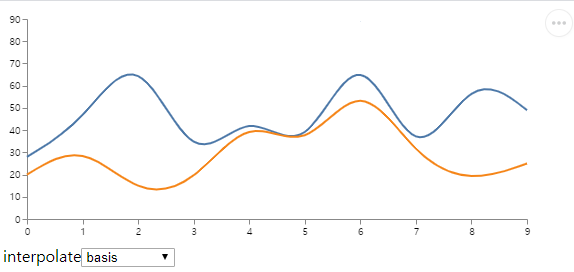
interpolate를 바꾸면 여러가지 형태의 그래프를 만들어볼 수 있다.
드롭박스를 클릭했을 때 나오는 목록 하나하나가 그래프 종류이다.
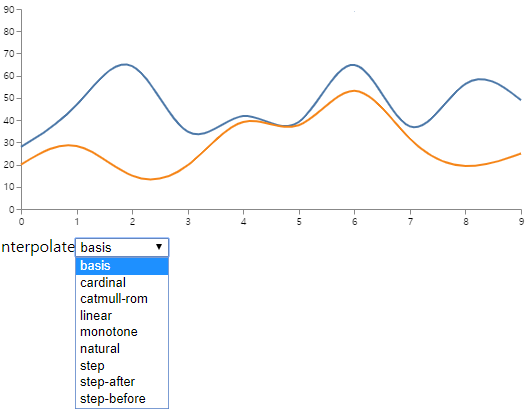
basis
기본 형태의 라인 차트이다. 정확한 지점에 도달하지 못한다. x:2, y:81 값이 있는데, 아무리 그래프를 확인해도 끝점이 85에 닿아있지 않다.

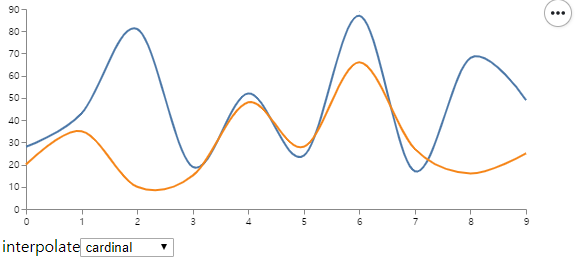
cardinal
라인 차트인데, basis는 정확한 지점에 도달하지 못한 대신 부드럽게 표현하는 반면에 cardinal 차트는 정확한 지점에 도달한다.
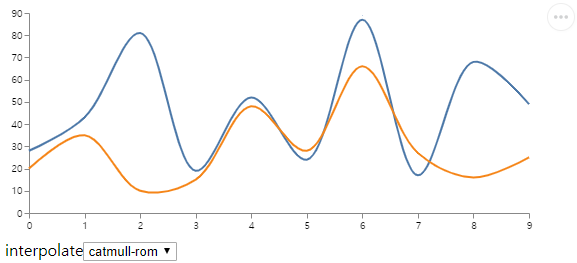
catmull
cardinal이랑 거의 차이가 없는데, 약간 좁은 형태의 그래프를 보여준다.
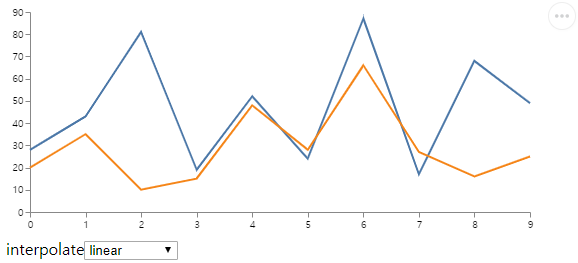
linear
끝점이 부드럽지 않고 뾰족한 형태의 그래프를 보여준다.
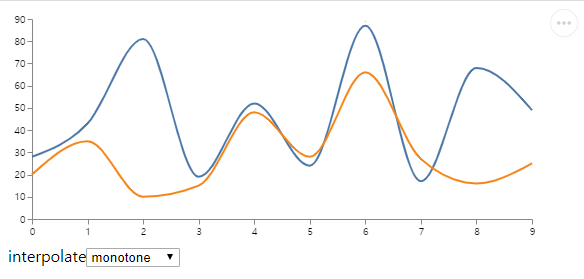
monotone
cardinal, catmull과 거의 흡사하다. 다른 점을 찾기 어려운 정도. 약간 뾰족한 편이다.
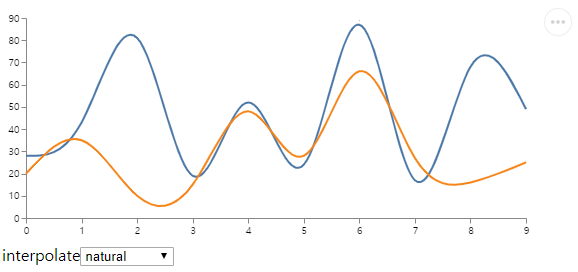
natural
둥글둥글하며 이름처럼 자연스럽다.
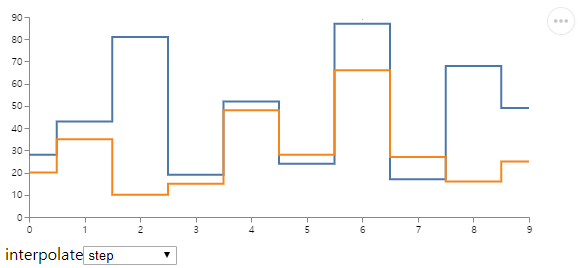
step
마치 0과 1을 표현하던 오실로스코프처럼 표현한다. 계단식 그래프.
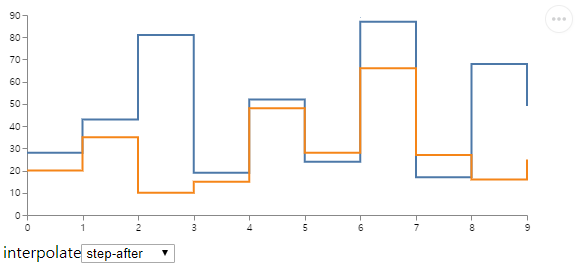
step-after
step과 별다를 것 없는데, 값이 변하는 끝 지점에서 선이 위 아래로 움직인다.
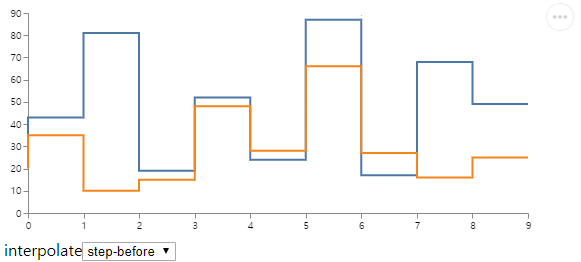
step-before
step과 별다를 것 없는데, 값이 변하는 시작 지점에서 선이 위 아래로 움직인다.
