💡 개념 정리
✅ Prometheus란?
- 대상 시스템에서 다양한 모니터링 지표(metrics)를 수집하고 저장하며, 쿼리를 통해 검색하고 시각화 할 수 있는 오픈소스 모니터링 시스템이다.
✅ Grafana란?
- Prometheus와 같은 모니터링 데이터 소스를 시각화해주는 대시보드 기반의 시각화 도구로 지표를 그래프, 수치 등 다양한 방식으로 표현할 수 있다.
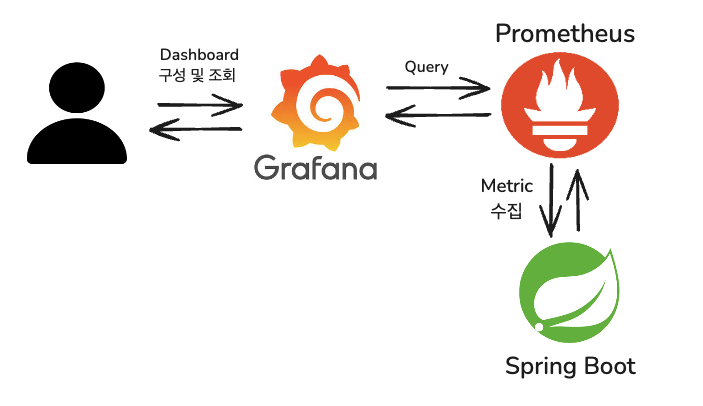
👀 시각화 흐름도

- 사용자는 Grafana를 통해 대시보드를 구성하고 조회한다.
- Grafana는 설정된 데이터 소스인 Prometheus에 쿼리를 전송하여 필요한 메트릭 데이터를 요청한다.
- Prometheus는 Spring Boot 애플리케이션으로부터 메트릭을 수집하여 저장하고, Grafana의 요청에 따라 응답한다.
⚒️ Prometheus 및 Grafana 설치
Prometheus 설치
- Mac (Homebrew)
brew install prometheus
brew services start prometheus

brew services list // 현재 실행 상태 확인(started)- Windows
Prometheus 다운로드 페이지에서 다운로드한다.
Grafana 설치
- Mac (Homebrew)
brew install grafana
brew services start grafana- Windows
Grafana 다운로드 페이지에서 다운로드한다.
📊 시각화 구성 단계
1. Spring Boot 의존성 추가
build.gradle에 다음 의존성을 추가한다.
// actuator
implementation 'org.springframework.boot:spring-boot-starter-actuator'
// prometheus
implementation 'io.micrometer:micrometer-registry-prometheus'
2. Actuator 엔드포인트 설정
application.yaml에 Prometheus 엔드포인트를 노출하도록 설정을 추가한다.
management:
  endpoints:
    web:
      exposure:
        include: prometheus  # prometheus 엔드포인트 노출
      base-path: /actuator    # 기본 경로 (default: /actuator)
설정 후,
http://localhost:8080/actuator/prometheus로 접속
3. Prometheus 설정 파일 구성
prometheus.yml파일을 수정 후 저장한다. (Mac 기준)
open /opt/homebrew/etc/prometheus.yml // 파일 열기prometheus.yml
scrape_configs:
  - job_name: 'spring-actuator'
    metrics_path: '/actuator/prometheus'
    static_configs:
      - targets: ['localhost:8080']  # Spring Boot 앱 포트
- 설정 후 재시작하여 적용한다.
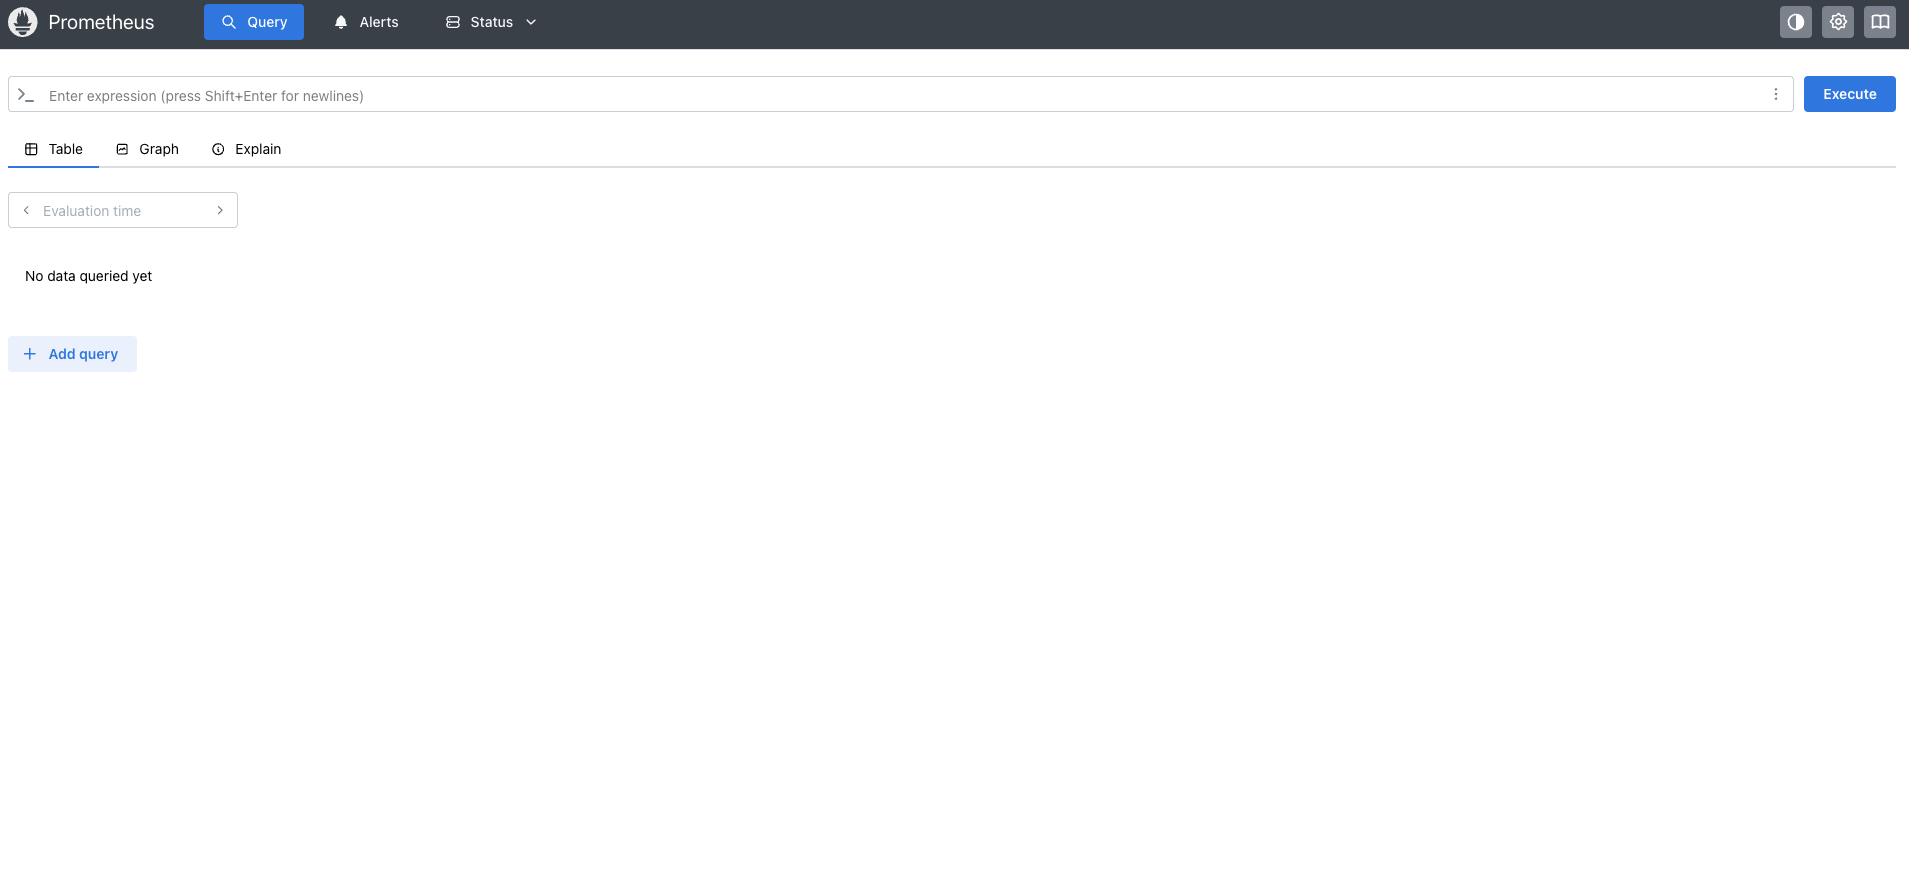
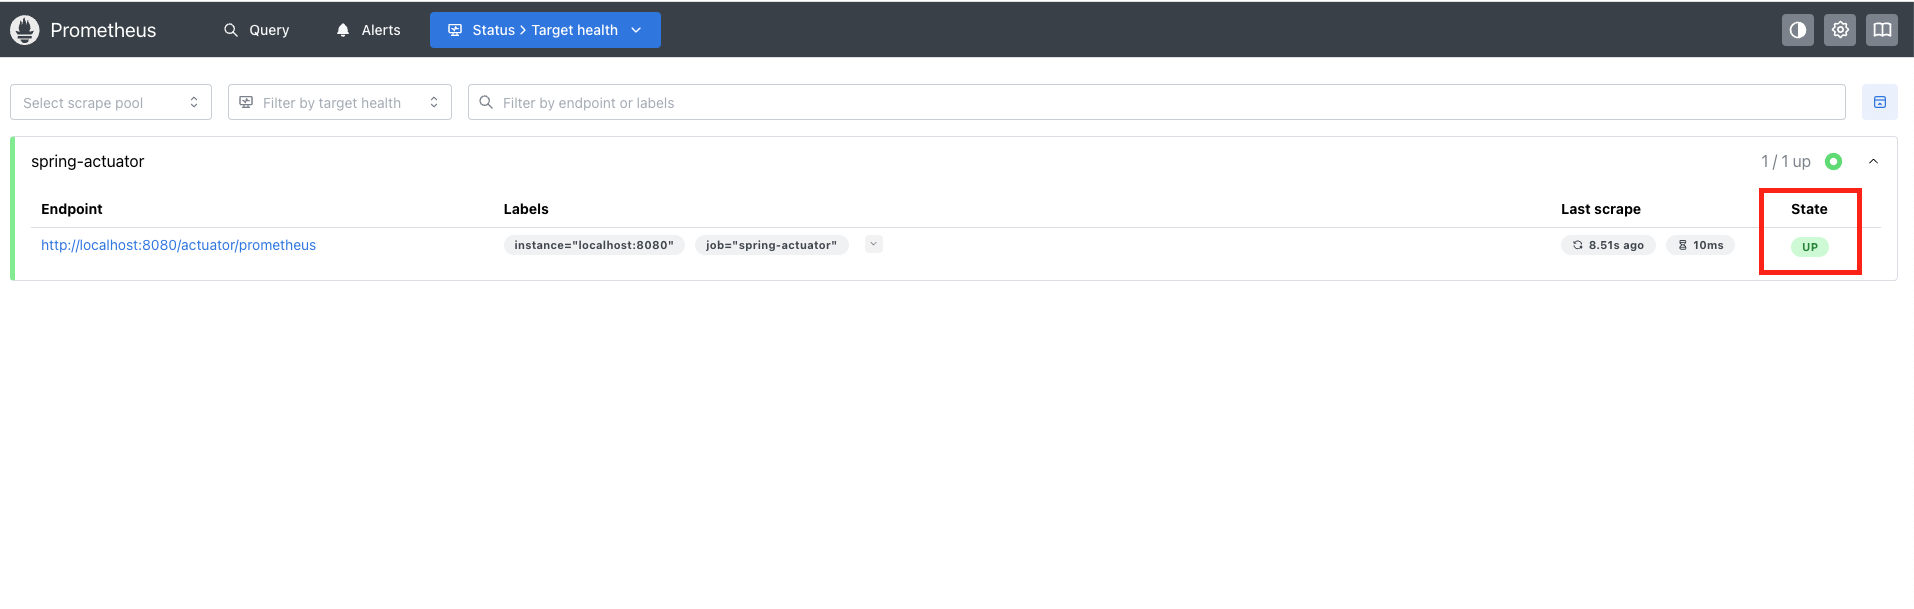
brew services restart prometheus확인
http://localhost:9090으로 접속 후 Status > Targets 메뉴에서 Spring Boot 타겟이 UP 상태인지 확인한다.
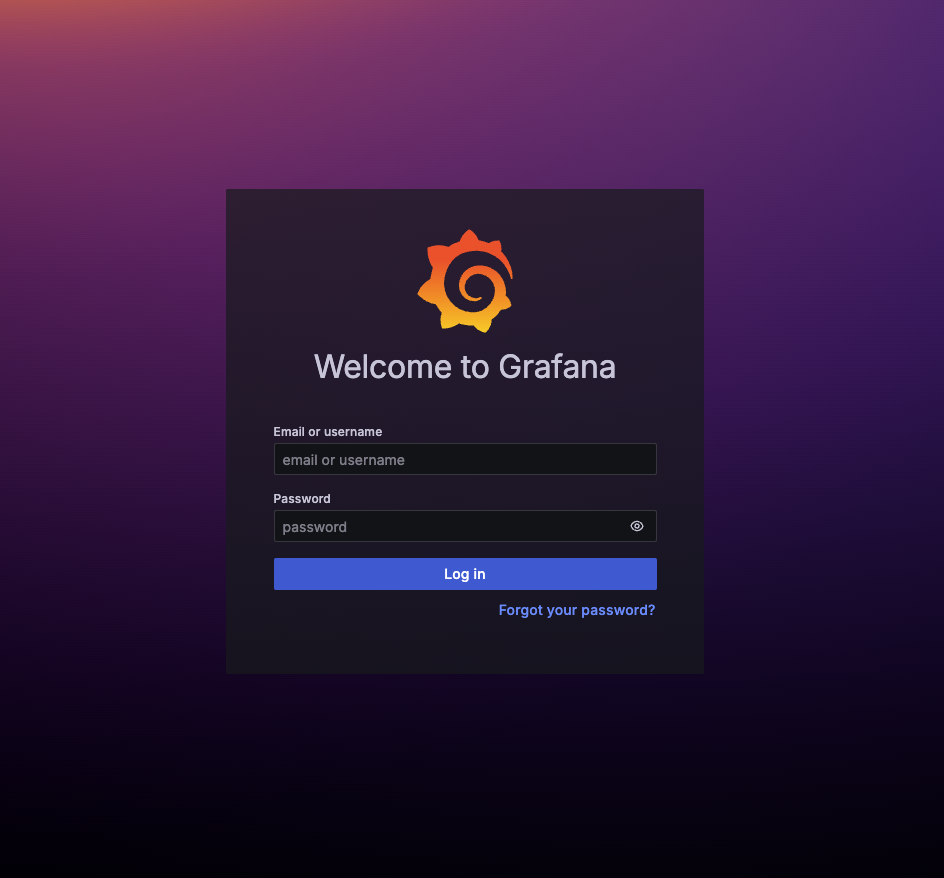
4. Grafana 접속
http://localhost:3000/login으로 접속- 기본 로그인 정보 (id: admin / pw: admin)
5. Prometheus 데이터 소스 연결
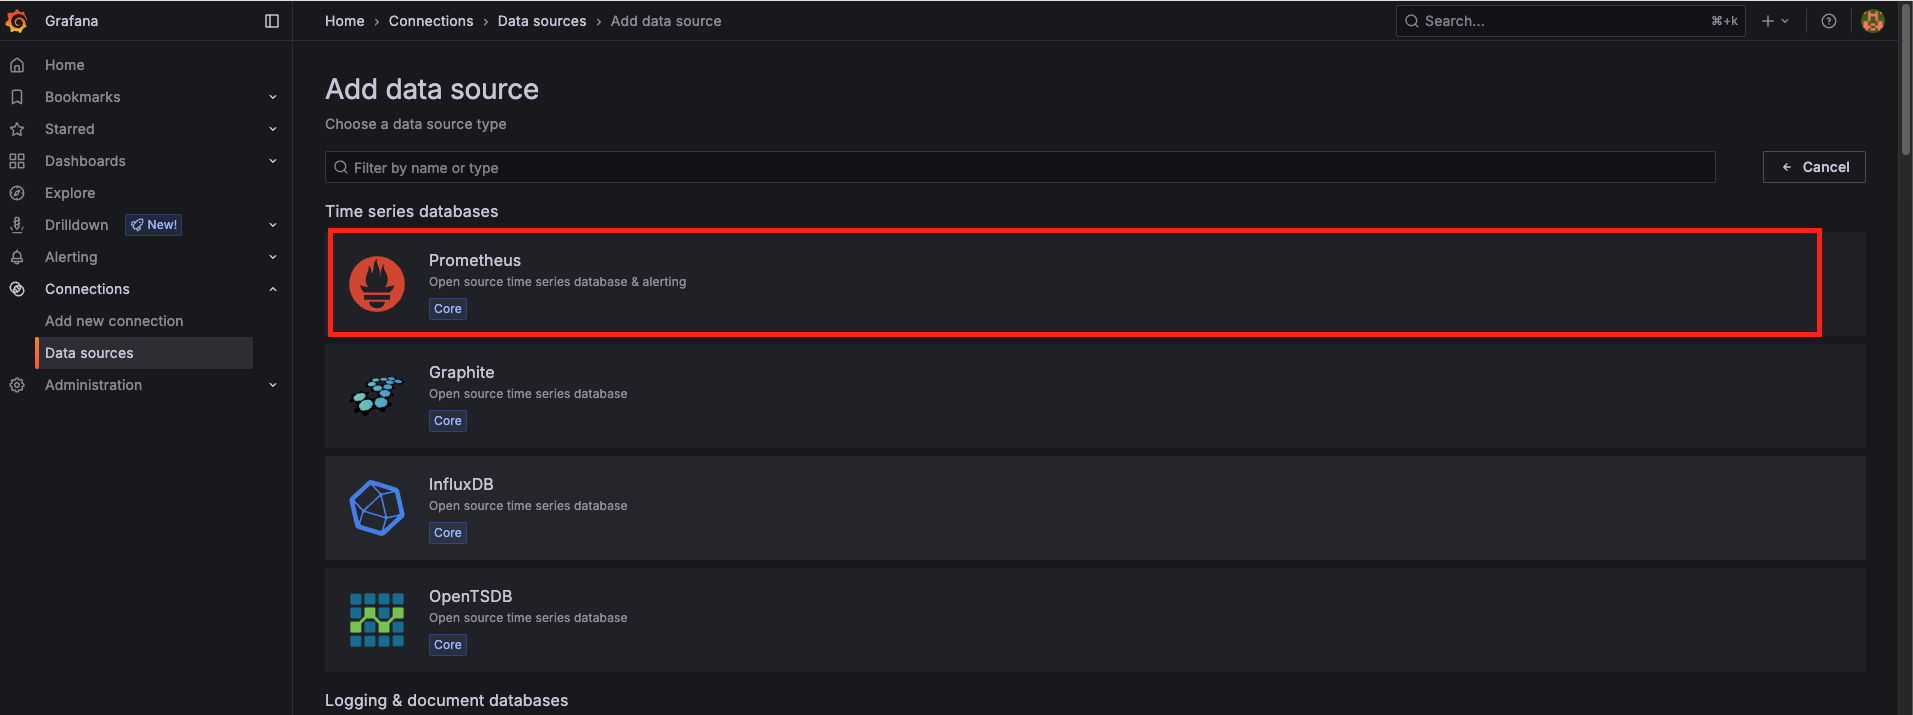
- Add data source >
Prometheus를 선택한다.

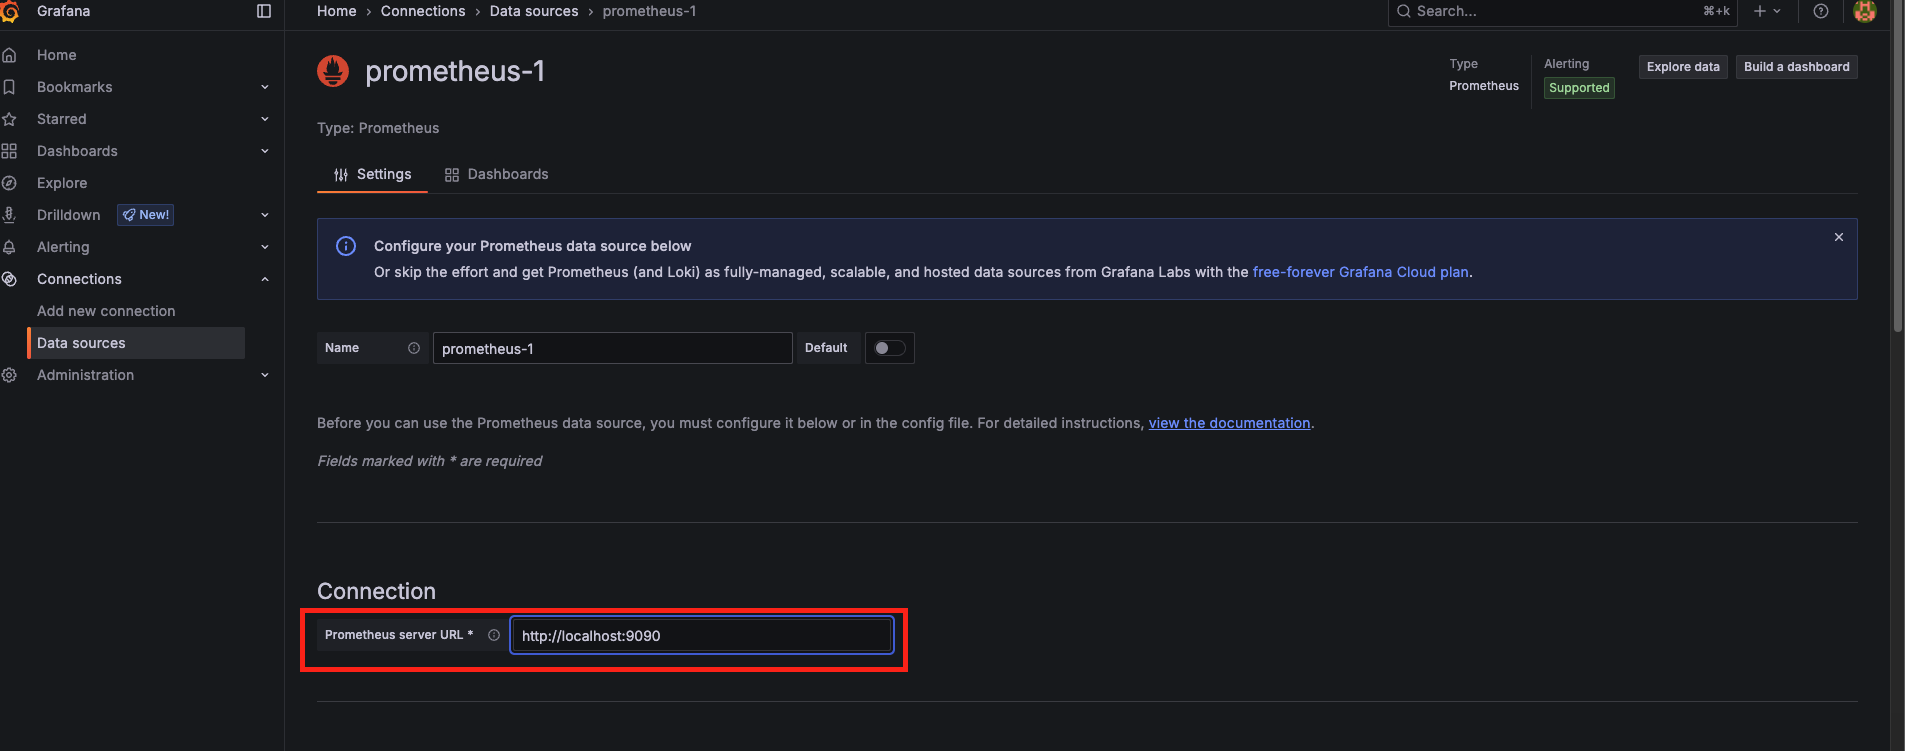
- URL :
http://localhost:9090를 입력 후 저장한다.
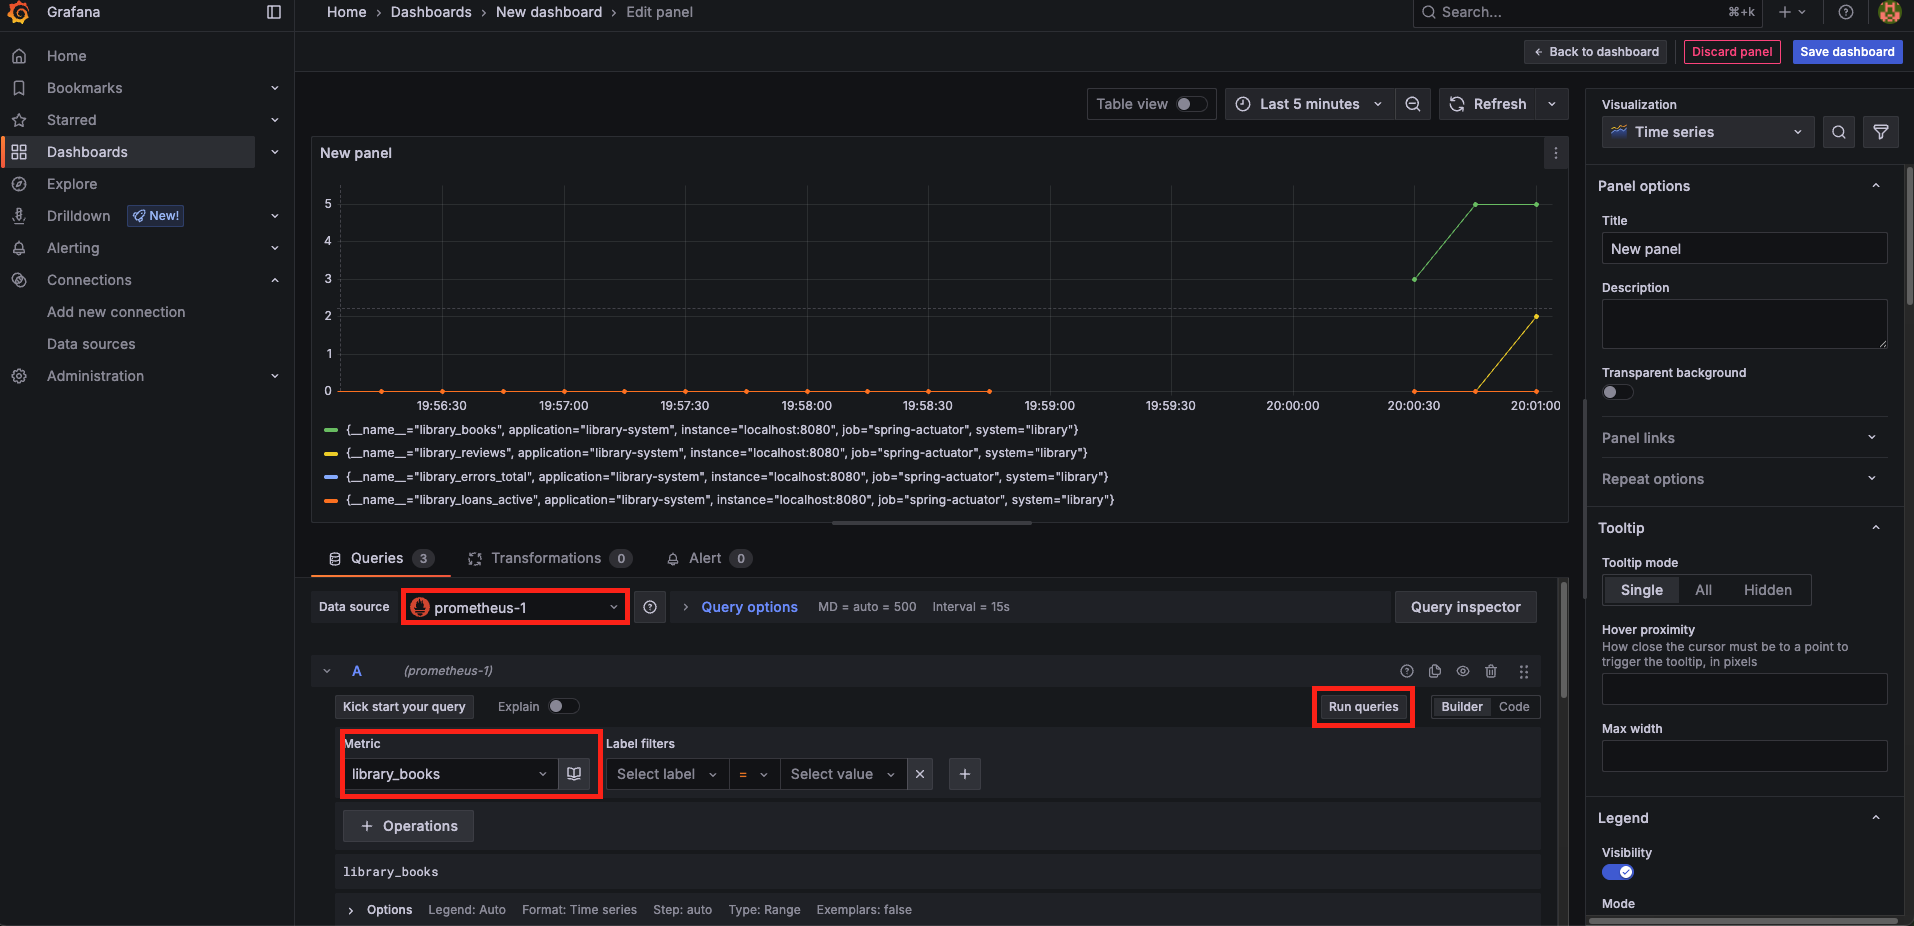
6. 대시보드 및 패널 생성
- 대시보드를 생성한다. (Dashboard > New Dashboard)
- 조회를 원하는
Metrics필드를 선택 후Run queries버튼을 클릭한다. - 시각화 타입(Time series, Stat, Gauge)을 선택한다.
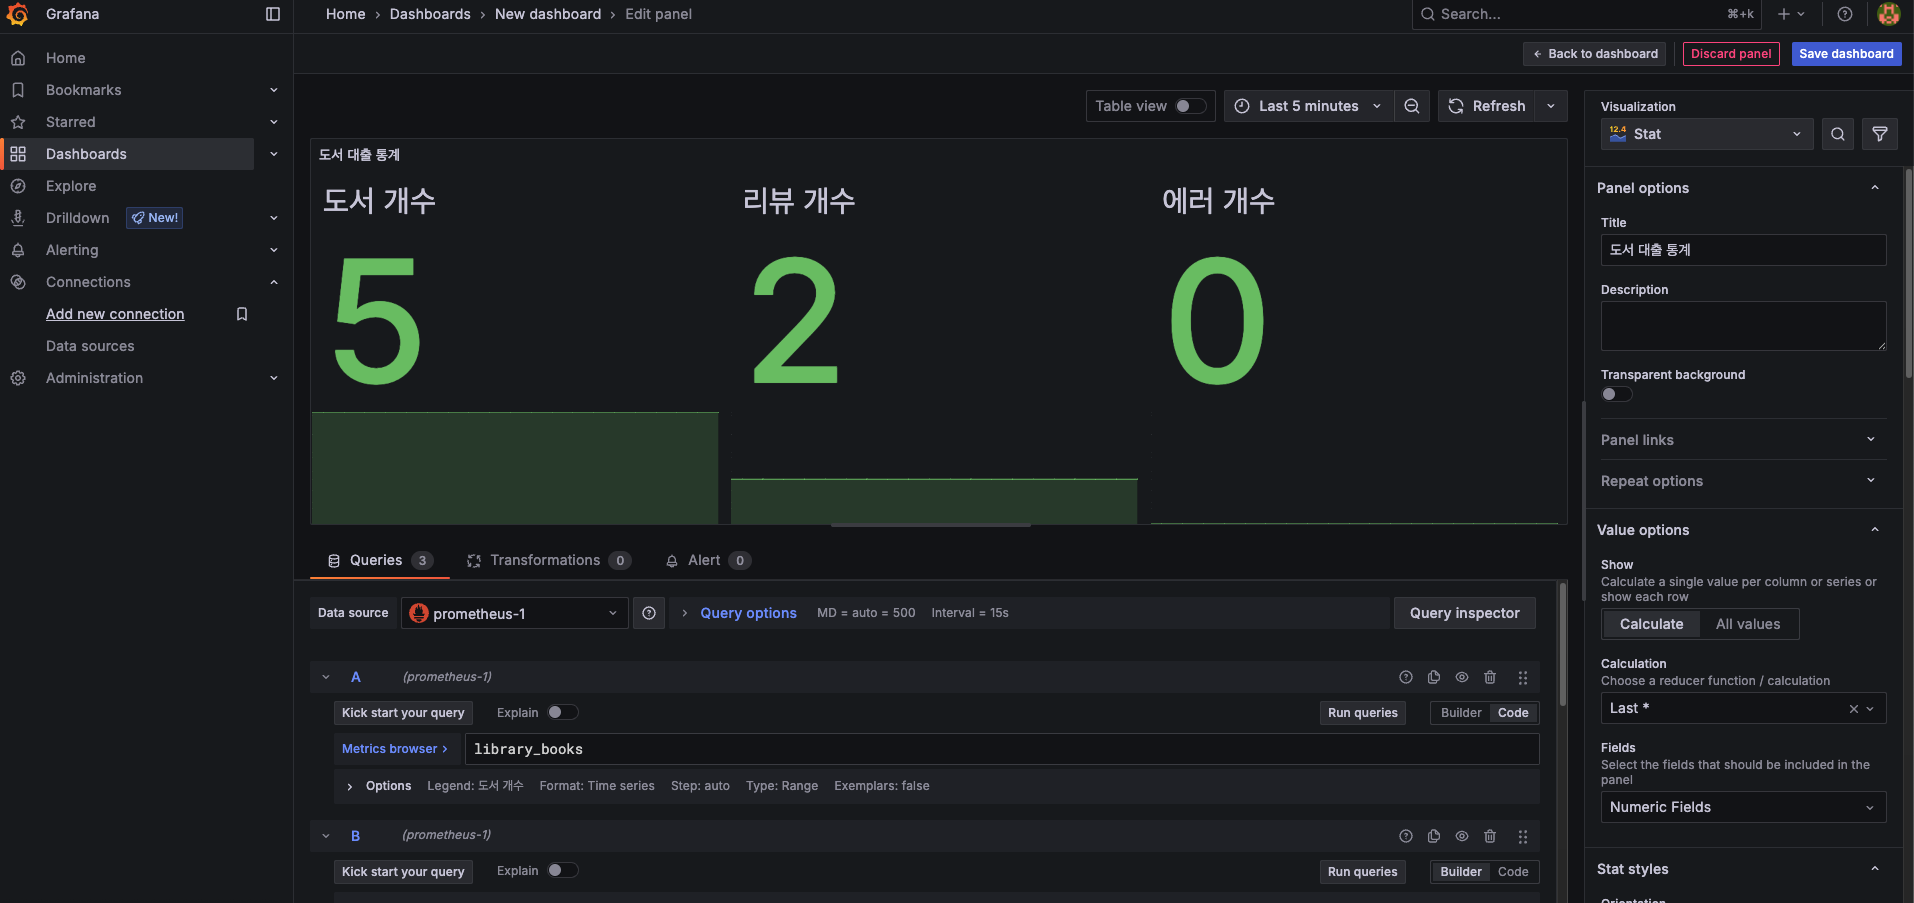
✅ 최종 결과

개발자로 성장하기

친절하게 운영체제 별로 설치 가이드 bb