Lighthouse CI를 통해 서비스 성능 지표를 빠르게 전달 받는 방법

웹사이트 성능 측정하기
최근 기능 우선 개발을 진행하다 보니 성능에 대해 깊게 고민하지 못해 항상 아쉬움이 있었습니다. 코드의 문제보다 근본적인 성능을 개선하기 위해 성능 측정하는 도구가 필요했고 그중에서 Lighthouse를 알고 있었고 수동으로 측정하지 않고 코드 푸시나 PR을 생성할 때 성능 지표를 직접 받는 방법이 없을까 해서 찾아보다가 Lighthouse CI를 알았고 이를 통해 Github Actions을 통해 CI를 구축해보도록 하겠습니다.
Lighthouserc 구축하기
module.exports = {
  ci: {
    collect: {
      startServerCommand: 'pnpm run dev', // 서버 실행
      startServerReadyPattern: 'ready on',
      url: ['http://localhost:3000'], // 실행할 주소
      numberOfRuns: 3, // 실행 횟수
      settings: {
        preset: 'desktop',
      },
    },
    upload: { // 레포트 생성
      target: 'filesystem',
      outputDir: './lhci_reports',
      reportFilenamePattern: '%%PATHNAME%%-%%DATETIME%%-report.%%EXTENSION%%',
    },
    assert: { // 점수 기준 정리
      assertions: {
        'categories:performance': ['warn', { minScore: 0.8 }],
        'categories:accessibility': ['warn', { minScore: 0.8 }],
        'categories:best-practices': ['warn', { minScore: 0.8 }],
        'categories:seo': ['warn', { minScore: 0.8 }],
      },
    },
  },
};
Github Actions 연동하기
pnpm setting
 - name: Install pnpm // pnpm 설치
        uses: pnpm/action-setup@v3
        with:
          version: 8
          run_install: false

      - name: Get pnpm store directory
        shell: bash
        run: |
          echo "STORE_PATH=$(pnpm store path --silent)" >> $GITHUB_ENV

      - name: Setup pnpm cache
        uses: actions/cache@v4
        with:
          path: ${{ env.STORE_PATH }}
          key: ${{ runner.os }}-pnpm-store-${{ hashFiles('**/pnpm-lock.yaml') }}
          restore-keys: |
            ${{ runner.os }}-pnpm-store-

      - name: Install dependencies
        run: pnpm install
Build 및 Lighthouse CI 동작
- name: Run Lighthouse CI // Lighthouse 실행
        env:
          LHCI_GITHUB_APP_TOKEN: ${{ secrets.LHCI_GITHUB_APP_TOKEN }}
        run: |
          pnpm i -g @lhci/cli
          lhci autorun || echo "Fail to Run Lighthouse CI!"

      - name: Generate and Upload Lighthouse Report // 레포트 생성
        env:
          LHCI_GITHUB_APP_TOKEN: ${{ secrets.LHCI_GITHUB_APP_TOKEN }}
        run: |
          lhci collect --additive
          lhci upload --target=filesystem --outputDir=./lighthouse-reports
          lhci upload --target=temporary-public-storage
Lighthouse 점수 및 코멘트 전송
아래 스크립트를 실행해 Lighthouse에서 얻어낸 점수 평균과 레포트 내용을 PR comment로 전송하는 로직이다
const fs = require('fs');
const path = require('path');
const resultsPath = path.join(process.env.GITHUB_WORKSPACE, 'lhci_reports', 'manifest.json');
const results = JSON.parse(fs.readFileSync(resultsPath));
const totalReports = results.length;

// best-practices은 문자열로 저장 ( Lighthouse 지표 )
 const averageScores = {
  performance: 0,
  accessibility: 0,
  'best-practices': 0,
  seo: 0,
  pwa: 0
 };

// Lighthouse 상세 지표
const auditSummaries = {
 'first-contentful-paint': 0,
 'largest-contentful-paint': 0,
 'interactive': 0,
 'total-blocking-time': 0,
 'cumulative-layout-shift': 0
};

// 점수 평균
results.forEach(result => {
  const { summary } = result;
   for (const key in averageScores) {
    averageScores[key] += summary[key];
}

const details = JSON.parse(fs.readFileSync(result.jsonPath));
['first-contentful-paint', 'largest-contentful-paint', 'interactive', 'total-blocking-time', 'cumulative-layout-shift'].forEach(auditName => {
  if (details.audits[auditName]) {
     const auditDetails = details.audits[auditName];
      auditSummaries[auditName] += parseFloat(auditDetails.displayValue) || 0;
     }
  });
});

// 점수에 따른 색상 표시
const formatScore = res => (res >= 90 ? "🟢" : res >= 70 ? "🟠" : "🔴");

// 상세 지표의 표준 점수에 따른 색상 표시
const detailscore = (value, metric) => {
  switch (metric) {
	case 'first-contentful-paint':
       return value <= 1.8 ? "🟢" : value <= 3 ? "🟠" : "🔴";
    case 'largest-contentful-paint':
       return value <= 2.5 ? "🟢" : value <= 4 ? "🟠" : "🔴";
    case 'interactive':
       return value <= 3.8 ? "🟢" : value <= 7.3 ? "🟠" : "🔴";
    case 'total-blocking-time':
      return value <= 300 ? "🟢" : value <= 600 ? "🟠" : "🔴";
    case 'cumulative-layout-shift':
      return value <= 0.1 ? "🟢" : value <= 0.25 ? "🟠" : "🔴";
    default:
     return "🔴"; // Default to red if metric is unknown
    }
};

let comments = "⚡️ Lighthouse Average Scores Across Reports:\n| Category | Score |\n| --- | --- |\n";
Object.keys(averageScores).forEach(key => {
  const avgScore = Math.round((averageScores[key] / totalReports) * 100);
  comments += `| ${formatScore(avgScore)}  ${key.replace(/-/g, ' ')} | ${avgScore} |\n`;
});

comments += "\n⚡️ Average Details Across All Reports:\n| Category | Score |\n| --- | --- |\n";
Object.keys(auditSummaries).forEach(auditName => {
  const average = auditSummaries[auditName] / totalReports;
  const formattedName = auditName.replace(/-/g, ' ');
  const colorCode = detailscore(average, auditName);
  const unit = (auditName === 'total-blocking-time' ? 'ms' : auditName === 'cumulative-layout-shift' ? '' : 's')
  comments += `| ${colorCode}  ${formattedName} | ${average.toFixed(1)}${unit} |\n`;
            });

// PR 전송
  if (comments && context.issue.number) {
    const issue_number = context.issue.number;
    const repo = context.repo.repo;
    const owner = context.repo.owner;
    await github.rest.issues.createComment({
      owner,
      repo,
      issue_number,
      body: comments
    });
  } else {
   console.log("No PR COMMENT!");
}
Github Actions 확인하기
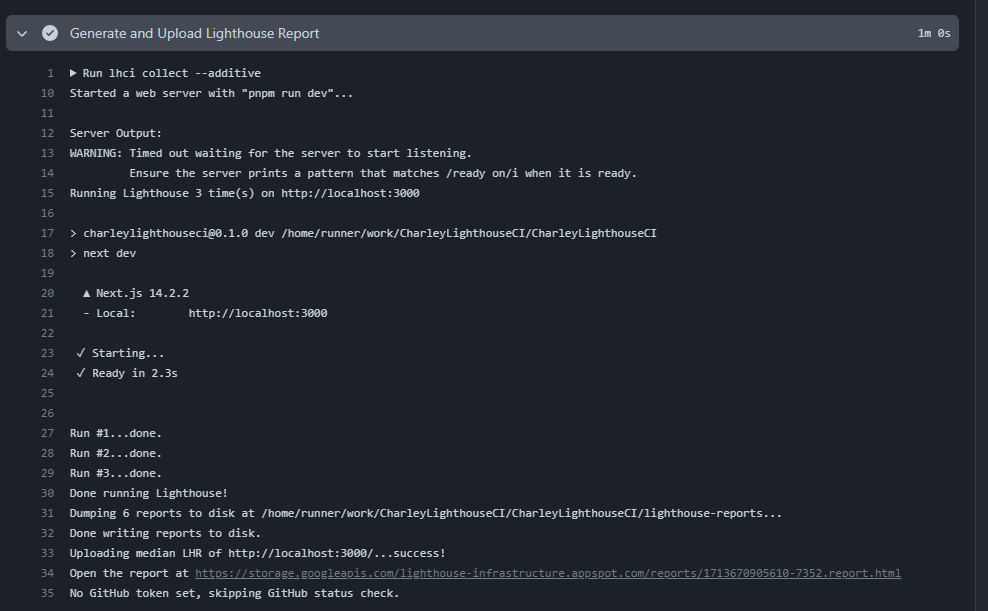
아래 사진처럼 report를 출력하면 성능 지표를 바로 확인할 수 있다. 현재 따로 구현하지 못했지만 아래 링크를 활용한다면 PR Comment에 함께 남길 수 있을 거 같습니다.
코멘트 확인하기
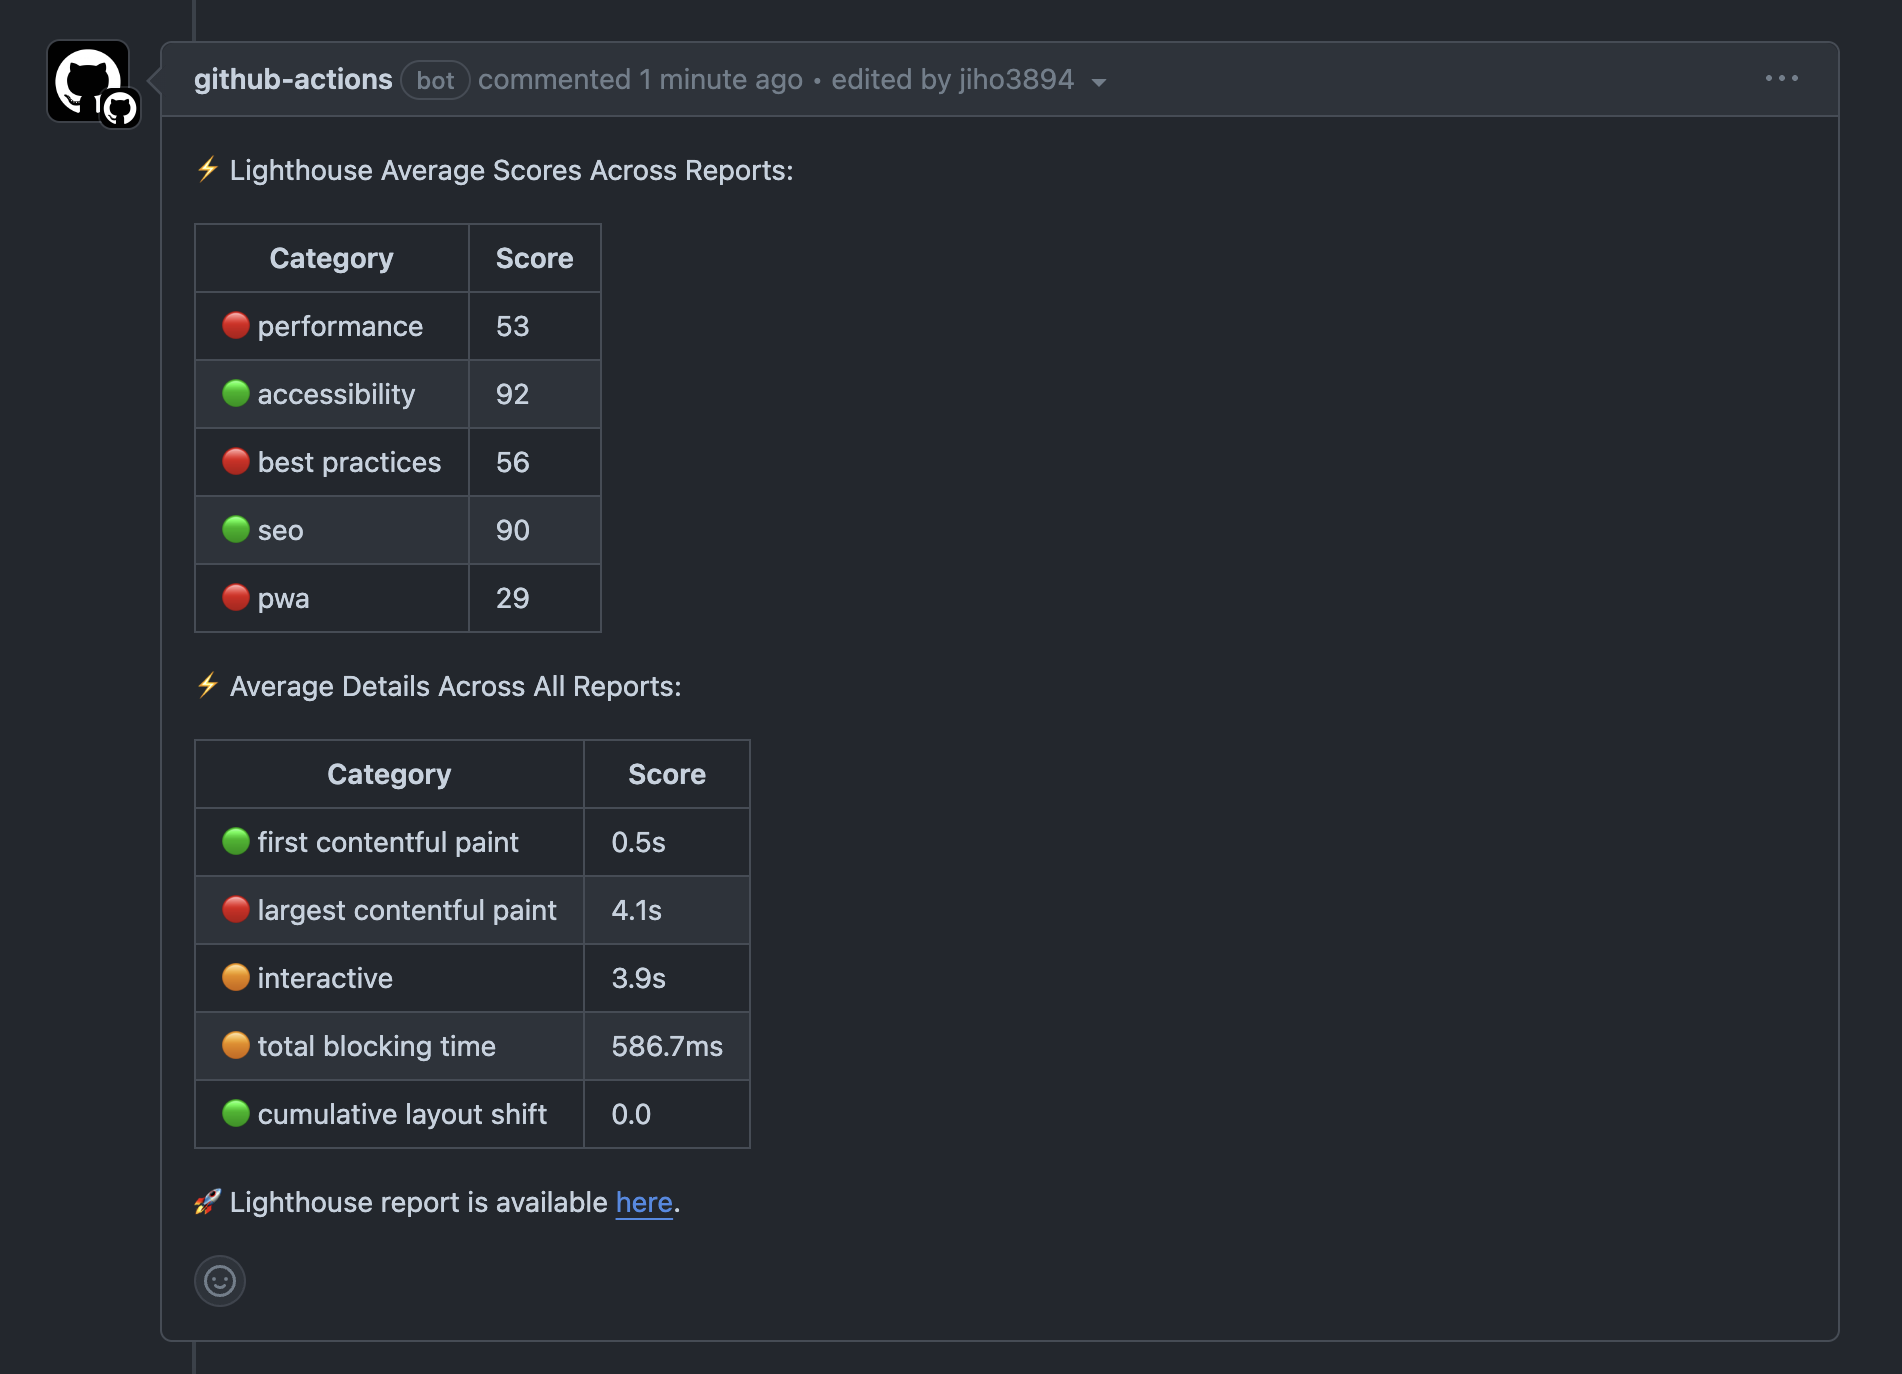
아래 사진처럼 각 성능에 따른 점수를 확인하고 상세 지표까지 확인할 수 있습니다. 역시나 성능은 많이 떨어진 상태 이 부분을 지속해서 확인하면서 경각심을 가질 수 있을 거 같습니다.
도전 과제 및 출처
도전 과제
- report 서버 URL을 actions 환경에서만 확인할 수 없는 상황
- 초기 페이지만 검사할 수 있는 문제
- pnpm 캐싱 처리
출처

프론트엔드 개발자 김찰리