Owning shares of company profits is a popular investment method, attracting investors of all types. The vast stock market offers opportunities for small to large investors, providing a diverse investment style for all participants.
Equity markets offer a wide range of investment vehicles, including small cap stocks, blue chips, ETFs, and derivatives. Using investment algorithms provides opportunities for edge, with banks and investment institutions incentivizing this.
Equity markets facilitate the trading of equity-based investments, allowing buyers to allocate money to company stock, giving them a share of ownership. The goal is to profit from the institution's growth. Direct stock ownership is the simplest form of equity investment, allowing individuals to invest in thousands of publicly traded companies in the US and international markets.
Direct stock control isn't the only stock market participation method. Alternatives like mutual funds, ETFs, index funds, and options offer alternative equity investments. Selecting the right instrument is a challenge for money managers and investors.
Market Participants
The equities market is a complex system of participants with diverse goals and interests. Large institutions, such as investment banks and exchanges, are the backbone of the market, buying and selling large volumes of equity investment vehicles daily. Common players include mutual funds, hedge funds, investment banks, high-frequency trading funds, brokerage companies, pension funds, and retail investors. Mutual funds receive investments from retail investors and institutions, making investments in areas with higher returns. Hedge funds use advanced techniques, while investment banks actively work on market composition and introduce new issues. High-frequency trading funds use high-performance computational techniques to provide instant liquidity and make small profits. Brokerage companies work directly with individual investors, while pension funds hold large pools of investment money for long-term growth. Retail investors make their own decisions on market purchases and sales.
Moving Average
Technical analysis (TA) is a widely used strategy for analyzing equity instruments like stocks and ETFs. It involves observing price and volume as important variables, focusing on price points like support, resistance, trend lines, and moving averages. These psychological price points, which are self-reinforcing, play a crucial role in the dynamics of equity trading. High resistance prices, support prices, and moving averages are used to identify profitable pricing regions.
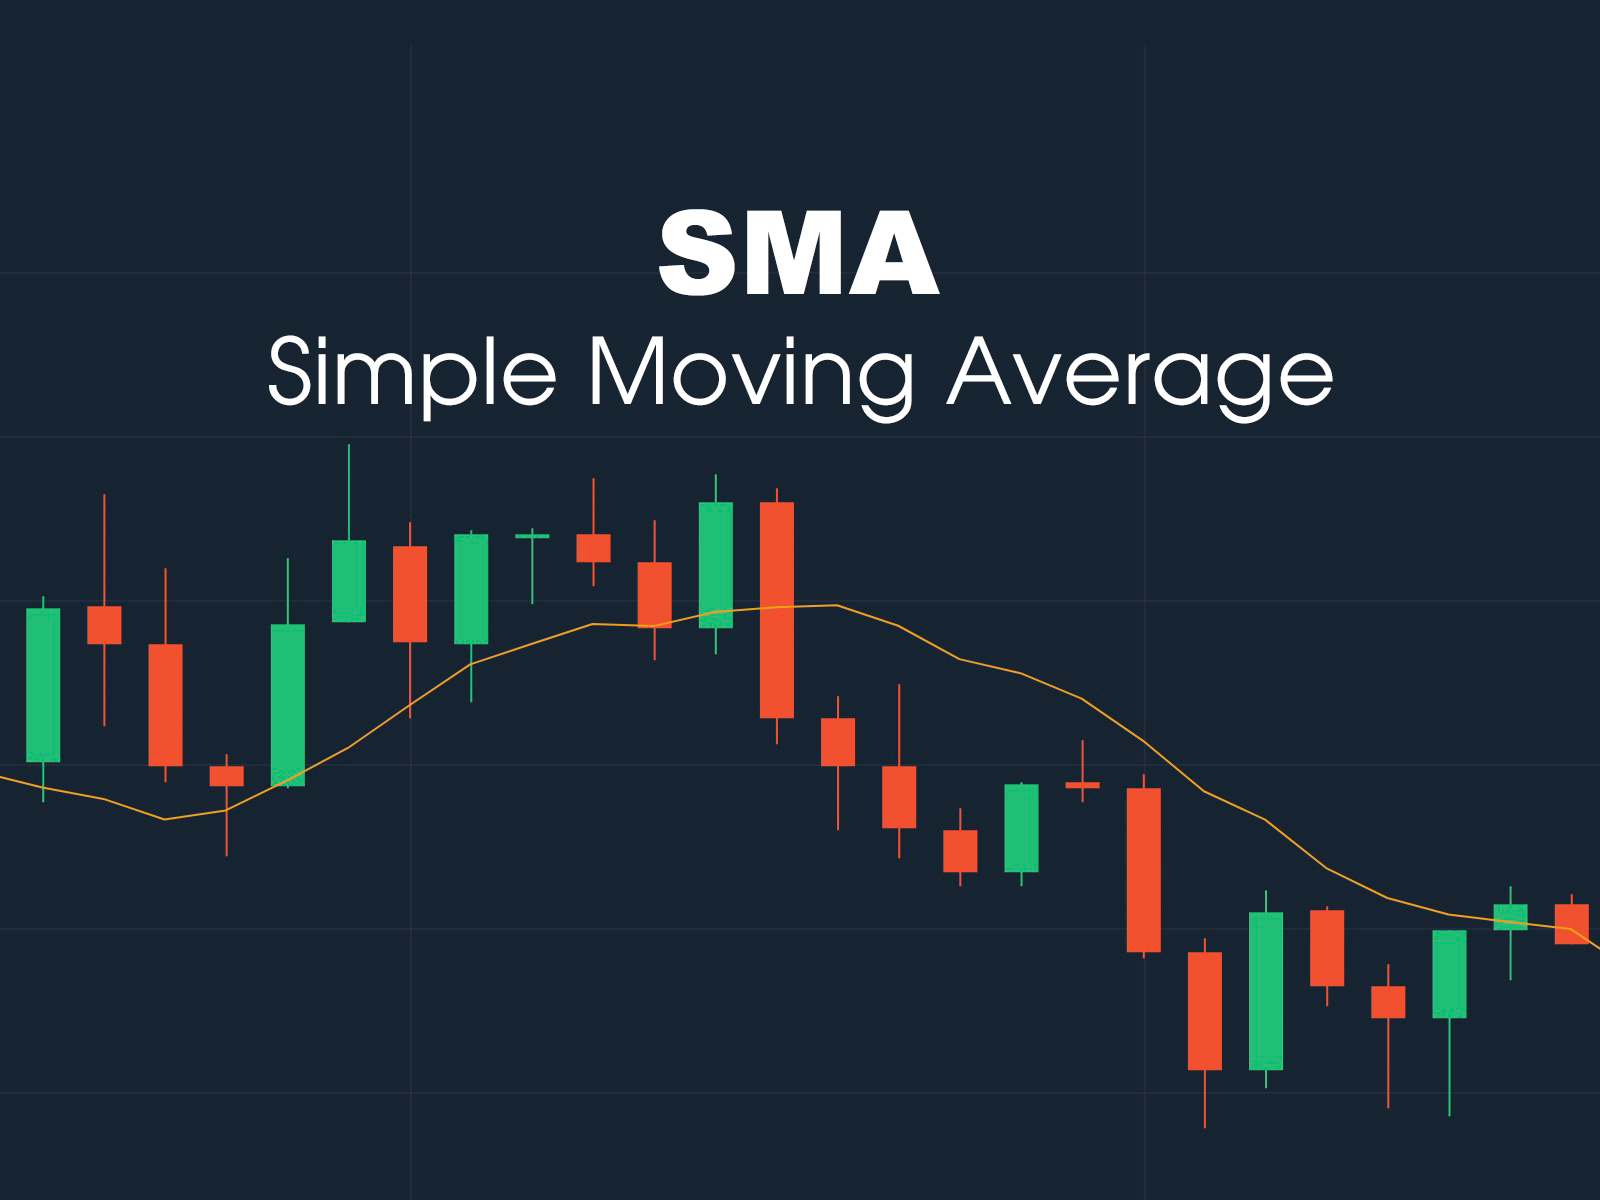
The moving average can be calculated using a simple formula for each new period, , which can be easily updated with new values.
The exponential moving average (EMA) is a more responsive indicator of trends due to its factor-based approach, allowing for quicker and more accurate identification of new trends compared to simple moving averages. The EMA initializes the sequence using a sum variable until at least N values are observed, with results convergent after a few iterations.
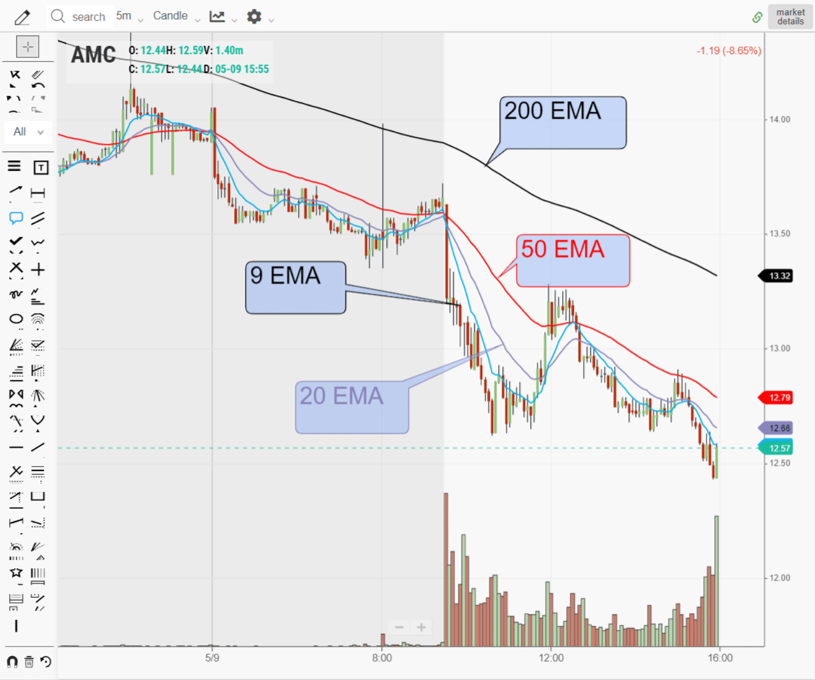
The EMA calculation involves adding new values weighted by a default multiplier, , making it more responsive to price changes than the simple moving average.
Volatility
Stocks and other equity instruments are highly volatile, with prices changing throughout the trading day. This volatility is crucial when comparing investment options, as different stock types have different volatility profiles. However, volatility is not a one-dimensional concept; different investment strategies require different ways of viewing price variations, making it essential to consider both advantages and disadvantages.
There are three ways to measure volatility given a sequence of prices.
-
Volatility can be measured using three strategies: computing the range of observed values, calculating the highest and lowest values, and comparing the difference, which is a common indicator used by investors.
-
The second strategy involves calculating the average range for a specific time period, often used in investment strategies to chart the rate of change for a stock by observing daily ranges.
-
Standard deviation is a statistical measure of the variation in values of an equity instrument, derived from the expected value of a set of prices.
Correlation
Money managers face the challenge of diversifying a portfolio due to the risk of having all assets in the same investment type. Correlated investments, like Coca-Cola and Pepsi, tend to rise and fall simultaneously, making it difficult to avoid losses. Correlation, a mathematical concept, is crucial in the equities market as probability plays a significant role in equity-based investments.
Fundamental Indicators
Technical indicators analyze price changes in equity instruments, allowing for the TA of past price and volume data. Fundamental information, including company earnings, intellectual property, physical assets, and debt, is another way to analyze a stock's quality. Disclosure of fundamental information is required from public companies and released every quarter for most publicly traded stocks. This information helps investors make decisions about buying, selling, or holding an investment vehicle.
- The price-earnings ratio (P/E) measures the cost of a company's stock compared to other companies with similar earnings.
- The book value represents the current assets on the balance sheet, without considering market factors.
- The price-to-book ratio (P/B) divides stock price by assets minus liabilities, considering only tangible assets.
- The PEG indicator compares companies with similar P/E but different growth rates.
- EBITDA measures profit before taxes and expenses.
- Return on equity (ROE) determines net income generated based on shareholders' equity.
- Forward P/E is a forecast made by analysts for the next quarter, indicating whether revenue will increase, decrease, or stay at the same levels. These indicators help investors understand a company's financial health.