Perf
본 프로젝트에서는 프로그램의 성능과 메모리 접근 패턴을 분석하기 위한 도구로써 ‘perf’를 사용한다. perf는 리눅스 시스템에서 성능을 분석하는 도구다. perf툴을 이용하여 조회할 수 있는 이벤트들은 크게 네 종류로 구분된다.
1. 하드웨어 이벤트 / 하드웨어 캐시 이벤트
2. 커널에서 제공하는 SW 이벤트 (page fault, context-switch..)
3. Trace point 이벤트
4. 사용자 정의 probe 이벤트
프로젝트에서는 위 네 종류의 이벤트 중 하드웨어 이벤트/하드웨어 캐쉬 이벤트를 이용하여 학습 샘플을 수집한다. perf로 측정할 수 있는 하드웨어 이벤트에는 cache의 상태를 나타내는 지표들이 많이 포함되어 있어 메모리 접근 패턴을 분류하는 것에 도움을 받을 수 있다.
프로그램이 동작하면서 L1/L2/L3의 캐시 히트정도, TLB의 히트 정보를 보며 메모리 접근 패턴을 파악할 수 있고, CPU 사이클과 같은 CPU 이벤트 정보 등도 알 수 있다. 나아가 시스템의 page-fault, context-switch 등도 파악할 수 있다.
perf began as a tool for using the performance counters subsystem in Linux, and has had various enhancements to add tracing capabilities.
Performance counters are CPU hardware registers that count hardware events such as instructions executed, cache-misses suffered, or branches mispredicted. They form a basis for profiling applications to trace dynamic control flow and identify hotspots.
특징
- 특정 프로그램 또는 시스템 전체 성능 분석
- 각종 CPU에서 지원하는 PMU 기능제어
- 각종 이벤트(cpu-cycle, cache-misses) 정보 수집(카운트 기반)
- 수집된 성능분석 정보 기반 통계 view 제공(TUI, GUI 등)
- 커널 api(호출 정도) tracing 가능
효과
- 복잡, 다양해지는 각 커널 버전에 맞춰 성능분석
- 커널 또는 프로그램 속도 저하없이 성능 분석
- 각종 최신 CPU(x86, ARM ..)에도 이용가능
- 커널, 시스템과의 호환성 문제 및 성능저하 원인 분석 용이
perf 위치
리눅스 커널 소스 "/tools/perf/*" 경로에 존재한다. 커널 소스에 포함되어 있지만 단독 프로그램으로 실행 파일이 만들어진다. 즉 단독 에플리케이션(도구 프로그램, tool)으로 실행가능하다.
// perf 설치, uname-r(설치된 커널 버전을 가져오는 쉘명령)과 함께 perf 실행에 관련된 패키지들 설치
$ sudo apt-get install linux-tools-common linux-tools-generic linux-tools-`uname -r`

// perf 설치 위치 확인
$ sudo apt-get install linux-tools-common linux-tools-generic linux-tools-`uname -r`
// /usr/bin/에 설치됨.
perf가 호출하는 시스템 콜
perf는 커널 내부로 "perf_event_open" 시스템 콜 함수를 통하여 접근.
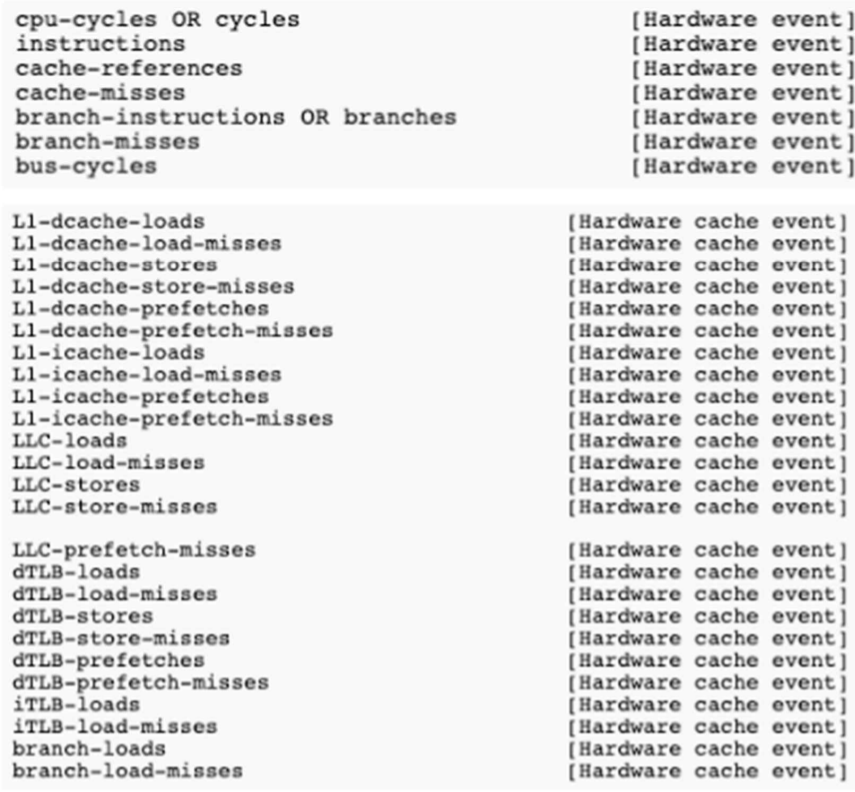
perf 카운팅 항목 리스트
$ perf list
branch-instructions OR branches [Hardware event]
branch-misses [Hardware event]
bus-cycles [Hardware event]
cache-misses [Hardware event]
cache-references [Hardware event]
cpu-cycles OR cycles [Hardware event]
instructions [Hardware event]
ref-cycles [Hardware event]
alignment-faults [Software event]
bpf-output [Software event]
context-switches OR cs [Software event]
cpu-clock [Software event]
cpu-migrations OR migrations [Software event]
dummy [Software event]
emulation-faults [Software event]
major-faults [Software event]
minor-faults [Software event]
page-faults OR faults [Software event]
task-clock [Software event]
perf 옵션
top 옵션
& perf top
=> see live event count
top 옵션을 주어 실행하면, 커널 내부에서 실행되고 있는 함수 별로의 오버헤드가 발생하는 비율을 스냅샷 형태로 보여준다.
stat 옵션
& perf top ...
=> obtain event counts
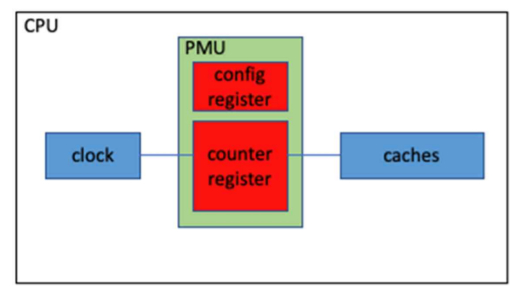
PMU(performance monitoring unit)
PMU는 counter register(PMC ,performance monitoring counter)와 configuration register로 구성되어 있으며 CPU 내부에 위치한다.
물리적으로 PMC와 하드웨어 유닛을 wire로 연결하면 하드웨어 이벤트 카운트를 측정할 수 있는데 각각의 하드웨어 유닛에 PMC들을 연결하기엔 공간상 한계(or 자원의 한계)가 존재한다. 따라서 하나의 PMC에 두 개 이상의 유닛을 연결하고 configuration register를 이용하여 측정하고 하는 이벤트를 선택할 수 있다.
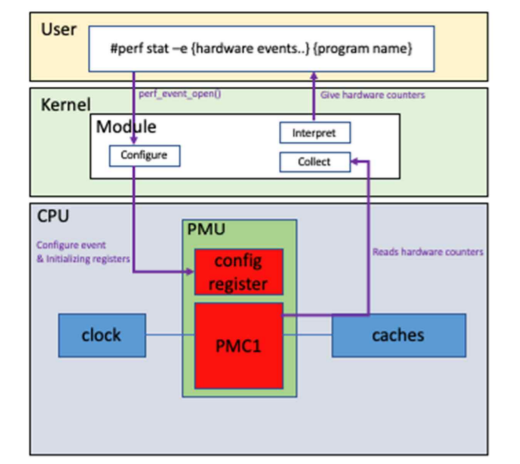
결국 perf는 이런 PMU에 엑세스하고 하드웨어 이벤트를 얻을 수 있는 인터페이스인 셈이다. PMU를 기반으로 하드웨어 이벤트가 수집되는 흐름은 다음과 같다.
-
user 딴에서 perf 명령어를 입력하여 내부적으로 perf_event_open() 시스템 콜이 호출된다. 이 시스템 콜이 호출되면 configure 모듈(커널)에서 사용자가 측정하고자 하는 값을 카운트하기 위한 셋팅이 이루어진다(configuration register 값 변경).
1.1. counter register(PMC)의 counter을 0으로 초기화
1.2. configure events that we want to measure
1.3. counter register을 enable counting하게 셋팅 -
셋팅이 끝나면 성능분석을 하고자 하는 프로그램을 실행시켜 counter register로 하드웨어 이벤트가 수집된다.
-
분석하고자 하는 프로그램이 실행을 완료하게 되면 counter register를 disenable counting으로 다시 셋팅한다.
-
collect 모듈(커널)에서 counter register에 저장된 값을 읽어오고 최종적으로 user에게 하드웨어 이벤트 카운트를 반환한다.