Library
import numpy as np
import pandas as pd
import seaborn as sns
import matplotlib.pyplot as plt

sns.set()-
numpy: The fundamental package for scientific computing with Python
⇒ 벡터, 행렬 등 수치 연산을 수행 / 선형대수 라이브러리 -
pandas: a fast, powerful, flexible and easy to use open source data analysis and manipulation tool, built on top of the Python programming language.
⇒ 데이터 분석에 사용 -
seaborn: Python data visualization library based on matplotlib
⇒ 시각화 라이브러리 -
matplotlib: a comprehensive library for creating static, animated, and interactive visualizations in Python
⇒ 데이터 시각화 패키지
-matplotlib.pyplot: a state-based interface to matplotlib
Data loading & Visualization
Boston house dataset
https://scikit-learn.org/stable/modules/generated/sklearn.datasets.load_boston.html
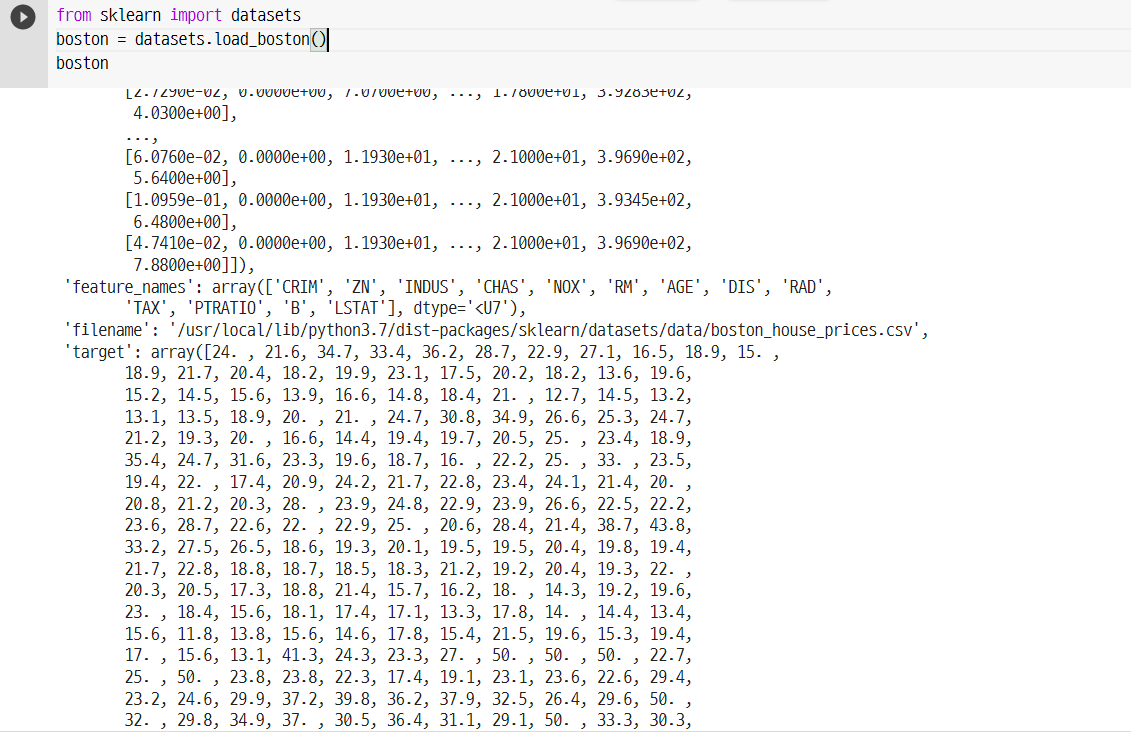
from sklearn import datasets
boston = datasets.load_boston()
boston
scikit-learn: Machine Learning in Python
https://scikit-learn.org/stable/
feature data 이름 확인
boston.feature_names
boston 데이터셋 설명
The full description of the dataset
print(boston.DESCR)
The regression target
boston.target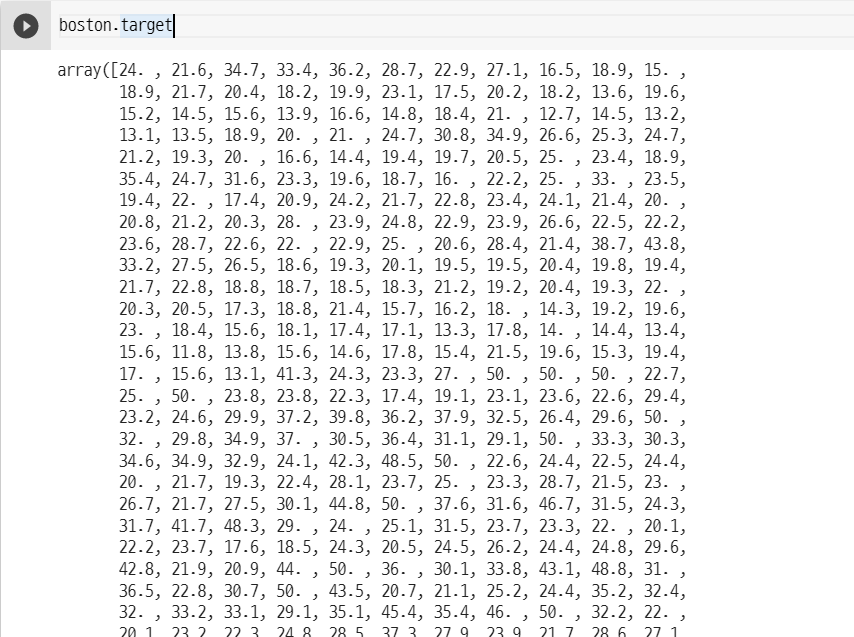
Boston data to pandas data frame
df = pd.DataFrame(boston.data, columns=boston.feature_names)
df['PRICE'] = boston.target

# 상위 5행 가져오기
print(df.head())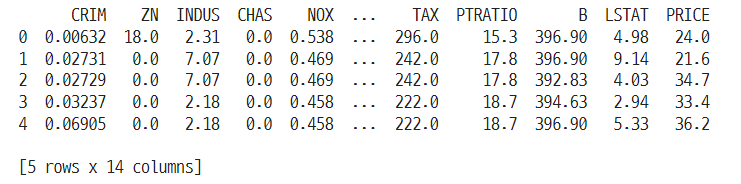
각 열에서 NaN 발생 수 확인하기
df.isnull().sum()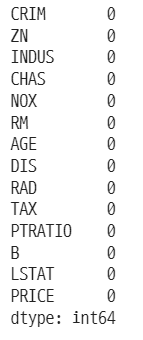
- NaN 값이 없는 걸 확인할 수 있음
Data visualization
변수에 대한 히스토그램을 표시
sns.histplot(data=df, x="PRICE")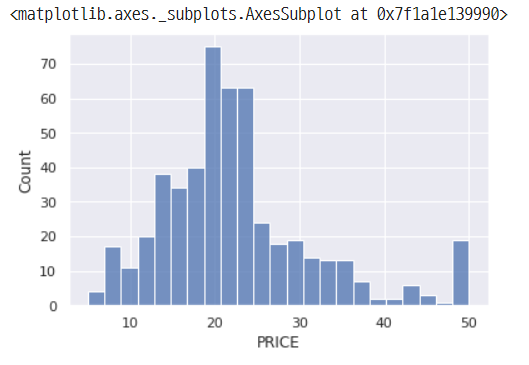
히트맵
corr_matrix = df.corr().round(2)
f, ax = plt.subplots(figsize=(10, 10))
sns.heatmap(data=corr_matrix, annot=True)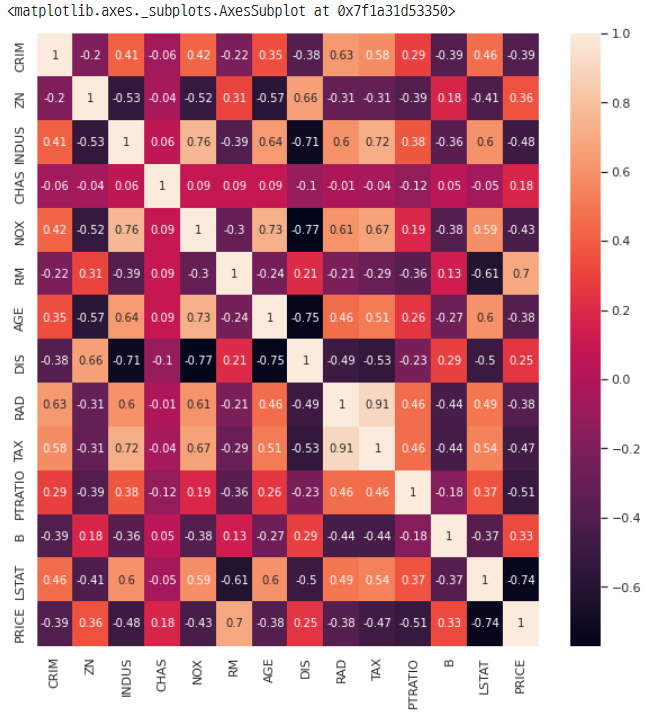
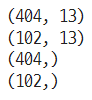
Data split (use train_test_split)
from sklearn.model_selection import train_test_split

X_train, X_test, y_train, y_test \
= train_test_split(boston.data, boston.target, test_size=0.2, random_state=5)

print(X_train.shape)
print(X_test.shape)
print(y_train.shape)
print(y_test.shape)train데이터와test데이터를 80%, 20%로 나눔random_state: 수행시마다 동일한 결과를 얻기 위해
train, test = train_test_split(df, test_size=0.2, random_state=5)

print(train.shape)
print(test.shape)
y = df.pop('PRICE')
X = df

X_train, X_test, y_train, y_test \
= train_test_split(X, y, test_size=0.2, random_state=5)

print(X_train.shape)
print(X_test.shape)
print(y_train.shape)
print(y_test.shape)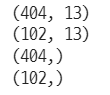
Linear regression
from sklearn.linear_model import LinearRegression
lin_reg = LinearRegression()
lin_reg.fit(X_train, y_train)
///////////////////임시