
모델 평가의 필요성
우리는 데이터로 다양한 모델을 사용할 수 있다. 그러나 데이터의 유형은 여러가지이고 데이터에 맞지 않은 모델을 사용한다면 그 결과는 당연히 좋은 결과를 도출해내지 못할 확률이 높다. 그렇기에 데이터에 맞는 모델은 무엇이며, 모델이 얼마나 좋은지에 대한 측정할 필요가 있다.
회귀 모델의 성능 평가
- Mean Absolute Error(MAE)
: 실제 값과 예측 값 사이의 절대 오차 평균
 import numpy as np

 def mae(y_true, predictions):
 	y_true, predictions = np.array(y_true), np.array(predictions)
return np.mean(np.abs(y_true - predictions)- Mean Absolute Percentage Error(MAPE)
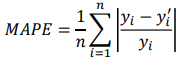
- MAE는 실제 값과 예측 값의 차이에 대한 정보만 제공. 상대적인 정보를 제공하지 못한다.
- 실제 값 대비 예측 값이 얼마나 차이가 있는지 %로 표현 -> 상대 오차 추정시 사용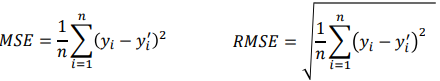
def mape(y_test, pred):
	y_test, pred = np.array(y_test), np.array(pred)
    mape = np.mean(np.abs((y_test - pred) / y_test)) * 100

return mape- Mean Squared Error(MSE) & Root Mean Squared Error(RMSE)
- 부호의 영향을 제거하기 위해 제곱을 취한 지표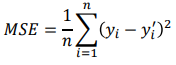
MSE

def mse(y_test, pred)
	y_test, pred = np.array(y_test), np.array(pred)
    mse = np.square(np.substract(y_test - pred)).mean()

    return mse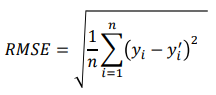
RMSE

import math

def RMSE(y_test, pred):
	y_test, pred = np.array(y_test), np.array(pred)
    rmse = math.sqrt(mse)
Binary Class
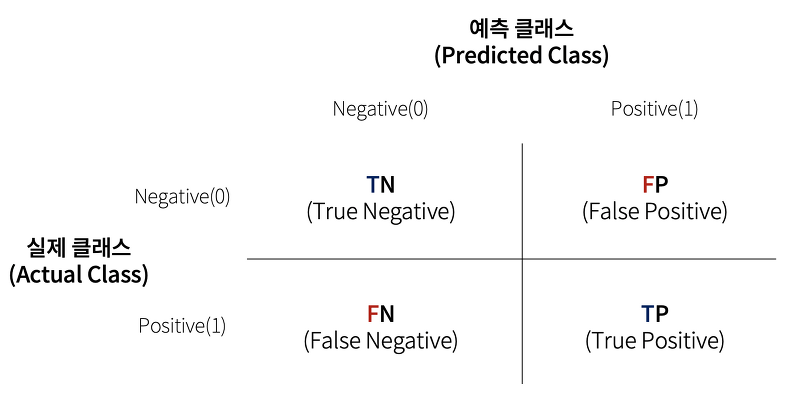
Confusion Matrix(오차행렬)
: Confusion Matrix 란 Training을 통한 Prediction 성능을 측정하기 위해 예측 value와 실제 value를 비교하기 위한 표 이다.
-
Accracy (정확도)
: 전체에서 모델이 바르게 분류한 비율

-
Precision (정밀도)
: 모델이 Positive(긍정)라 분류한 것 중 실제값이 Positive인 비율

-
Recall (재현율)
: 실제값이 Positive 인 것 중 모델이 Positive라 분류한 비율

-
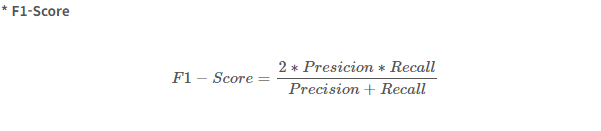
F1 Score
: Precision과 Recall의 조화 평균
Accuracy가 아닌 F1 Score를 쓰는 경우는 데이터가 불균형할 때 이다.
최적의 Threshold(임계값) 설정하기
-
일반적으로 분류(classification)문제에서는 특정 범주에 속할 확률 값을 생성한다.
-
동일한 확률 값에서도 threshold를 어떻게 설정하느냐에 따라 분류 성능이 다르다.
-
여러 분류 모델간의 정확한 비교를 위해서는 threshold에 영향을 받지 않는 지표가 필요하다.
-
Receiver-operatig Characteristic(ROC) Curve, Precision-Recall Curve 등
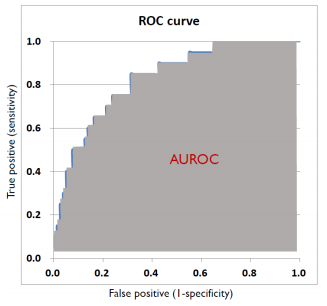
ROC curve
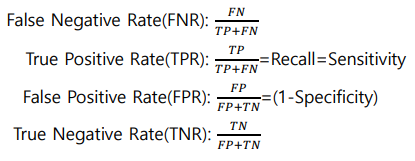
- X축은 1-specufuity(특이도), Y축은 Sensitivity(민감도)인 곡선
- 즉, X축은 FPR, Y축은 TPR인 곡선이다.
- FPR에 따른 TPR의 변경 추이를 나타낸 곡선
- Threshold를 바꿔가면서 FPR과 TPR의 변화를 함께 나타낸 곡선
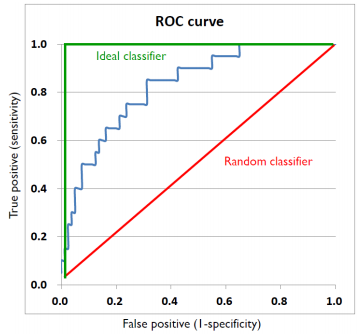
AUROC (Area Under ROC Curve)
- ROC Curve 아래의 면적
- 이상적인 분류기는 ROC=1, 무작위 분류기=0.5 이다.
- Threshold에 무관한 성능 평가 지표로 사용할 수 있다.

please bbbbbbbbb 😂