
현재 진행하고 있는 동아리 홈페이지 제작 중에 Sentry를 미리 도입해서 바로 에러를 추적할 수 있게끔 하기 위해서 Sentry를 도입했습니다.
Sentry란?
애플리케이션에서 오류가 발생하면 알려주는 강력한 에러 트래킹 서비스입니다.
Sentry 적용 방법
- sentry.io에 회원가입을 합니다.
- 회원가입 후 'Project'를 생성해서 플랫폼을 선택합니다.
- npm으로 프로젝트에 설치합니다.
npm install @sentry/nextjs --save
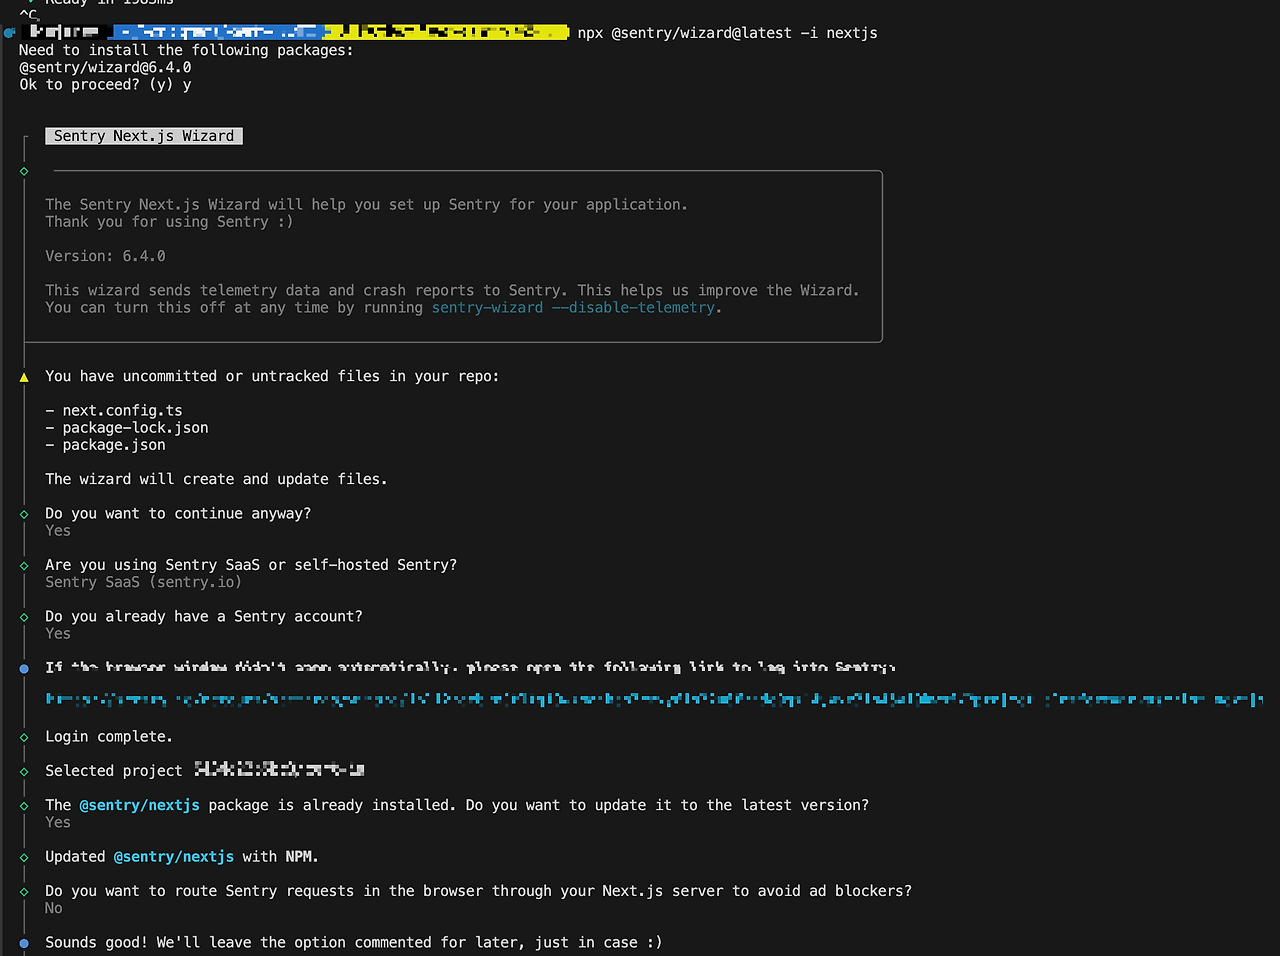
npx @sentry/wizard@latest -i nextjs
(wizard는 설정할 사항을 y/n로 선택해서 설정할 수 있게 해줍니다.)
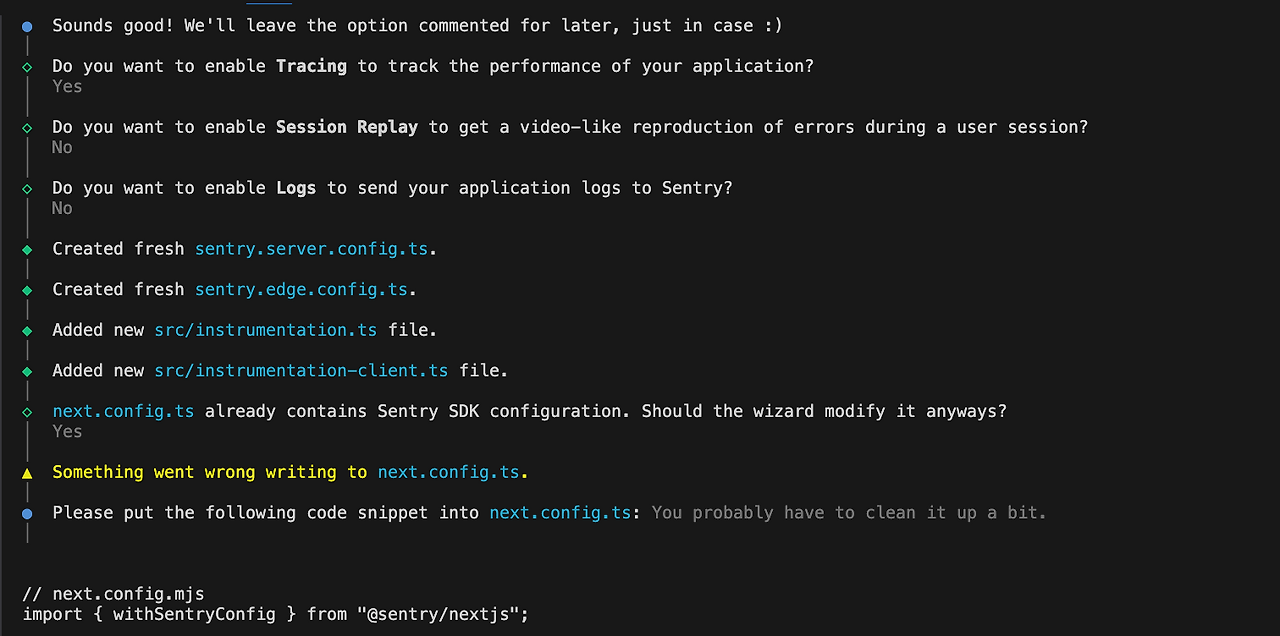
wizard 설치 시 아래처럼 나오게 됩니다. 각자 상황에 맞추어 선택하면 됩니다!
- sentry에서 발급받은
NEXT_PUBLIC_SENTRY_DNS를.env.local에 저장해둡니다.
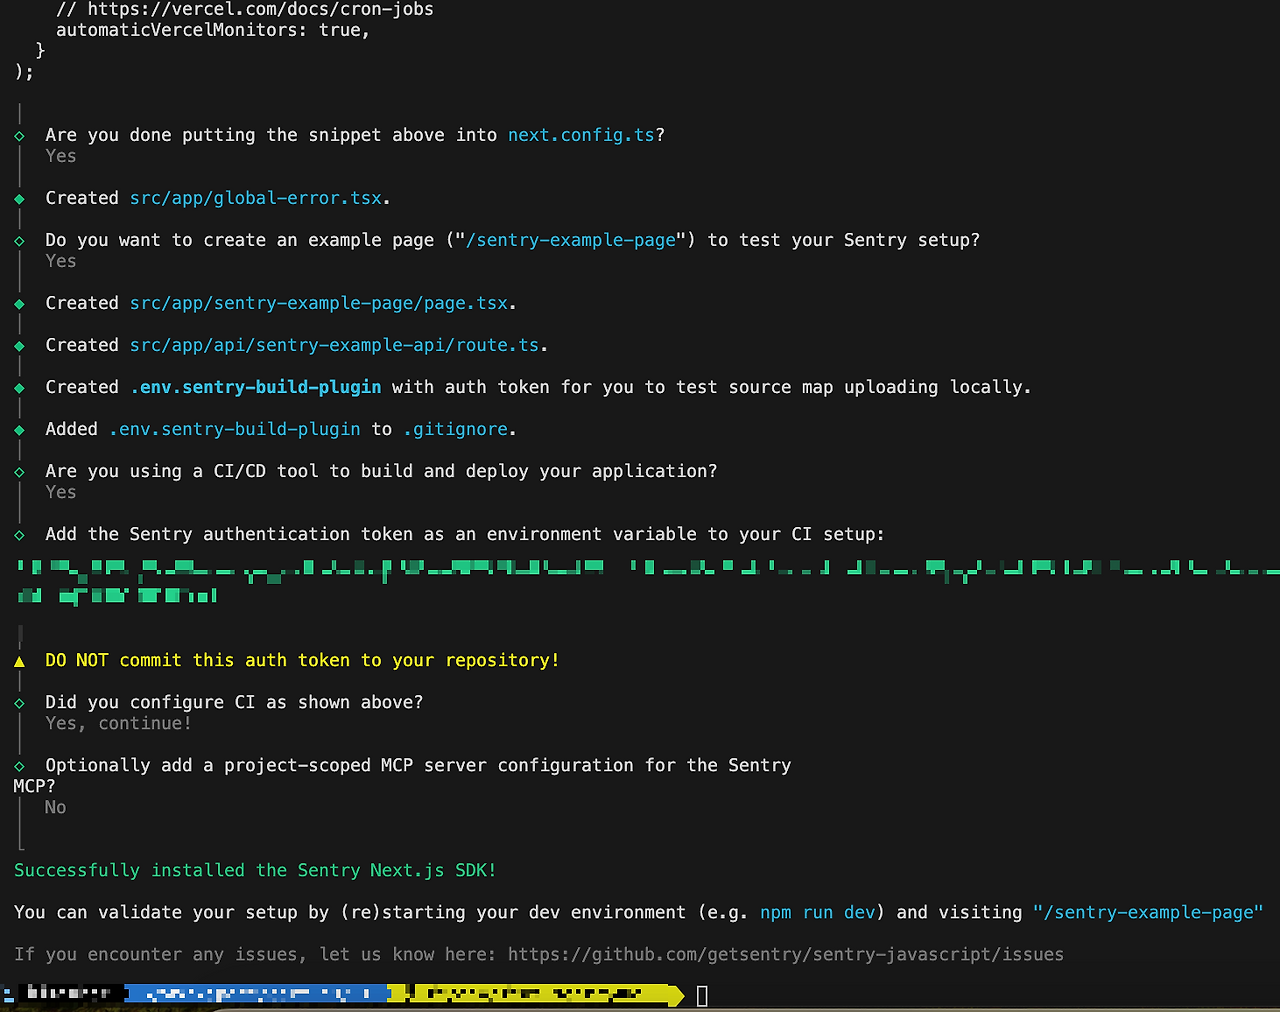
(배포 시에는 DNS와 SENTRY_AUTH_TOKEN도 환경변수로 추가해야 합니다.)
- 제공해준 page.tsx로 연결을 확인합니다.
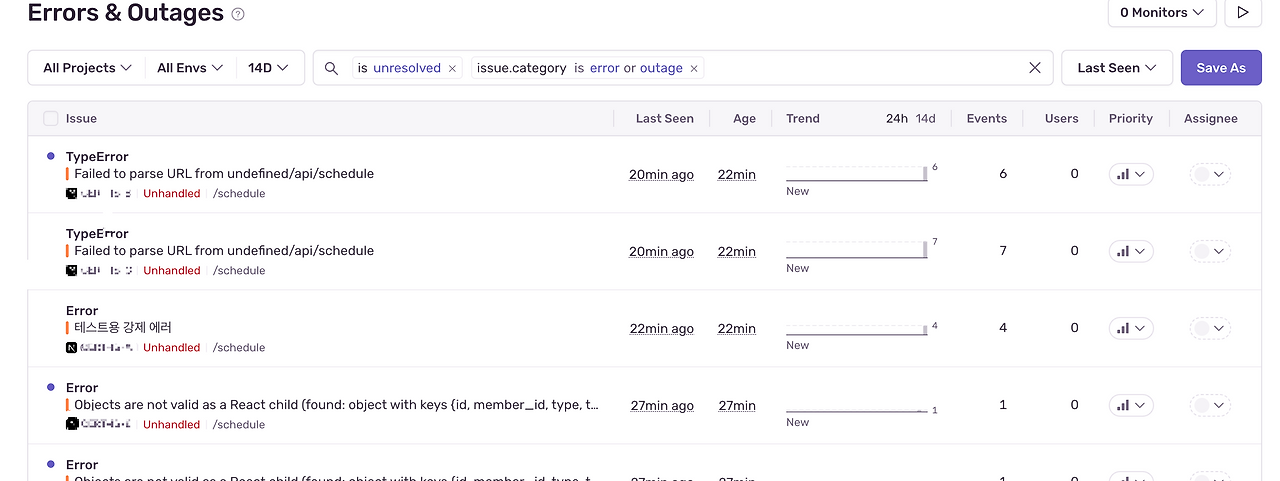
아래처럼 나오는 것을 확인할 수 있습니다!
파일 설명
sentry.server.config
- 서버 사이드에서만 동작하는 Sentry 설정을 적는 곳
- App Router의 서버컴포넌트 / API route에서만 적용됨.
- 예: API 라우트, 서버 컴포넌트, 백엔드 오류 추적
sentry.edge.config
- Next.js의 Middleware나 Edge Runtime에서 동작하는 코드용 설정
- middleware.ts / edge runtime API에서만 적용됨.
- 예: Edge Functions, Middleware 오류 추적
instrumentation-client
- 클라이언트 사이드(브라우저)에서 동작하는 Sentry 설정을 넣는 파일
- 클라이언트 초기화 시점에 실행됨
- 이전
sentry.client.config파일과 동일 (Next.js 13+ App Router 환경에서 클라이언트 초기화 로직을 이 파일로 통일함)
logger level 소개
trace
- 애플리케이션의 실행 흐름과 디버깅 정보 상세히 기록 (디버깅용)
debug
- 개발 단계에서 상세한 정보 기록 (디버깅용)
info
- 정보성 메시지 기록
- 애플리케이션의 주요 이벤트나 실행 상태에 대한 정보 전달
warn
- 경고성 메시지 기록
- 예상치 못한 문제나 잠재적 오류 상황을 알리는 메시지 (작동은 정상적으로 함)
error
- 오류 메시지 기록
- 심각한 문제, 예외 상황, 애플리케이션 작동에 영향을 미칠 수 있음
fatal
- 가장 심각한 오류 메시지 기록
- 애플리케이션 동작을 중단시킬 수 있는 치명적인 오류
공식문서 예시)
Sentry.logger.trace("Starting database connection", { database: "users" });
Sentry.logger.debug("Cache miss for user", { userId: 123 });
Sentry.logger.info("Updated profile", { profileId: 345 });
Sentry.logger.warn("Rate limit reached for endpoint", {
  endpoint: "/api/results/",
  isEnterprise: false,
});
Sentry.logger.error("Failed to process payment", {
  orderId: "order_123",
  amount: 99.99,
});
Sentry.logger.fatal("Database connection pool exhausted", {
  database: "users",
  activeConnections: 100,
});
실사용 예시) API 작업 시
onClick={async () => {
    await Sentry.startSpan(
      {
        name: "Example Frontend/Backend Span",
        op: "test",
      },
      async () => {
        const res = await fetch("/api/sentry-example-api");
        if (!res.ok) {
          setHasSentError(true);
          // API 실패를 로그로 기록
          Sentry.logger.fatal("API call failed from frontend", {
            status: res.status,
          });
        }
      }
    );

    const error = new SentryExampleFrontendError(
      "This error is raised on the frontend of the example page."
    );

    // error 수준 로그
    Sentry.logger.error("Frontend error occurred", { error });
    throw error; // 해당 코드는 런타임시 잡아서 자동으로 Sentry에 전송
}}
logger vs captureException 차이
Sentry.logger.<level>()
- debug/info/warn은 기본 설정에서는 서버로 전송되지 않고, 로컬 SDK 로깅으로만 남음.
- 단순히 로그 수준에 맞게 메시지를 기록 (error/fatal만 Sentry로 전송됨).
Sentry.captureException(error) / Sentry.captureMessage(message)
- 운영 환경에서 반드시 추적하고 싶은 예외는 이걸 써야 함.
- 무조건 이벤트로 전송해서 Sentry 대시보드에 남김.
➡️ 즉, logger는 관찰/분류용, captureException은 꼭 전송하고 싶은 에러 보고용입니다.
디스코드나 slack으로 연동도 가능하다고 해서 추후엔 연동해보면 좋을 것 같네용