
개념정리
프로메테우스를 이용하면 EC2 내부에 깔려있는 mysql이나 apach와 같은 서비스들의 사용량 체크와 EC2자체의 메모리, 볼륨, CPU와 같은 것들을 확인할 수 있기 때문에 프로메테우스로 모니터링 시스템을 구축해보도록 하겠다.
환경
- ubuntu 20.04
- EC2
- mysql
- apach
- prometheus
- grafana
실행
먼저 EC2를 열어준 뒤 EC2의 내부로 진입한다. 내부로 진입한 EC2에 필요한 요소들을 설치해준다.
sudo apt-get update
wget https://github.com/prometheus/prometheus/releases/download/v2.37.0/prometheus-2.37.0.linux-amd64.tar.gz

wget https://github.com/prometheus/mysqld_exporter/releases/download/v0.14.0/mysqld_exporter-0.14.0.linux-amd64.tar.gz

wget https://github.com/prometheus/node_exporter/releases/download/v1.3.1/node_exporter-1.3.1.linux-amd64.tar.gz

wget https://github.com/Lusitaniae/apache_exporter/releases/download/v0.11.0/apache_exporter-0.11.0.linux-amd64.tar.gz
각각 prometheus와 exporter들입니다.
필요한 정보는 프로메테우스 공식 홈페이지와 원하는 exporter를 다운로드 받으시면 됩니다.
각각의 폴더의 압축을 풉니다.
tar xf apache_exporter-0.11.0.linux-amd64.tar.gz
tar xf mysqld_exporter-0.14.0.linux-amd64.tar.gz
tar xf node_exporter-1.3.1.linux-amd64.tar.gz
tar xf prometheus-2.37.0.linux-amd64.tar.gz
이제 프로메테우스가 위치할 장소를 만들어주고 그 위치로 파일을 옮겨줍니다.
sudo mkdir -p /etc/prometheus
sudo mv prometheus console_libraries prometheus.yml consoles /etc/prometheus
프로메테우스의 유저 및 그룹을 시스템에 생성한다. 계정으로 로그인을 하지 않을거기 때문에 nologin으로 설정한다.
sudo groupadd --system prometheus
sudo useradd --system -s /usr/sbin/nologin -g prometheus prometheus
프로메테우스 유저와 그룹을 생성하였으니 이제 /etc/prometheus의 폴더와 내부 소유권들을 변경한다.
sudo chown prometheus:prometheus /etc/prometheus -R
ll
이제 프로메테우스가 시스템의 서비스로 운영될 수 있도록 systemd에 등록한다. 등록시 루트 계정으로 접근하여야 합니다.
su -
cd /etc/systemd/system
vi prometheus.service

[Unit]
Description=Prometheus
Wants=network-online.target
After=network-online.target

[Service]
User=prometheus
restart=on-failure
ExecStart=/etc/prometheus/prometheus \
		--config.file=/etc/prometheus/prometheus.yml \
        --storage.tsdb.path=/var/lib/prometheus \
        --web.console.templates=/etc/prometheus/console \
        --web.console.libraries=/etc/prometheus/console_libraries \
        --web.listen-address=0.0.0.0:9090 \
        --web.external-url=

[Install]
WantedBy=multi-user.target
이제 storage파일이 적용되어 있는 /var/lib/prometheus 폴더를 생성하고 권한을 prometheus로 변경해준다.
sudo mkdir -p /var/lib/prometheus
sudo chown prometheus:prometheus /var/lib/prometheus
이제 prometheus.service 적용을 위해 리로드를 해주고 status를 확인한다.
sudo systemctl daemon-reload
sudo systemctl status prometheus.service

sudo journalctl -xe
만일 문제가 발생하였다면 가장 밑에 있는 코드인 journalctl -xe로 확인하고 문제를 해결한다.
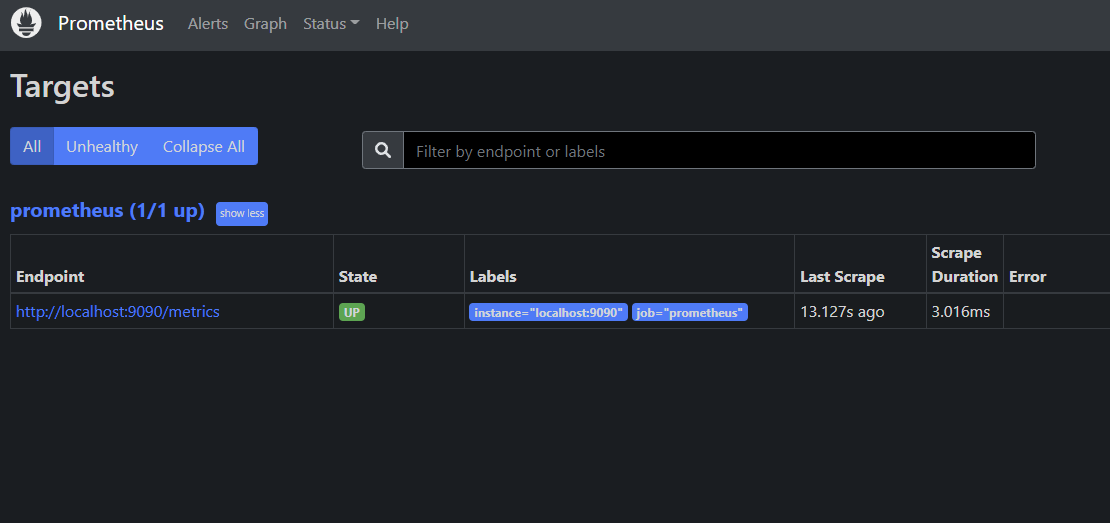
이제 ip로 접근하여 보면 prometheus가 잘 동작중인 것을 확인할 수 있다.
이제 exporter들을 설정하여 프로메테우스가 mysql과 node, apach로 부터 정보를 가져오도록 설정한다.
mkdir -p /etc/prometheus/exporters
cd /home/ubuntu/node_exporter-1.3.1.linux-amd64
sudo mv node_exporter /etc/prometheus/exporters/
sudo chown prometheus:prometheus /etc/prometheus/exporters/ -R
이제 다시 systemd에 등록해준다.
cd /etc/systemd/system
cp prometheus.service node-exporter.service
vi node-exporter.service

[Unit]
Description=Prometheus - node_exporter
Wants=network-online.target
After=network-online.target

[Service]
User=prometheus
restart=on-failure
ExecStart=/etc/prometheus/exporters/node_exporter

[Install]
WantedBy=multi-user.target
다시 데몬 리로드 시키고 node_exporter을 확인한다.
sudo systemctl daemon-reload
sudo systemctl restart node-exporter.service
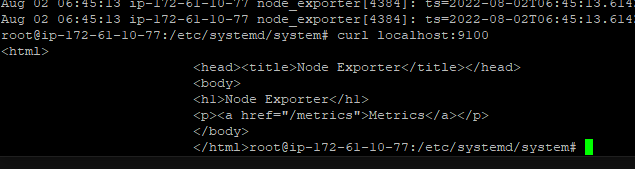
sudo systemctl status node-exporter.service실제로 실행정보를 확인하려면 node_exporter의 포트 번호를 변경하지 않았다면 9100번으로 접근이 가능하다.
이제 프로메테우스에 등록을 해주면 됩니다. 아래의 코드를 아래의 사진과 같이 추가해주시면 됩니다.
vi /etc/prometheus/prometheus.yml

  - job_name: "node_exporter"
    static_configs:
      - targets: ["localhost:9100"]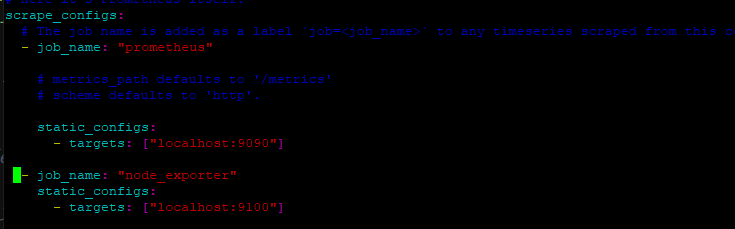
이제 프로메테우스를 재시작하고 확인해주시면됩니다.
systemctl restart prometheus.service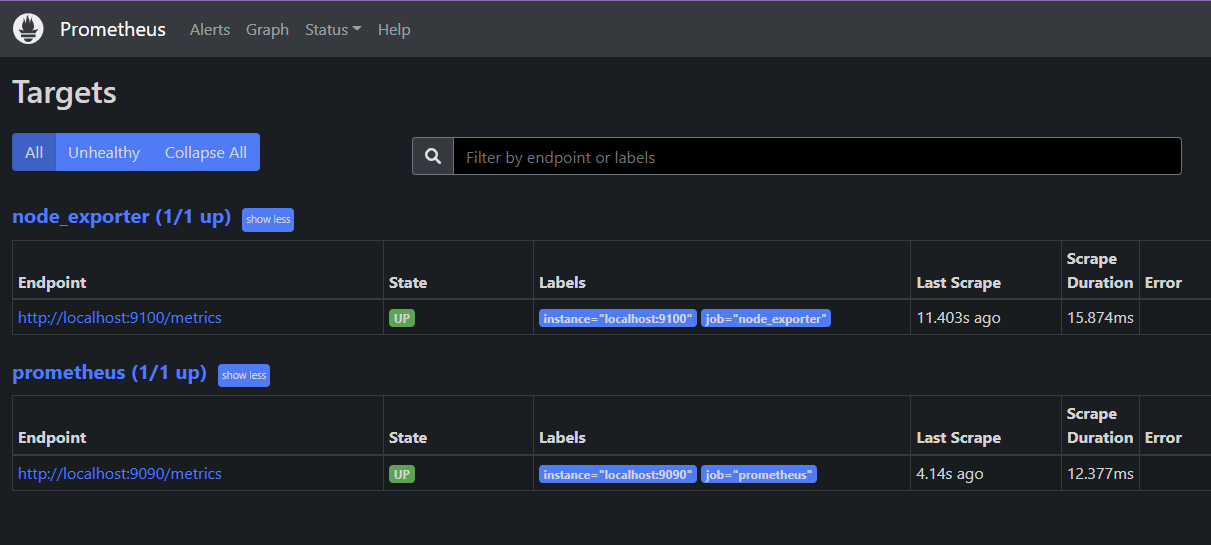
같은 방식으로 apach와 mysql을 등록시켜주시면 됩니다.
이제 그라파나를 설치하고 프로메테우스와 연결해봅시다.
그라파나 다운로드는 홈페이지에서 확인 가능합니다.
sudo apt-get install -y apt-transport-https
sudo apt-get install -y software-properties-common wget
wget -q -O - https://packages.grafana.com/gpg.key | sudo apt-key add -
echo "deb https://packages.grafana.com/oss/deb stable main" | sudo tee -a /etc/apt/sources.list.d/grafana.list
sudo apt-get update
sudo apt-get install grafana
sudo systemctl enable grafana-server.service
sudo systemctl start grafana-server.service
sudo systemctl status grafana-server.service
그라파나의 설치가 완료되었다. 이제 3000번 포트로 접근하게 되면 그라파나에 들어가는 것을 확인할 수 있다.
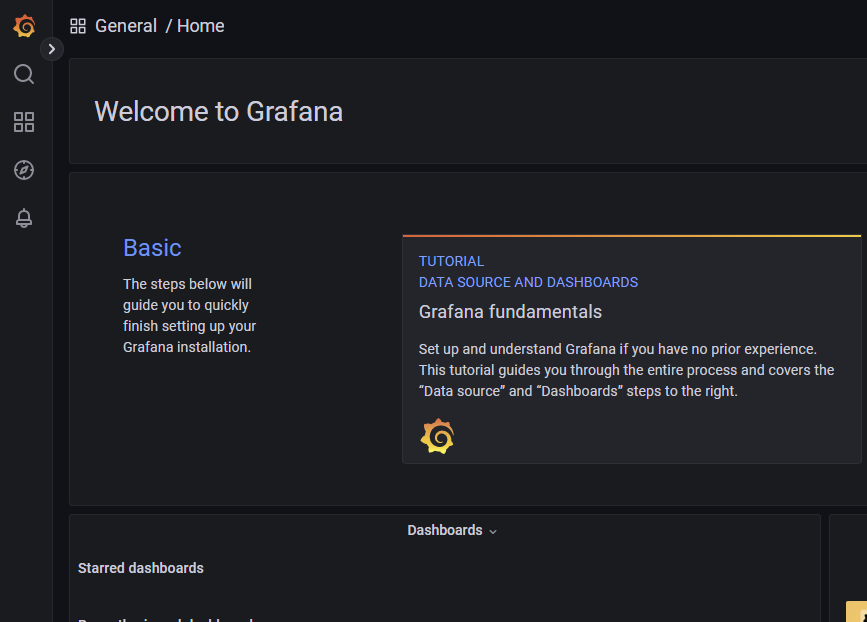
초기 아이디/비밀번호는 admin/admin 이다.
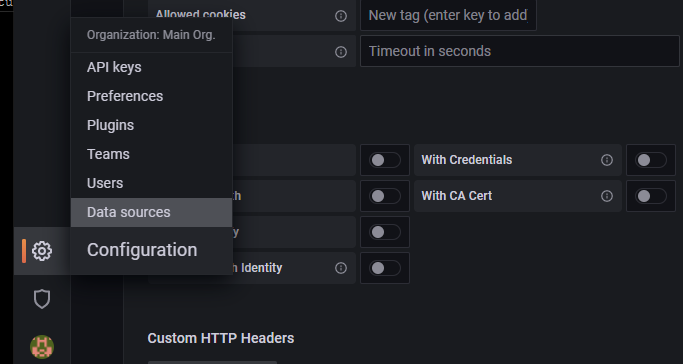
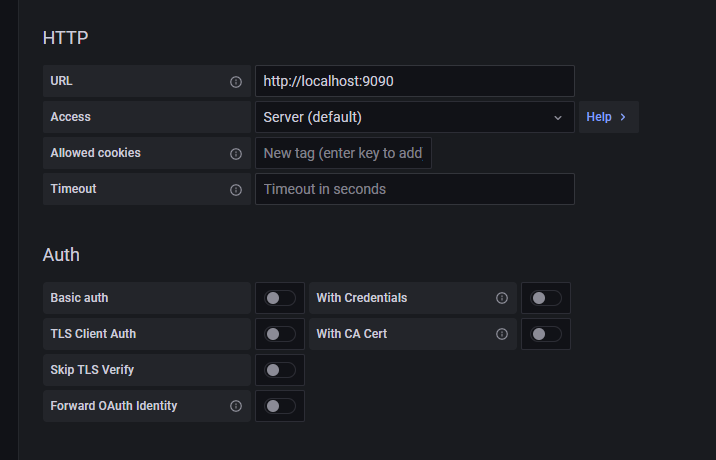
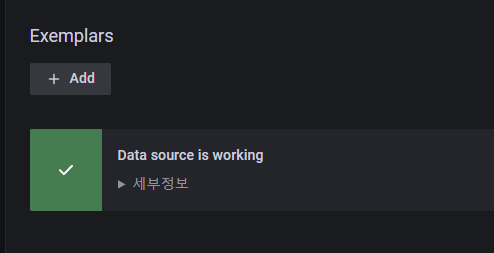
config - datasources - add datasources 로 이동한 뒤 url만 localhost:9090으로 변경한 뒤 test를 진행하면 테스트를 성공한 것을 확인할 수 있다.
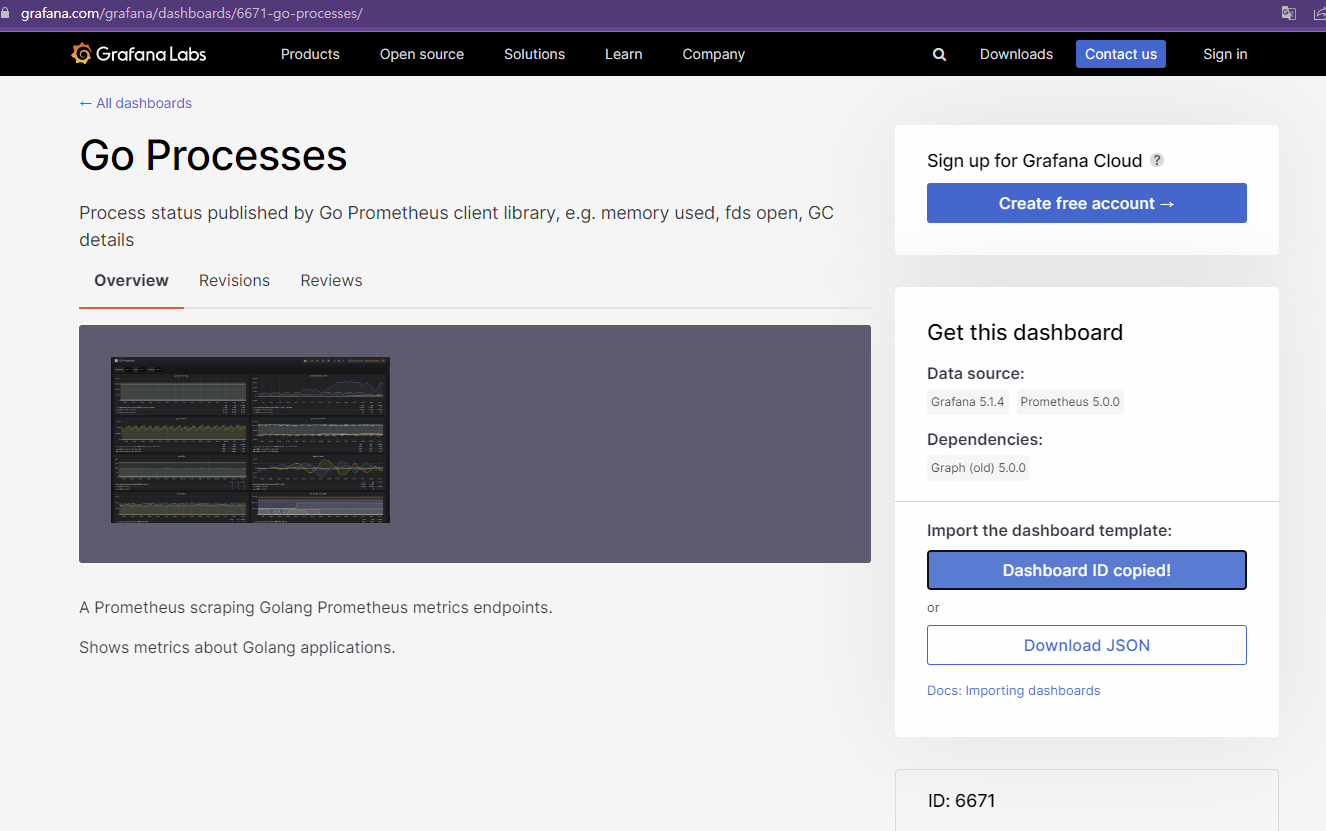
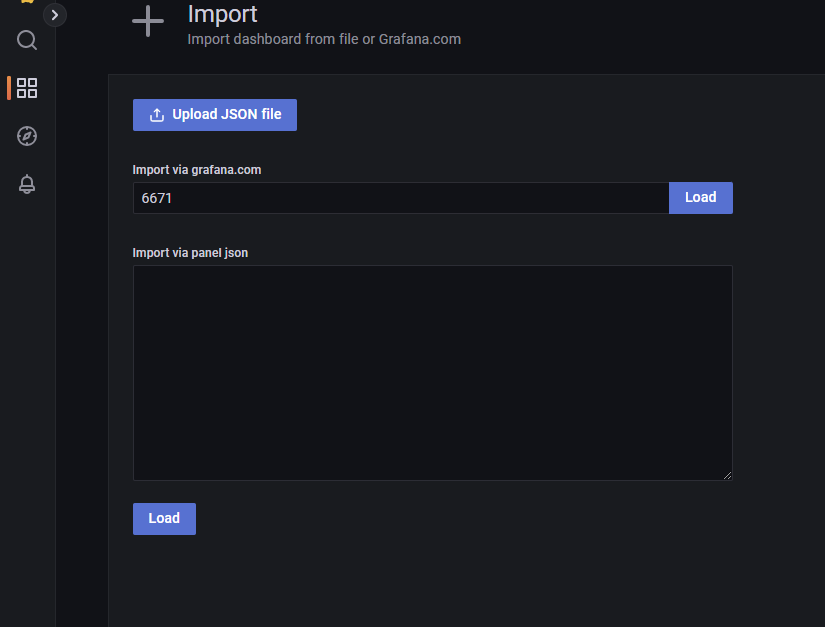
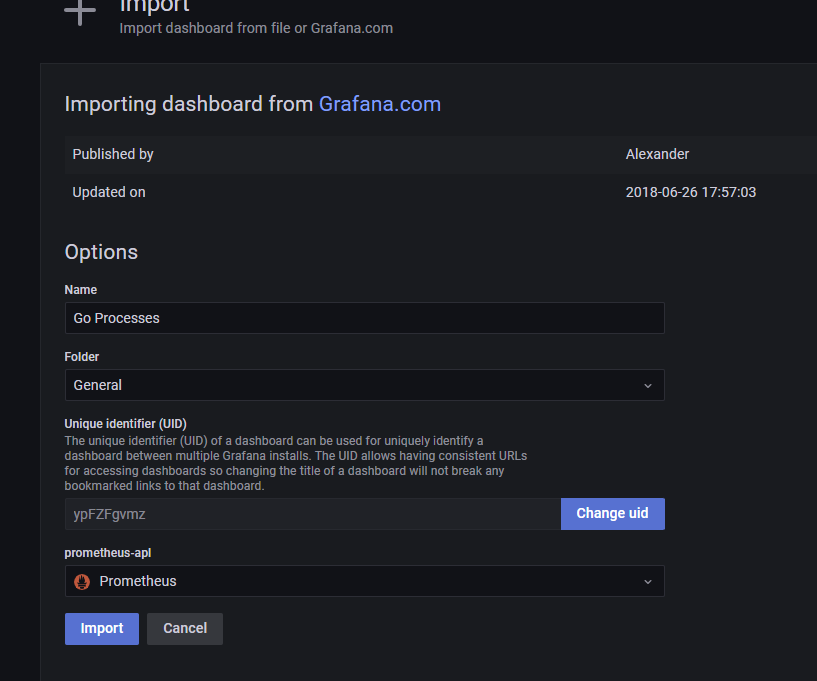
이제 데쉬보드를 꾸며주면 되는데 저는 그라파나 공식 홈페이지에 대쉬보드 올려놓은 것을 import 시켜주어 꾸미기로 했습니다.
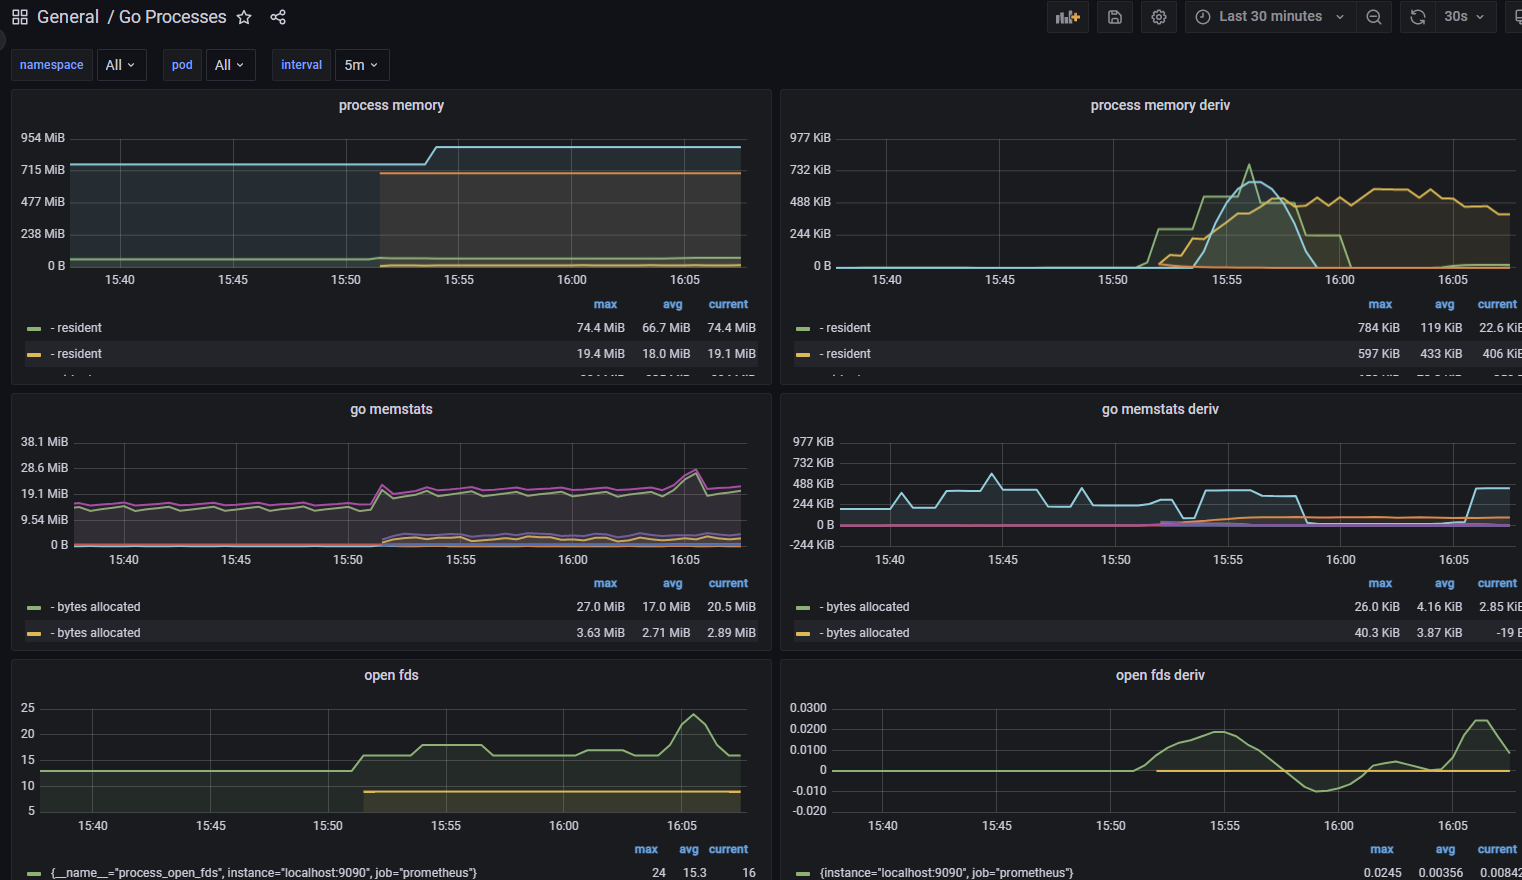
끝
마무리
필요한 포트는 aws 인바운드 포트를 알아서 열어주셔야 합니다. 또한 port번호는 변경하는 것이 보안상 좋습니다.