📒 데이터 표현
import 추가라이브러리 as 이름
💚 pandas : 데이터분석(많은 데이터 처리),csv파일 리드
💚 matplotlib.pyplot : 시각화
import pandas as pd
import numpy as np
import matplotlib.pyplot as plt
df = pd.read_csv('franchise.csv')
# print(df)
plt.rcParams['font.family']="Malgun Gothic"
plt.rcParams['axes.unicode_minus']=False
ind = np.arange(len(df))
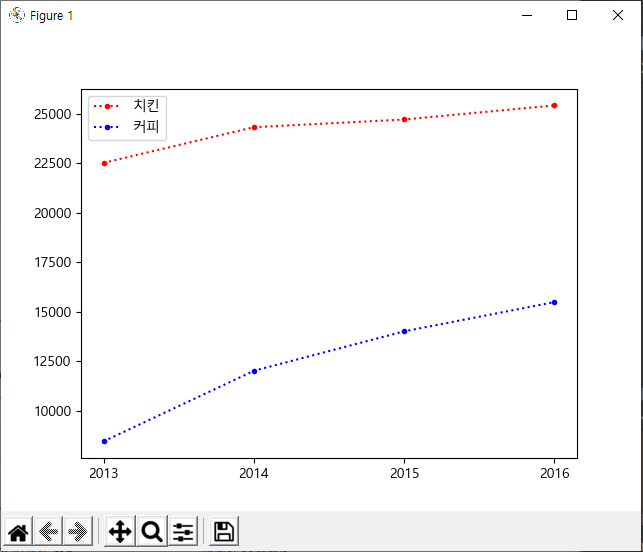
plt.plot(df['chicken'],"r:.",label="치킨")
plt.plot(df['coffee'],"b:.",label="커피")
plt.xticks(ind,df['year'])
plt.legend()
plt.show()
import pandas as ps
import matplotlib.pyplot as plt

df = ps.read_csv('move_P.csv',encoding='euc-kr')
# print(df)

ind = range(len(df))
# print(ind)

plt.plot(ind, df['서울특별시'],'b-',label="seoul")
plt.plot(ind, df['부산광역시'],'g--',label="busan")
plt.plot(ind, df['세종특별자치시'],'r-.',label="sejong")
plt.plot(ind, df['제주특별자치도'],'y:',label="jeju")

plt.xticks(ind, df['시점'])
plt.ylabel("number")
plt.xlabel("city")


plt.legend()

plt.show()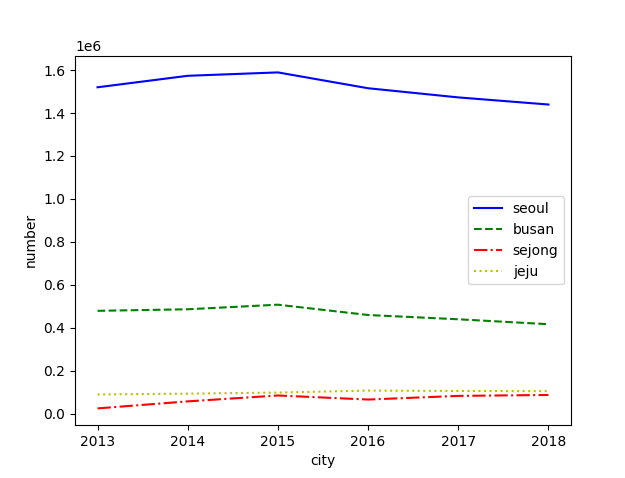
import pandas as ps
import numpy as np
import matplotlib.pyplot as plt

plt.rcParams['font.family']="Malgun Gothic"
plt.rcParams['axes.unicode_minus']=False

df = ps.read_csv('population.csv')

# print(df)

w = 0.4
idx = np.arange(len(df))


plt.bar(idx-w/2, df['men'] ,width=w,color='b',label="남성")
plt.bar(idx+w/2, df['women'] ,width=w,color='r',label="여성")

plt.xticks(idx,df['local'])
plt.title(" 도시별 인구수 ")

plt.legend()

plt.show()
import pandas as ps
import numpy as np
import matplotlib.pyplot as plt


plt.rcParams['font.family']="Malgun Gothic"
plt.rcParams['axes.unicode_minus']=False

df =ps.read_csv('birth.csv',encoding='euc-kr')

w = 0.3
idx = np.arange(len(df))
# print(idx)

plt.bar(idx-w,df['서울특별시'],width=w ,label="서울")
plt.bar(idx,df['부산광역시'],width=w,label="부산")
plt.bar(idx+w,df['제주특별자치도'],width=w,label="제주")

plt.xticks(idx,df['시점'])
plt.ylabel(" 인구수 ")
plt.legend()

plt.show()
# test10.py
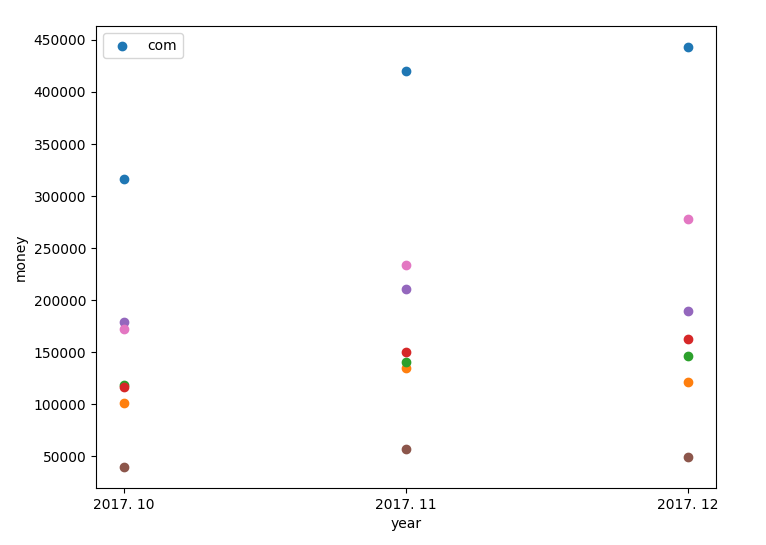
# 산점도
import pandas as ps
import matplotlib.pyplot as plt
df = ps.read_csv('online.csv',encoding='euc-kr')
idx = range(len(df))
plt.figure( figsize=(8,6) )
plt.scatter(df['시점'],df['컴퓨터 및 주변기기'],label="com")
plt.scatter(df['시점'],df['신 발'])
plt.scatter(df['시점'],df['가 방'])
plt.scatter(df['시점'],df['패션용품 및 악세사리'])
plt.scatter(df['시점'],df['가 구'])
plt.scatter(df['시점'],df['애완용품'])
plt.scatter(df['시점'],df['기 타'])
plt.xlabel("year")
plt.ylabel("money")
plt.legend()
plt.show()

beginner