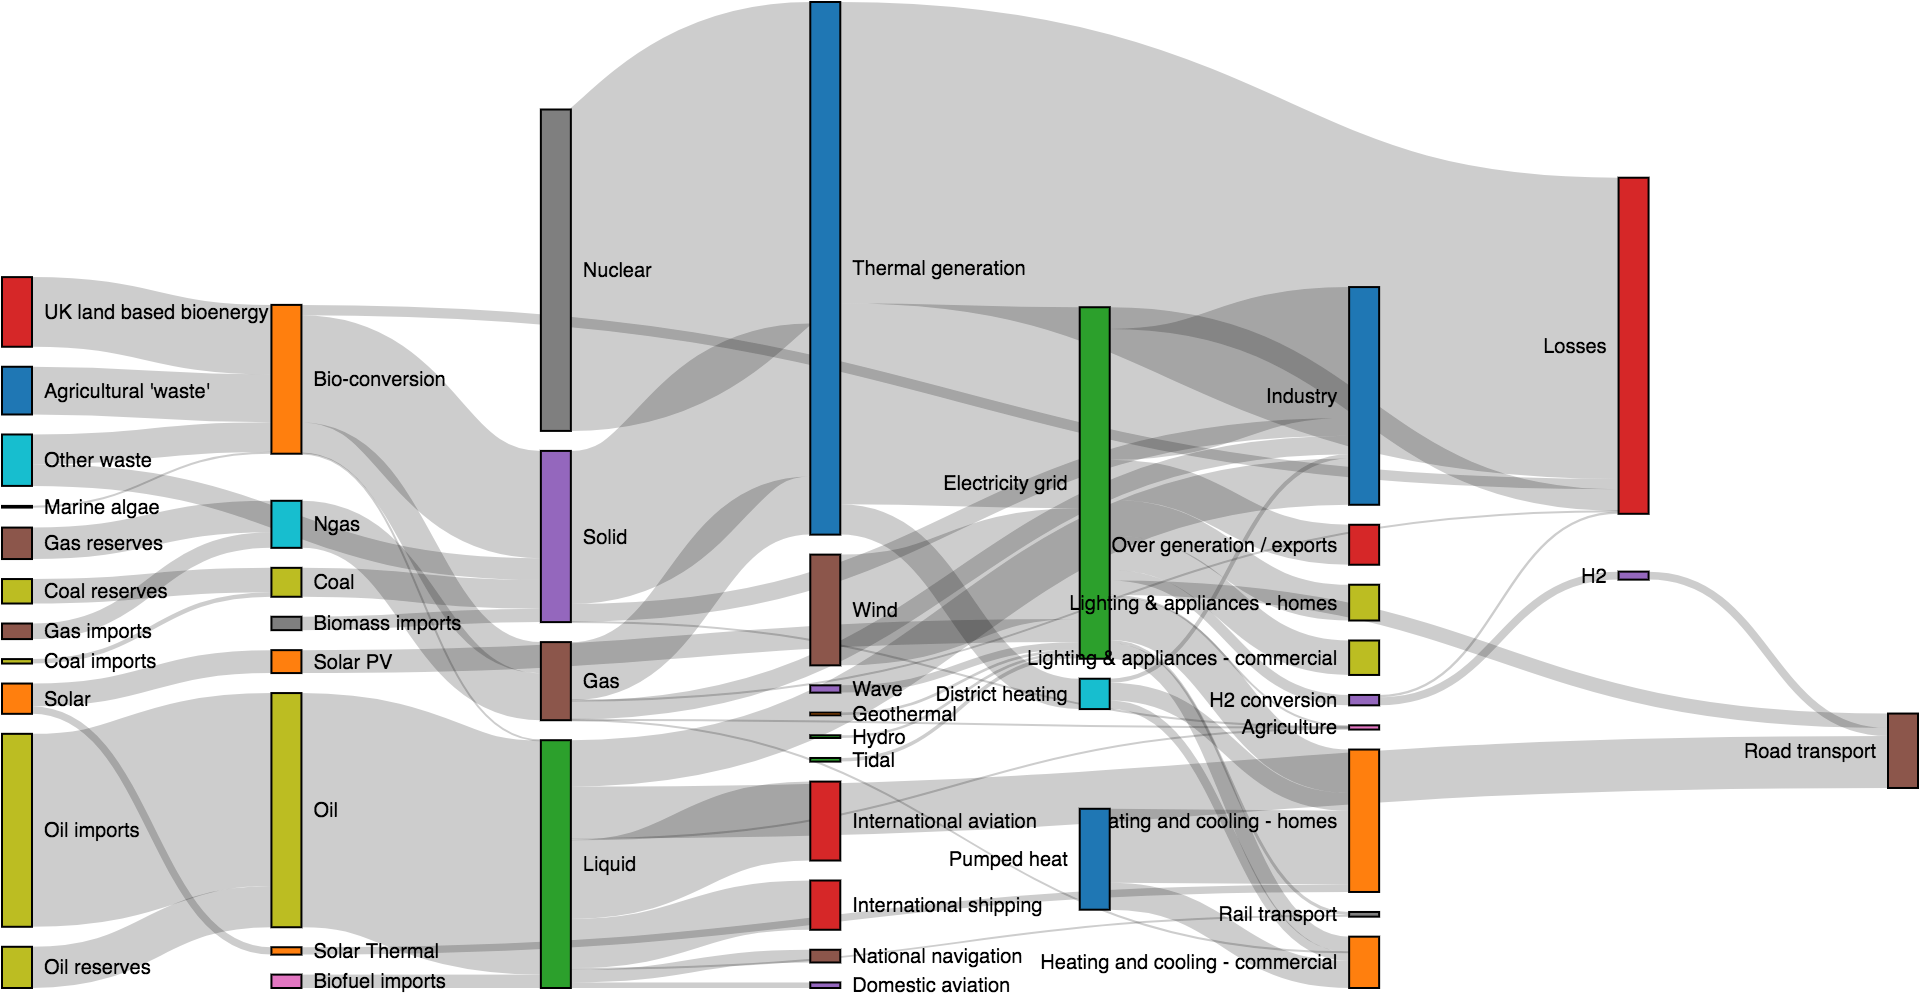
Sankey Diagram
-
노드(node): 흐름의 출발점 또는 도착점이 되는 항목
-
링크(link): 두 노드를 연결하는 흐름 (흐름의 양을 value로 표현)
-
넓이(width): 링크의 넓이는 value 값에 비례
1. nodes (노드 목록)
nodes: [
  { name: "A" },
  { name: "B" },
  { name: "C" }
]- 각 노드는 유일해야 함 (name 중복 금지)
- 순서가 중요 링크에서 사용될 index가 여기서 결정
따라서 노드 이름이 겹치면 어떤 노드를 가리키는지 알 수 없고 Sankey가 깨짐
2. links (흐름/연결 정보)
links: [
  { source: 0, target: 1, value: 10 },
  { source: 1, target: 2, value: 5 }
]-
source와 target은 nodes 배열의 인덱스 또는 d3.sankey().nodeId()로 정의한 식별자
-
value는 흐름의 양 (값이 클수록 링크가 두꺼워짐)
기존 코드 문제점
Sankey가 어색한 이유는, source와 target이 이어지는 흐름이 없기 때문
Case1 → Case4
Case4 → Case7
Case7 → Case10
단일 클러스터에 있는 노드들을 억지로 연결한 것이기 때문에 그래프가 직관적이지 않는 문제
-
클러스터 내에서 순서를 부여해서 1단계 → 2단계 → 3단계 식으로 만들고
-
연결을 해당 단계 간에만 하도록 바꿔야 함
예시
const sankeyData = {
  nodes: [
    { name: "서울" },
    { name: "부산" },
    { name: "대전" }
  ],
  links: [
    { source: 0, target: 1, value: 5 },
    { source: 1, target: 2, value: 3 }
  ]
};
source: 0은 "서울",
target: 1은 "부산" → 5만큼 흐름이 있다는 의미
nodeId()로 문자열 기반 으로도 생성 가능
const sankey = d3.sankey()
  .nodeId(d => d.name)
  .nodeWidth(15)
  .nodePadding(10)
  .extent([[1, 1], [width - 1, height - 5]]);

const data = {
  nodes: [
    { name: "서울" },
    { name: "부산" }
  ],
  links: [
    { source: "서울", target: "부산", value: 10 }
  ]
};
이렇게 하면 index 없이도 name만으로도 Sankey를 만들 수 있음
Sankey 다이어그램의 기본 전제
{
  nodes: [{ name: "A" }, { name: "B" }, { name: "C" }],
  links: [{ source: 0, target: 1, value: 5 },
          { source: 1, target: 2, value: 3 }]
}-
nodes는 고유한 노드만 있어야 함
-
links의 source와 target은 nodes 배열의 index를 가리킴
| 기능 | 설명 |
|---|---|
nodeId(d => d.name) | 문자열 기반 노드 연결 가능 |
.nodePadding(px) | 노드 간 간격 조절 |
.nodeWidth(px) | 노드 두께 조절 |
| .extent([[x0, y0], [x1, y1]]) | 그래프의 렌더링 범위 |
구글 chart - https://developers.google.com/chart/interactive/docs/gallery/sankey?hl=ko
☺️ Make Saneky Diagram ☺️
예제 코드
<!DOCTYPE html>
<html lang="en">
<head>
  <meta charset="UTF-8">
  <title>Sankey Diagram Example</title>
  <script src="https://d3js.org/d3.v7.min.js"></script>
  <script src="https://unpkg.com/d3-sankey@0.12.3/dist/d3-sankey.min.js"></script>
  <style>
    body { font-family: sans-serif; }
    .node rect {
      cursor: move;
      fill-opacity: 0.9;
      shape-rendering: crispEdges;
    }
    .node text {
      pointer-events: none;
      text-shadow: 0 1px 0 #fff;
    }
  </style>
</head>
<body>
  <h2>Sankey Diagram</h2>
  <svg id="sankey" width="700" height="500"></svg>

  <script>
    const { sankey, sankeyLinkHorizontal } = d3;

    // Sankey 노드 및 링크 데이터
    const data = {
      nodes: [
        { name: "A" },
        { name: "B" },
        { name: "C" },
        { name: "D" },
        { name: "E" }
      ],
      links: [
        { source: 0, target: 1, value: 10 },
        { source: 0, target: 2, value: 5 },
        { source: 1, target: 3, value: 7 },
        { source: 2, target: 3, value: 3 },
        { source: 3, target: 4, value: 10 }
      ]
    };

    const svg = d3.select("#sankey");
    const width = +svg.attr("width");
    const height = +svg.attr("height");

    const sankeyGen = sankey()
      .nodeWidth(20)
      .nodePadding(15)
      .extent([[1, 1], [width - 1, height - 6]]);

    const sankeyData = sankeyGen({
      nodes: data.nodes.map(d => Object.assign({}, d)),
      links: data.links.map(d => Object.assign({}, d))
    });

    // 링크 (곡선 흐름)
    svg.append("g")
      .selectAll("path")
      .data(sankeyData.links)
      .join("path")
        .attr("d", sankeyLinkHorizontal())
        .attr("stroke", "#69b3a2")
        .attr("stroke-width", d => Math.max(1, d.width))
        .attr("fill", "none")
        .attr("opacity", 0.5);

    // 노드 (박스)
    const node = svg.append("g")
      .selectAll("g")
      .data(sankeyData.nodes)
      .join("g")
        .attr("transform", d => `translate(${d.x0},${d.y0})`);

    node.append("rect")
      .attr("height", d => d.y1 - d.y0)
      .attr("width", d => d.x1 - d.x0)
      .attr("fill", "#4682B4");

    node.append("text")
      .attr("x", -6)
      .attr("y", d => (d.y1 - d.y0) / 2)
      .attr("dy", "0.35em")
      .attr("text-anchor", "end")
      .text(d => d.name);
  </script>
</body>
</html>
1. Sankey 데이터 정의
const data = {
  nodes: [
    { name: "A" },
    { name: "B" },
    { name: "C" },
    { name: "D" },
    { name: "E" }
  ],
  links: [
    { source: 0, target: 1, value: 10 },
    { source: 0, target: 2, value: 5 },
    { source: 1, target: 3, value: 7 },
    { source: 2, target: 3, value: 3 },
    { source: 3, target: 4, value: 10 }
  ]
};- nodes: 각 박스 (노드) name만 있으면 됨
- links: 흐름 (화살표)
- source: 출발 노드 (인덱스)- targer: 도착 노드 (인덱스)
- value: 흐름 양 (선 굵기)
2. Snakey 생성
const sankeyGen = sankey()
  .nodeWidth(20)         // 노드 너비
  .nodePadding(15)       // 노드 간 간격
.extent([[1, 1], [width - 1, height - 6]]); // 그릴 범위- .nodeWidth: 박스 너비
- .nodePadding: 박스 사이 간격
- .extent: 다이어그램을 그릴 전체 영역
3. 실제 데이터 레이아웃 계산
const sankeyData = sankeyGen({
  nodes: data.nodes.map(d => Object.assign({}, d)),
  links: data.links.map(d => Object.assign({}, d))
});- 데이터를 넘기면 D3가 x0, x1, y0, y1 같은 좌표값을 자동으로 계산
- map(...Object..assign(...)): 원본 데이터를 복사해서 사용
4. Links(흐름 선) 그리기
svg.append("g")
  .selectAll("path")
  .data(sankeyData.links)
  .join("path")
    .attr("d", sankeyLinkHorizontal())
    .attr("stroke", "#69b3a2")
    .attr("stroke-width", d => Math.max(1, d.width))
    .attr("fill", "none")
.attr("opacity", 0.5);- .data(...): Sankey 계산된 링크에 접근
- .attr("d", sankeyLinkHorizontal()): 링크를 곡선으로 그리는 함수
- .attr("stroke-width", ...): 흐름의 양에 따라 선 굵기 설정
5. Node(박스) 그리기
const node = svg.append("g")
  .selectAll("g")
  .data(sankeyData.nodes)
  .join("g")
.attr("transform", d => `translate(${d.x0},${d.y0})`);- 각 노드를 그룹()으로 묶고, 위치 지정
- D3는 x0, y0 값을 sankey가 계산
6. 노드 사각형 박스 그리기
const node = svg.append("g")
  .selectAll("g")
  .data(sankeyData.nodes)
  .join("g")
.attr("transform", d => `translate(${d.x0},${d.y0})`);- x1 - x0, .y1 - y0: 노드의 너비와 높이
- .attr("fill"): 색상 설정