☕ 개요
이번 글에서는 k8s에서 구동되고 있는 Pod들을 모니터링하는 방법에 대해서 간단히 알아보도록 하겠다.
🍫 준비물
- k8s 클러스터: 로컬 환경이라면
kind나minikube와 같은 것으로 클러스터를 구동한다. - helm:
helm을 통해서 Prometheus와 Grafana를 설치할 것이므로, Helm이 설치되어 있어야한다. (helm 설치 방법) - k8s Metric server 플러그인 설치: Pod의 지표 수집을 위해서 Metric server 플러그인을 설치한다. (Metric server 설치 방법)
🔥 Prometheus, Grafana 설치
1) 모니터링을 위한 별도의 네임스페이스 생성
kubectl create namespace monitoring2) Prometheus 설치
helm repo add prometheus-community https://prometheus-community.github.io/helm-charts
helm -n monitoring install prometheus prometheus-community/prometheus
3) Grafana 설정 yaml 작성
datasources:
  datasources.yaml:
    apiVersion: 1
    datasources:
      - name: Prometheus
        type: prometheus
        url: http://prometheus-server.monitoring.svc.cluster.local
        access: proxy
isDefault: truegrafana.yaml이란 이름으로 grafana 실행 시 사용할 설정 파일을 작성한다.
4) Grafana 설치
helm repo add grafana https://grafana.github.io/helm-charts
helm -n monitoring install grafana grafana/grafana --set adminPassword="admin01" --values ./grafana.yaml
🖥️ Grafana 접속하기
localhost로 k8s에서 구동 중인 서비스에 접근 가능하도록 하는 방법은 많지만, 간단히 포트 포워딩을 해서 구현해보도록 하겠다.
kubectl port-forward -n monitoring deployment/grafana 3000🧐 접속 확인
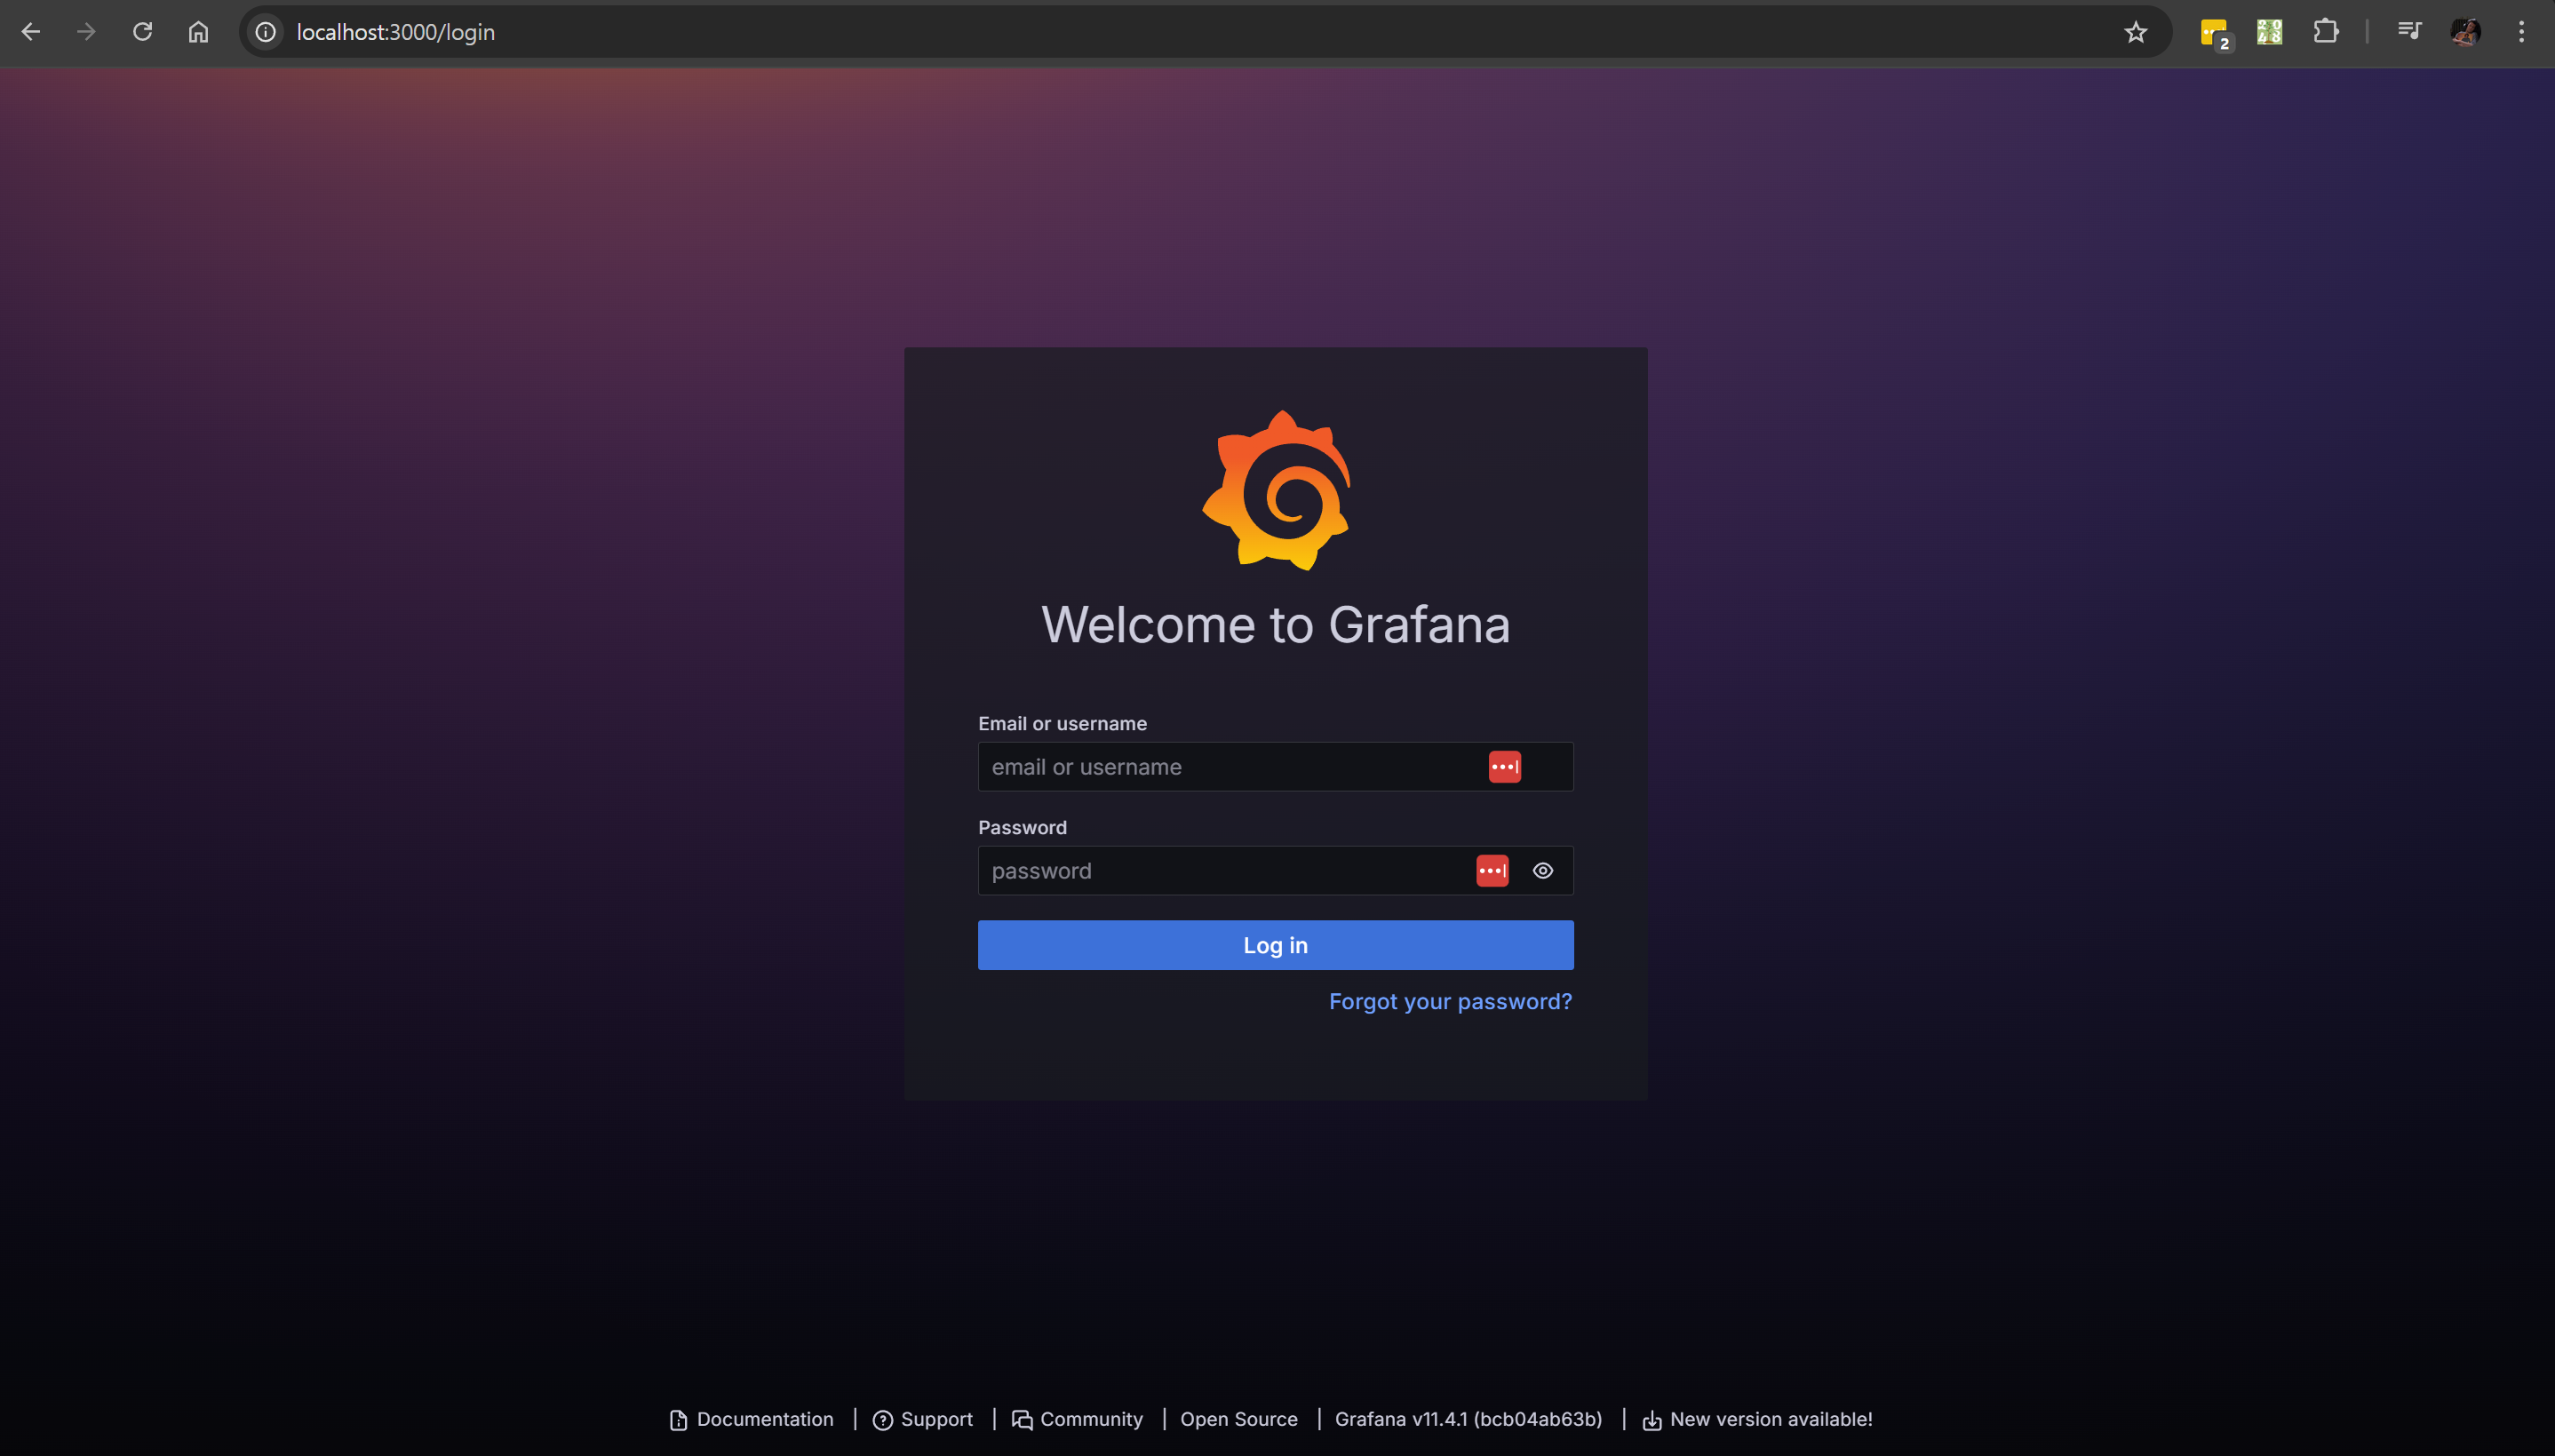
localhost:3000으로 접속하면 정상적으로 접근되는 것을 확인할 수 있고, 아래의 계정 정보로 로그인하면 된다.
- ID:
admin - PW:
admin01
🧙♂️ 대시보드 만들기
CPU와 Memory 사용량을 모니터링할 수 있는 간단한 대시보드를 하나 만들어보자.
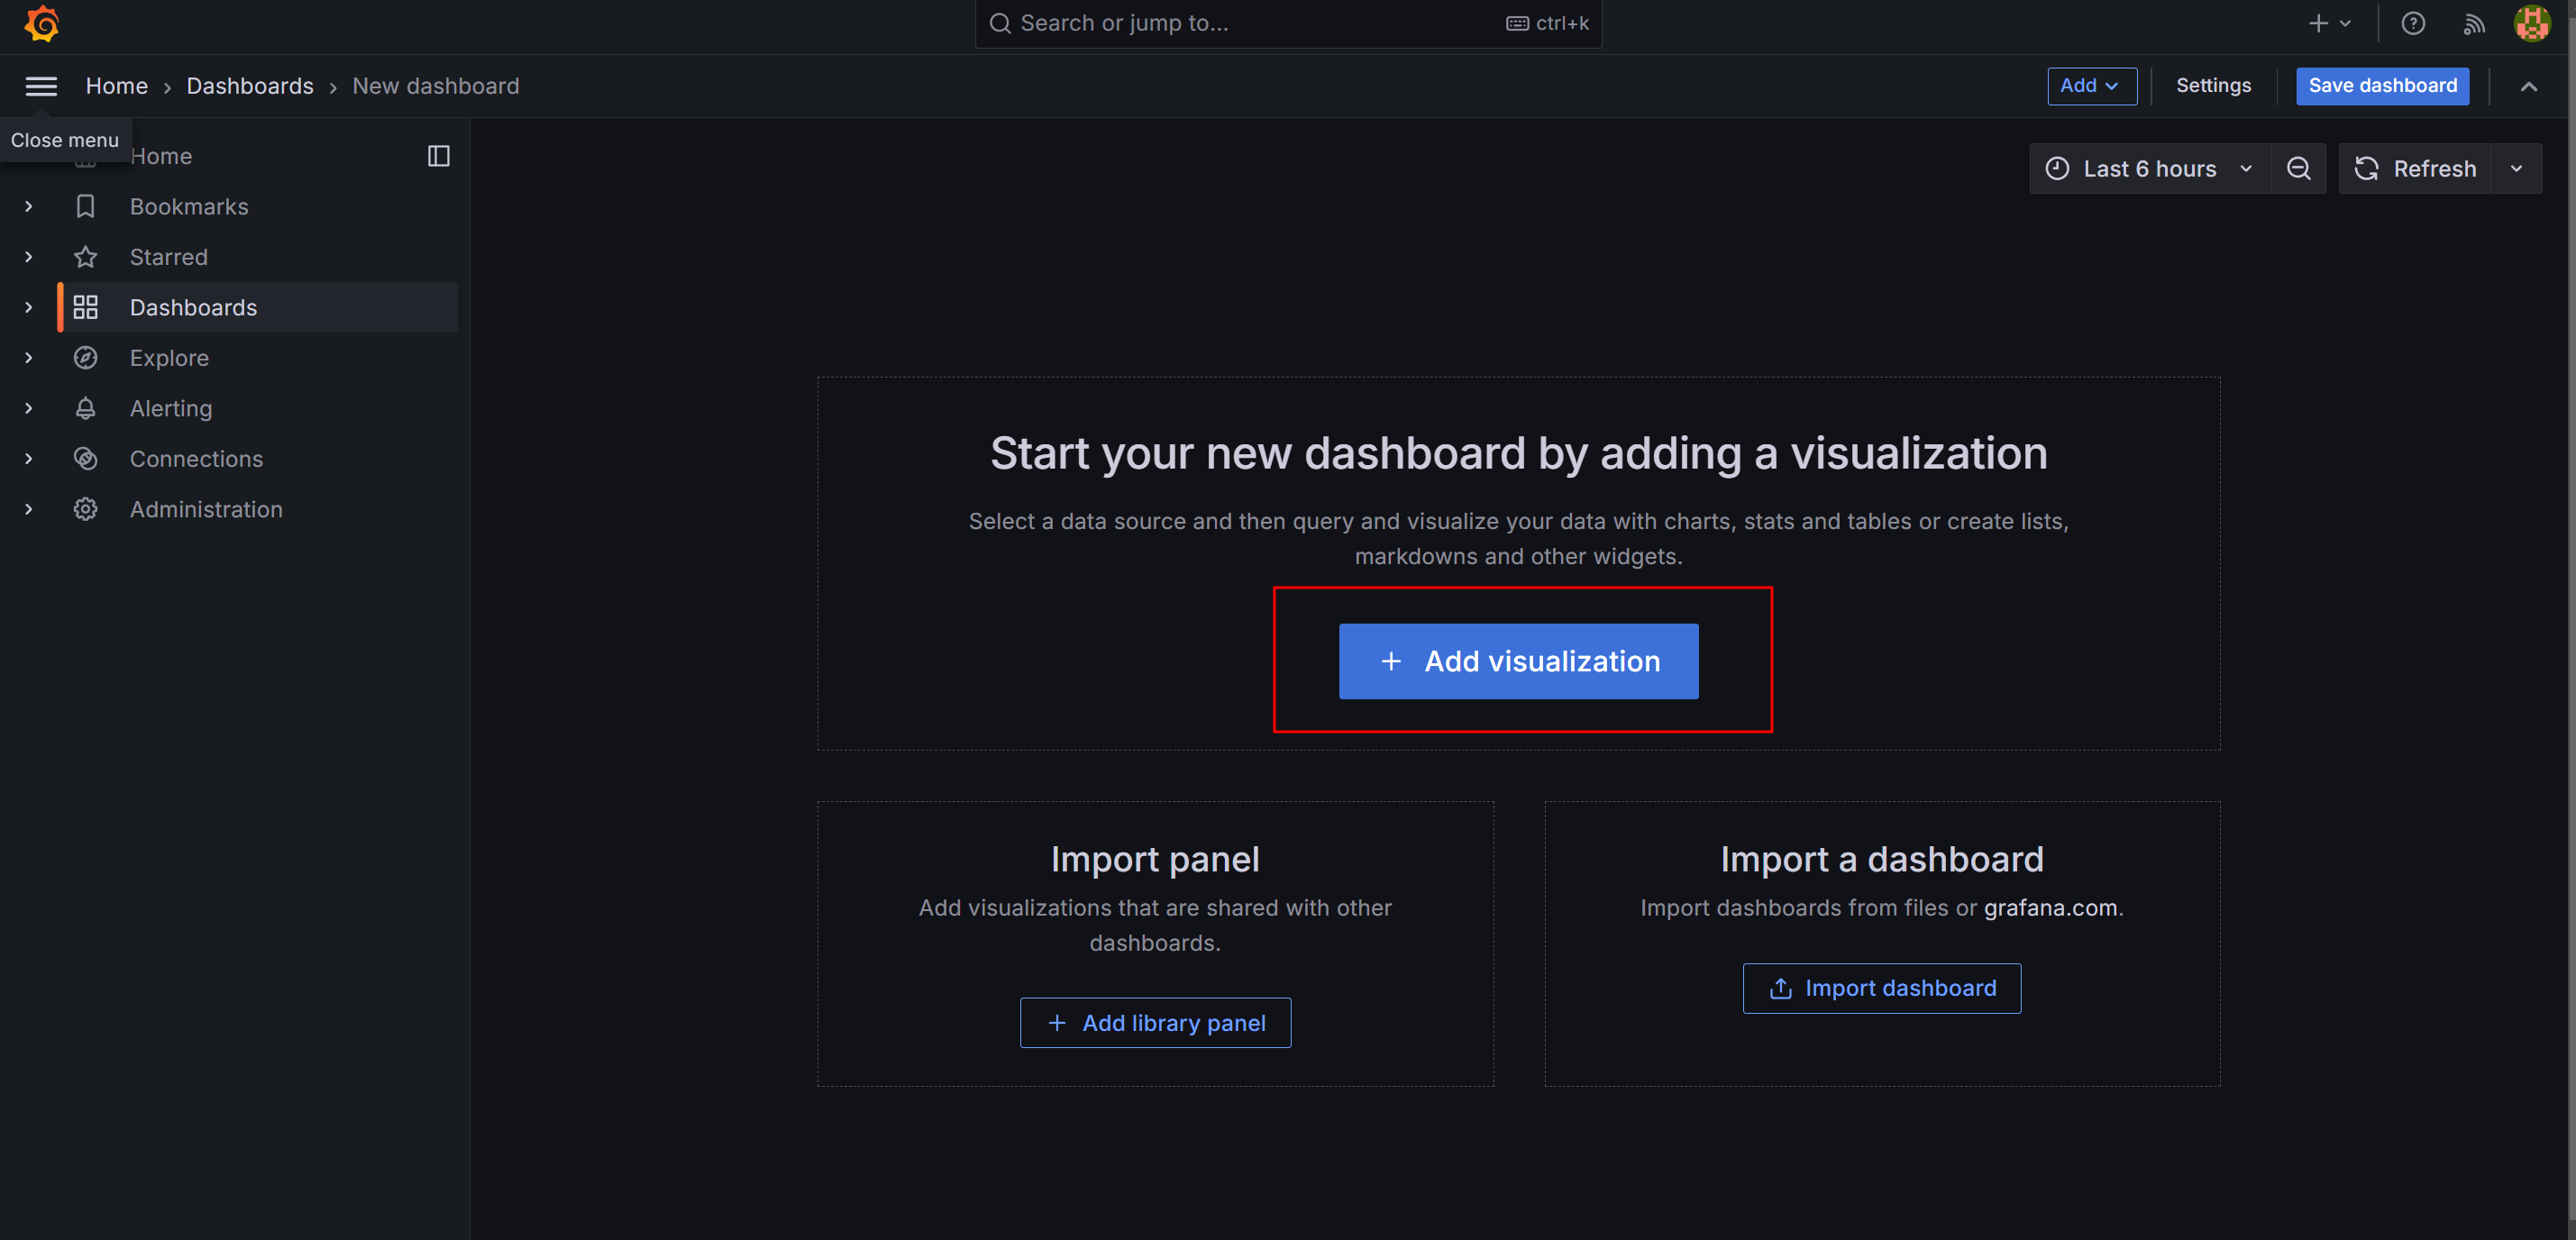
1) 신규 대시보드 생성
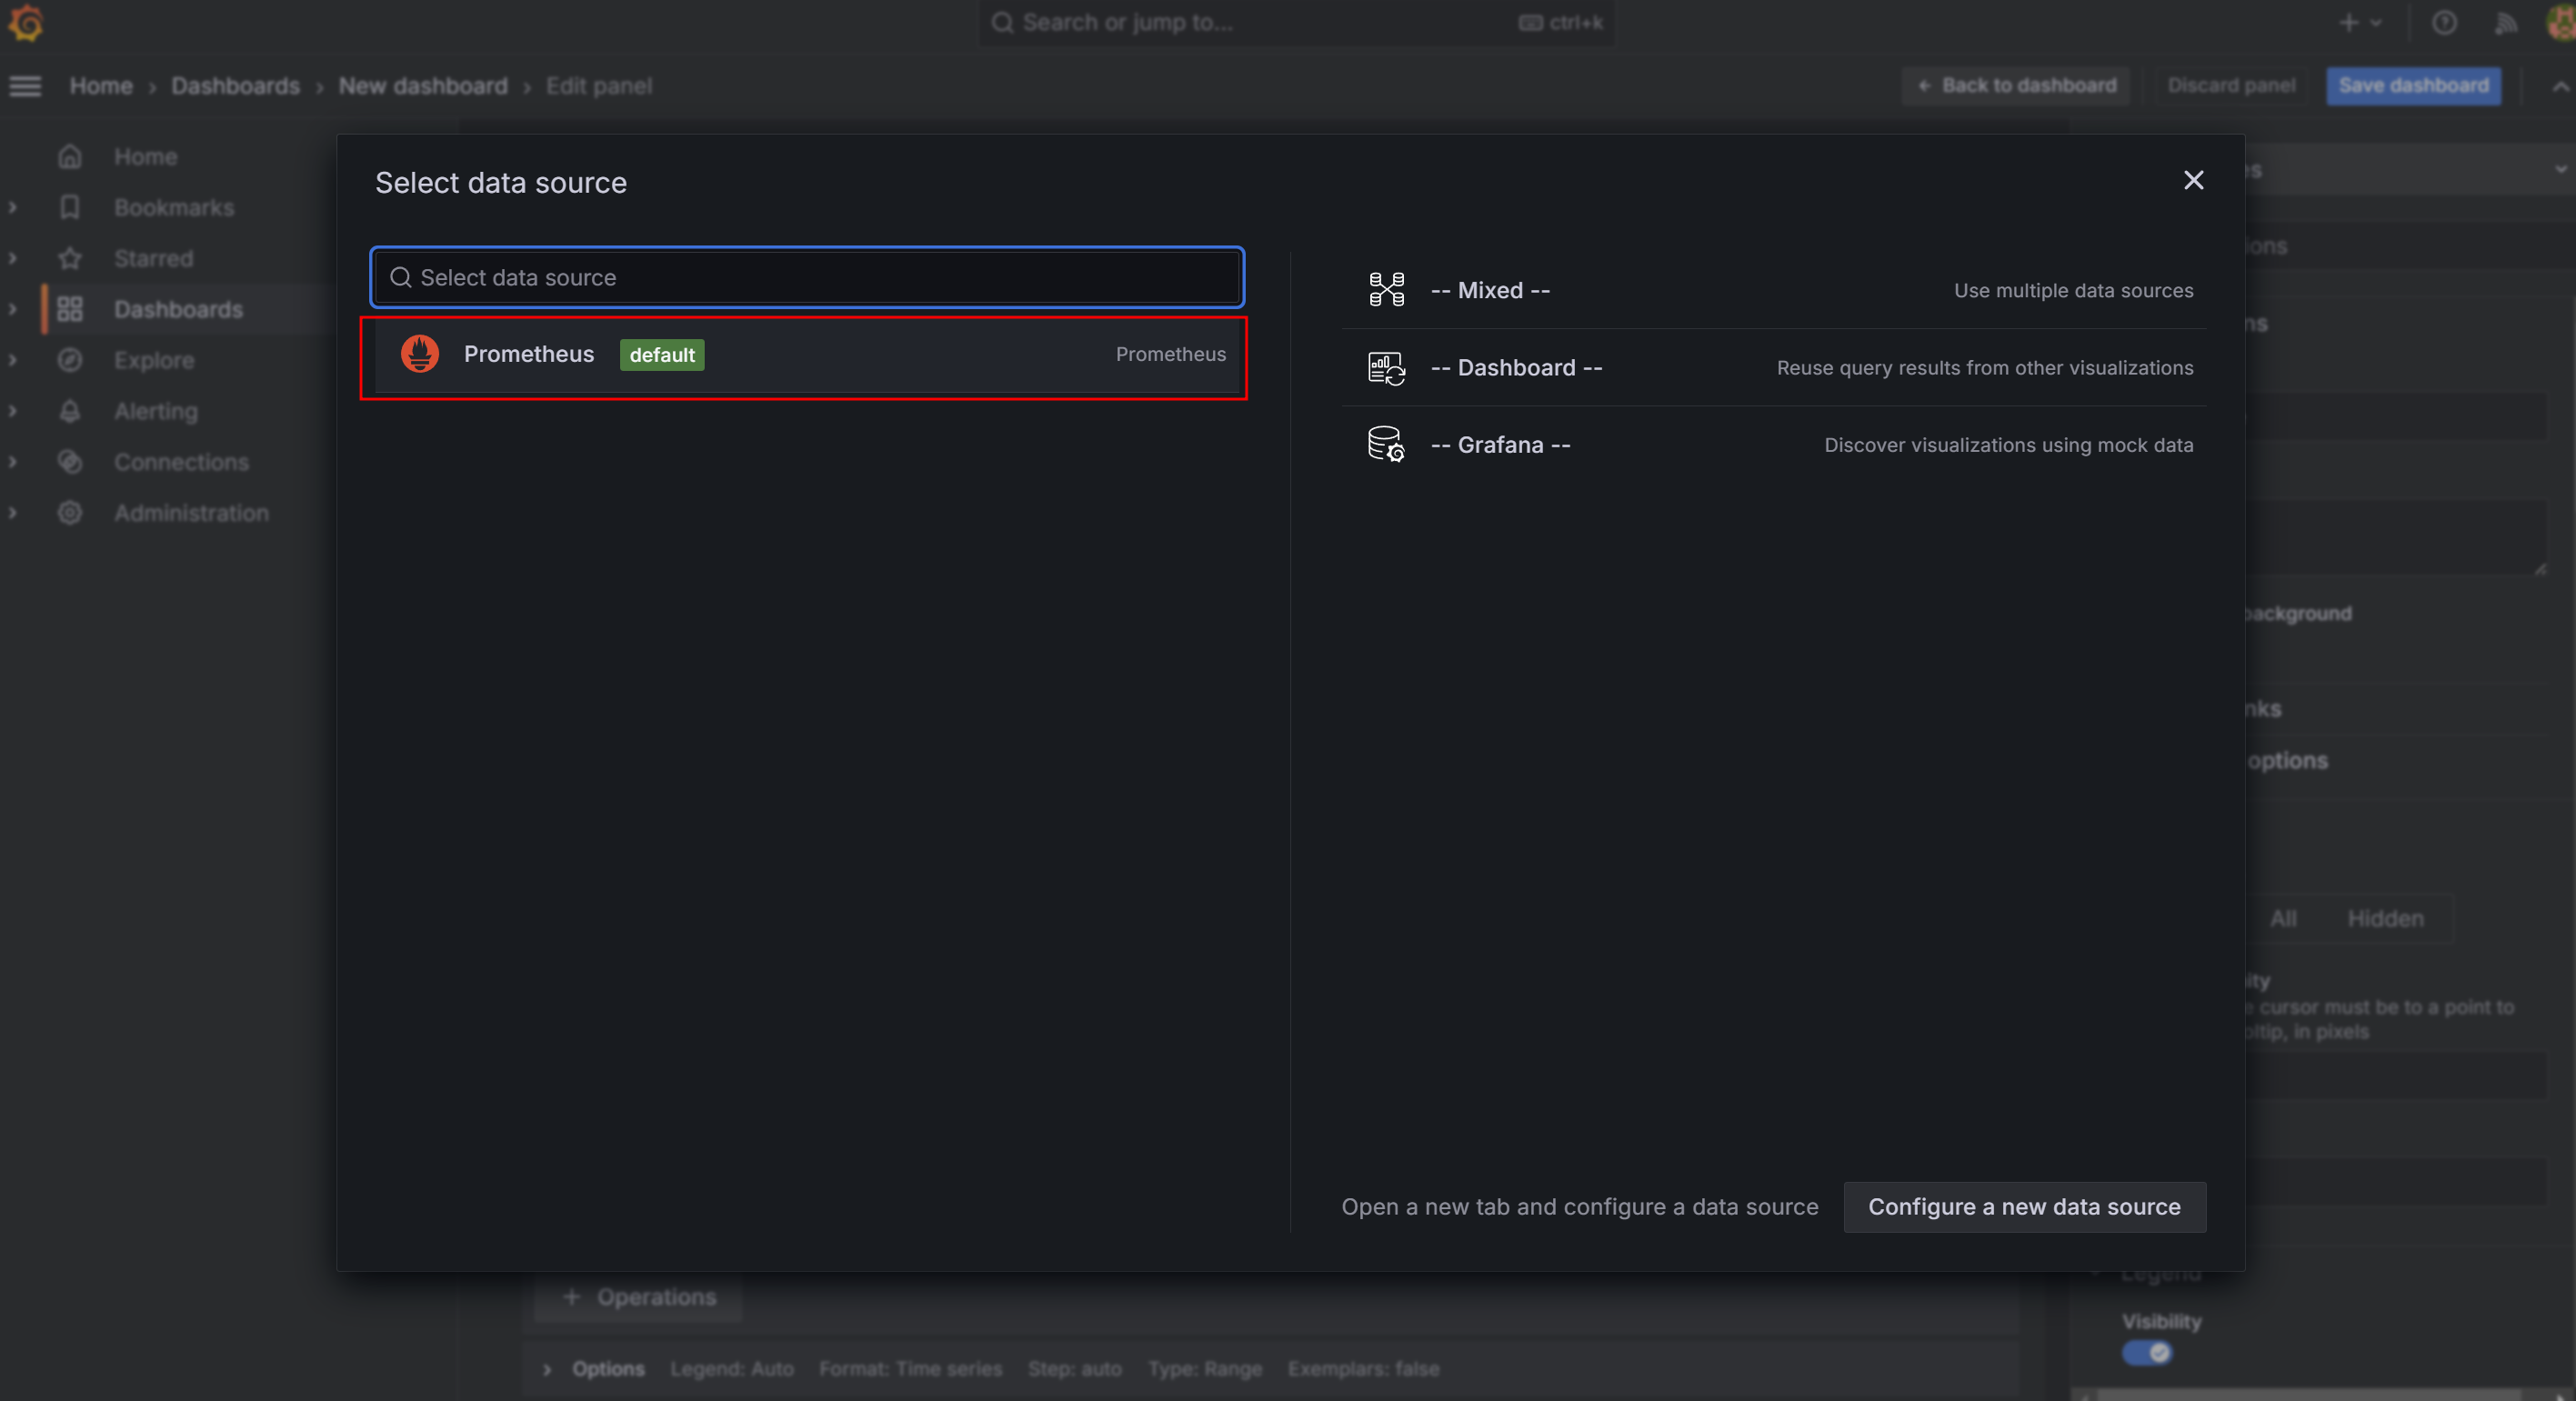
2) Prometheus 데이터 소스 선택
3) CPU 지표 선택 & 필터링
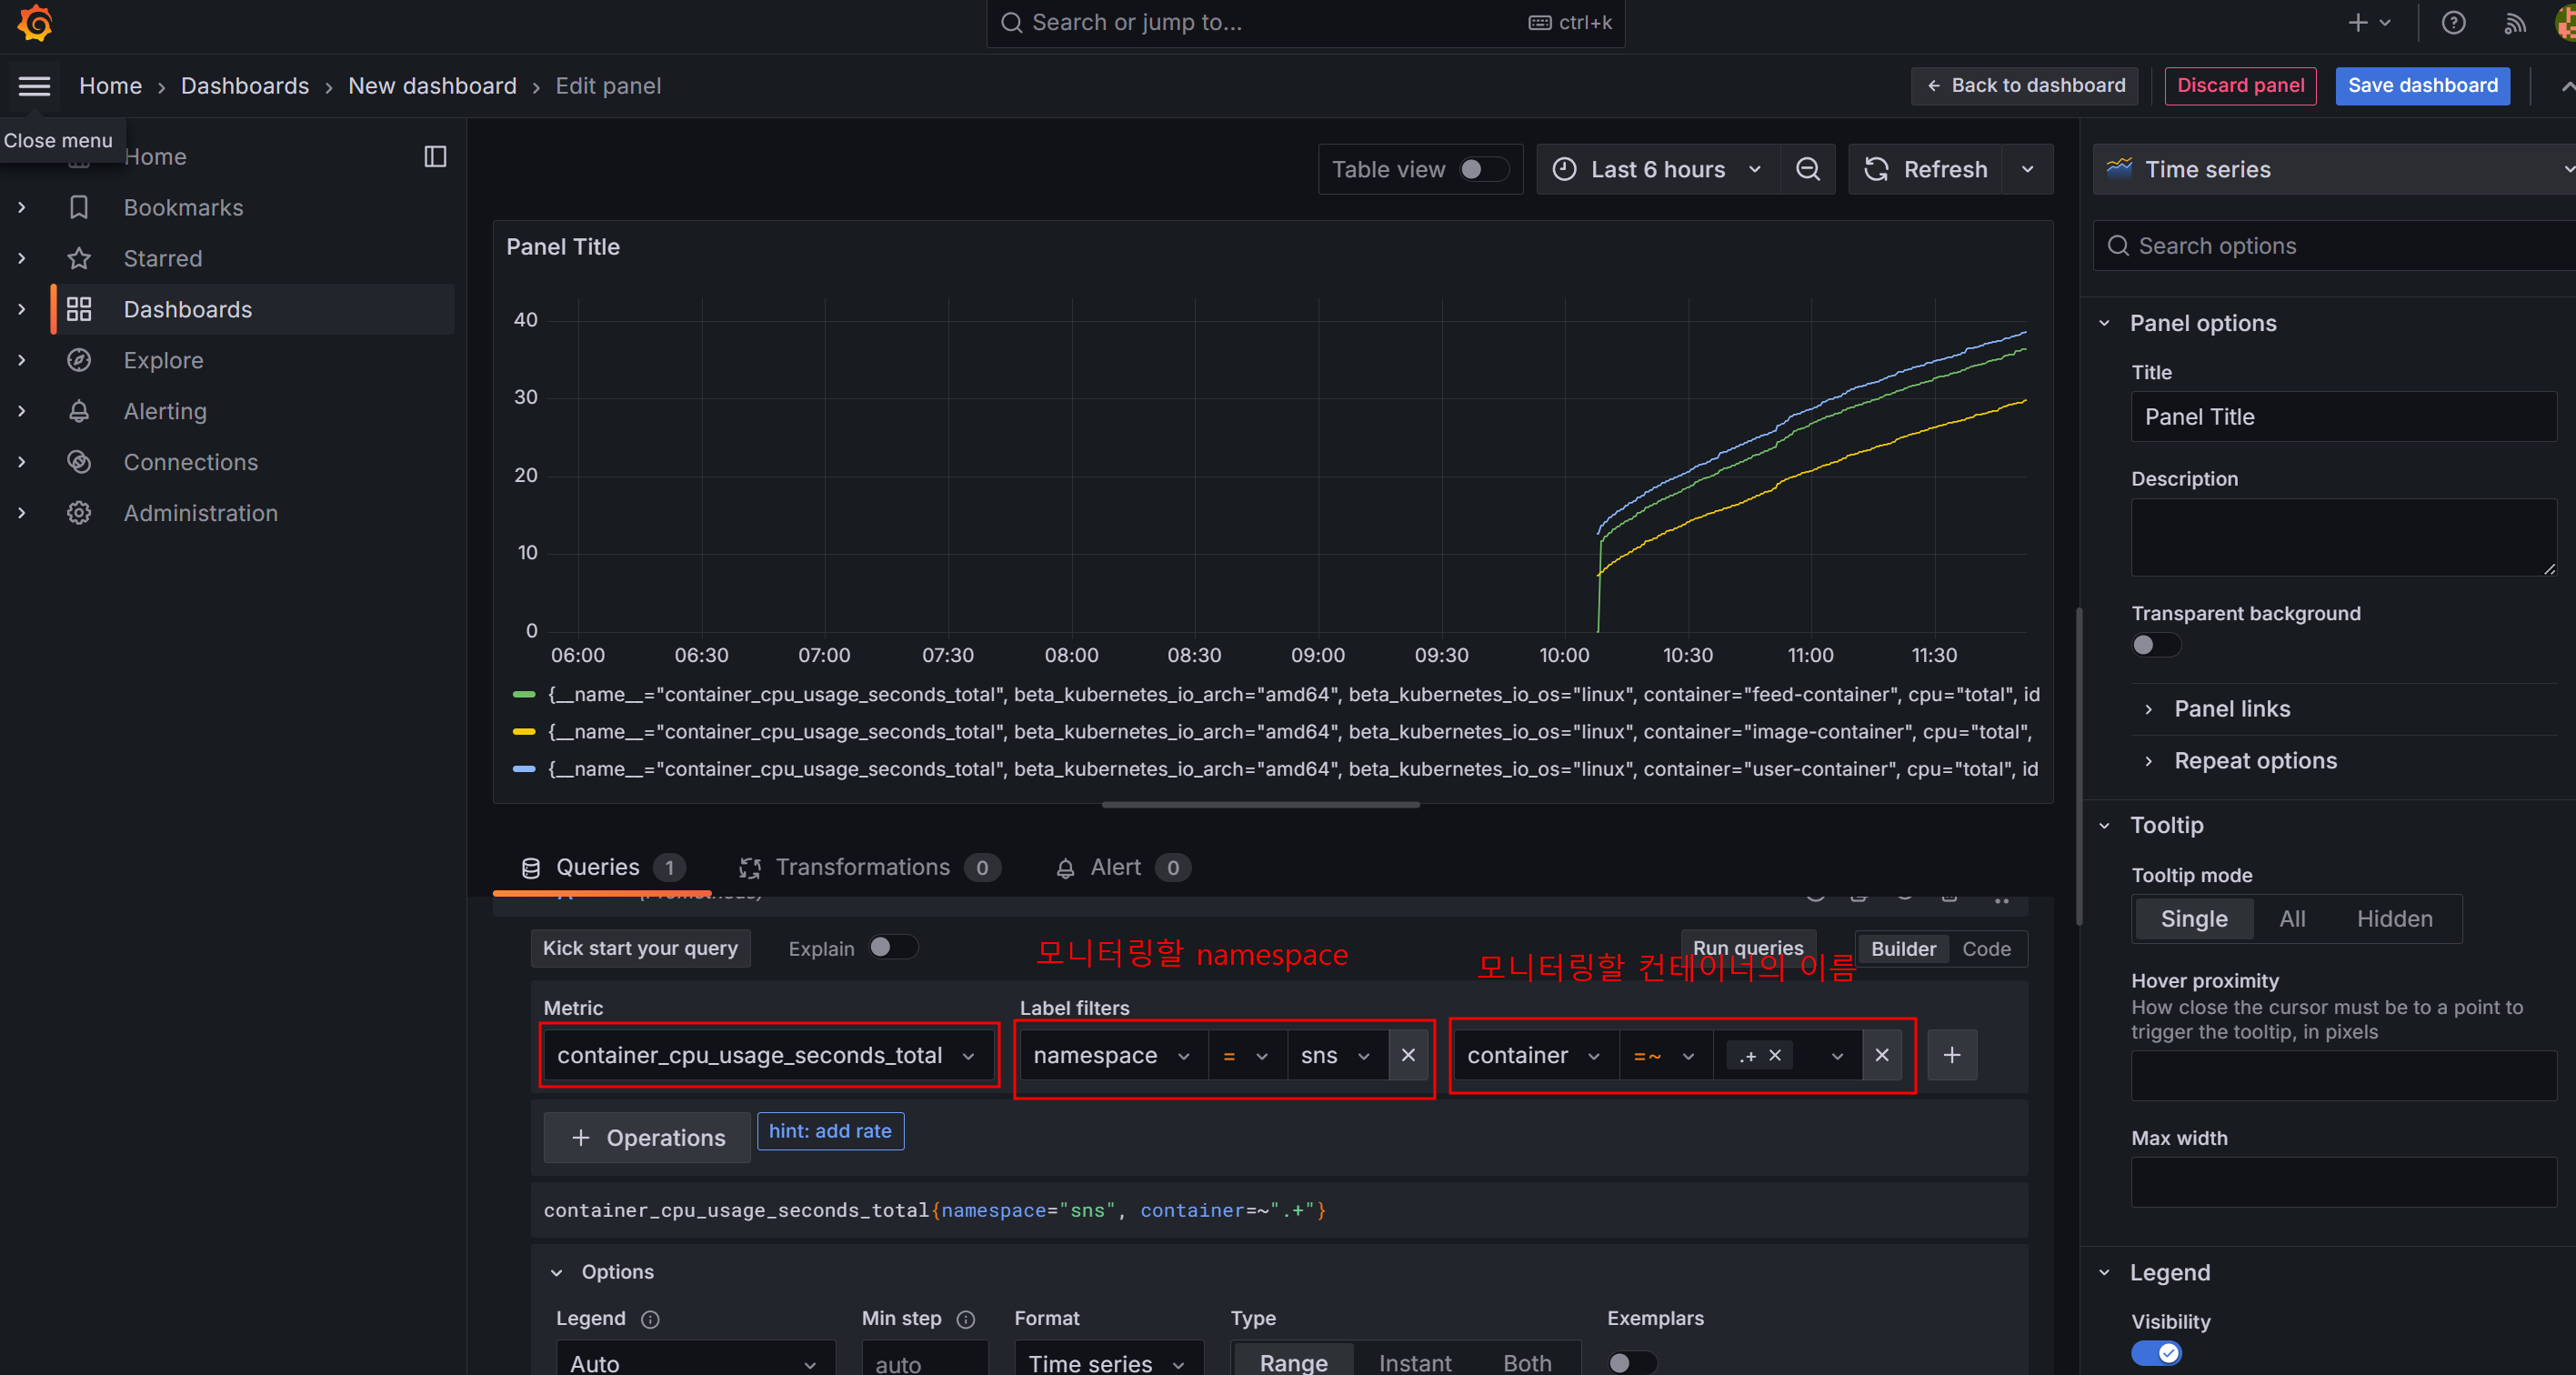
CPU 사용량을 원하는 k8s 컴포넌트에 대해서만 모니터링할 수 있도록 적절한 필터링 옵션을 준다.
4) Legend 변경
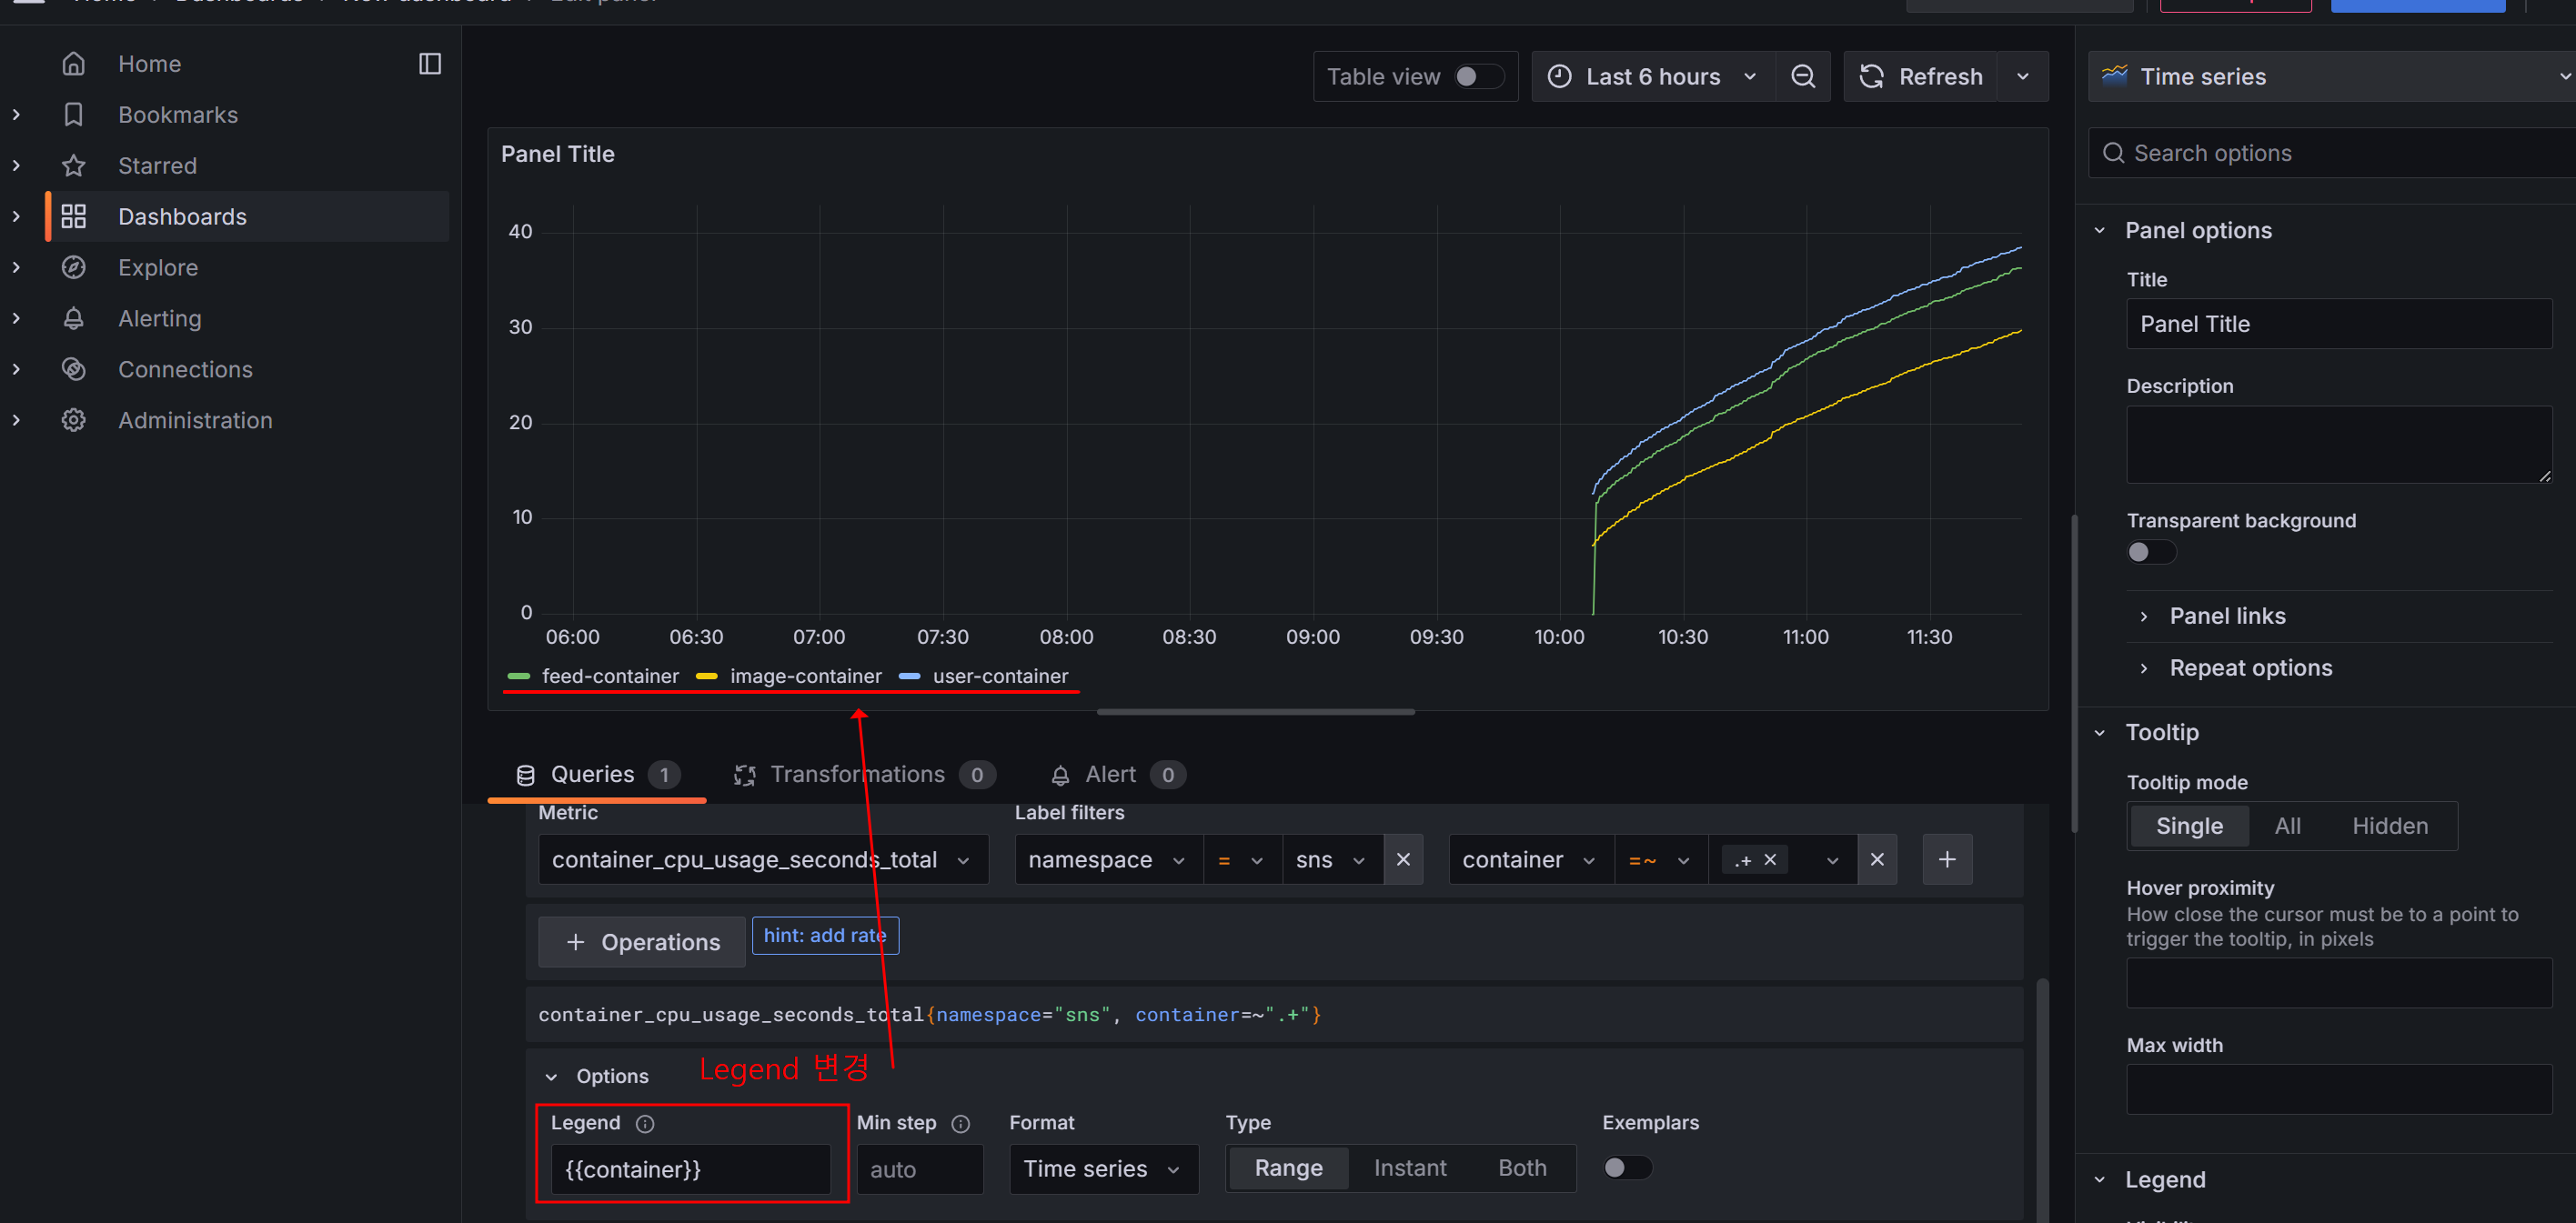
가독성 높은 형태로 Legend를 변경한다.
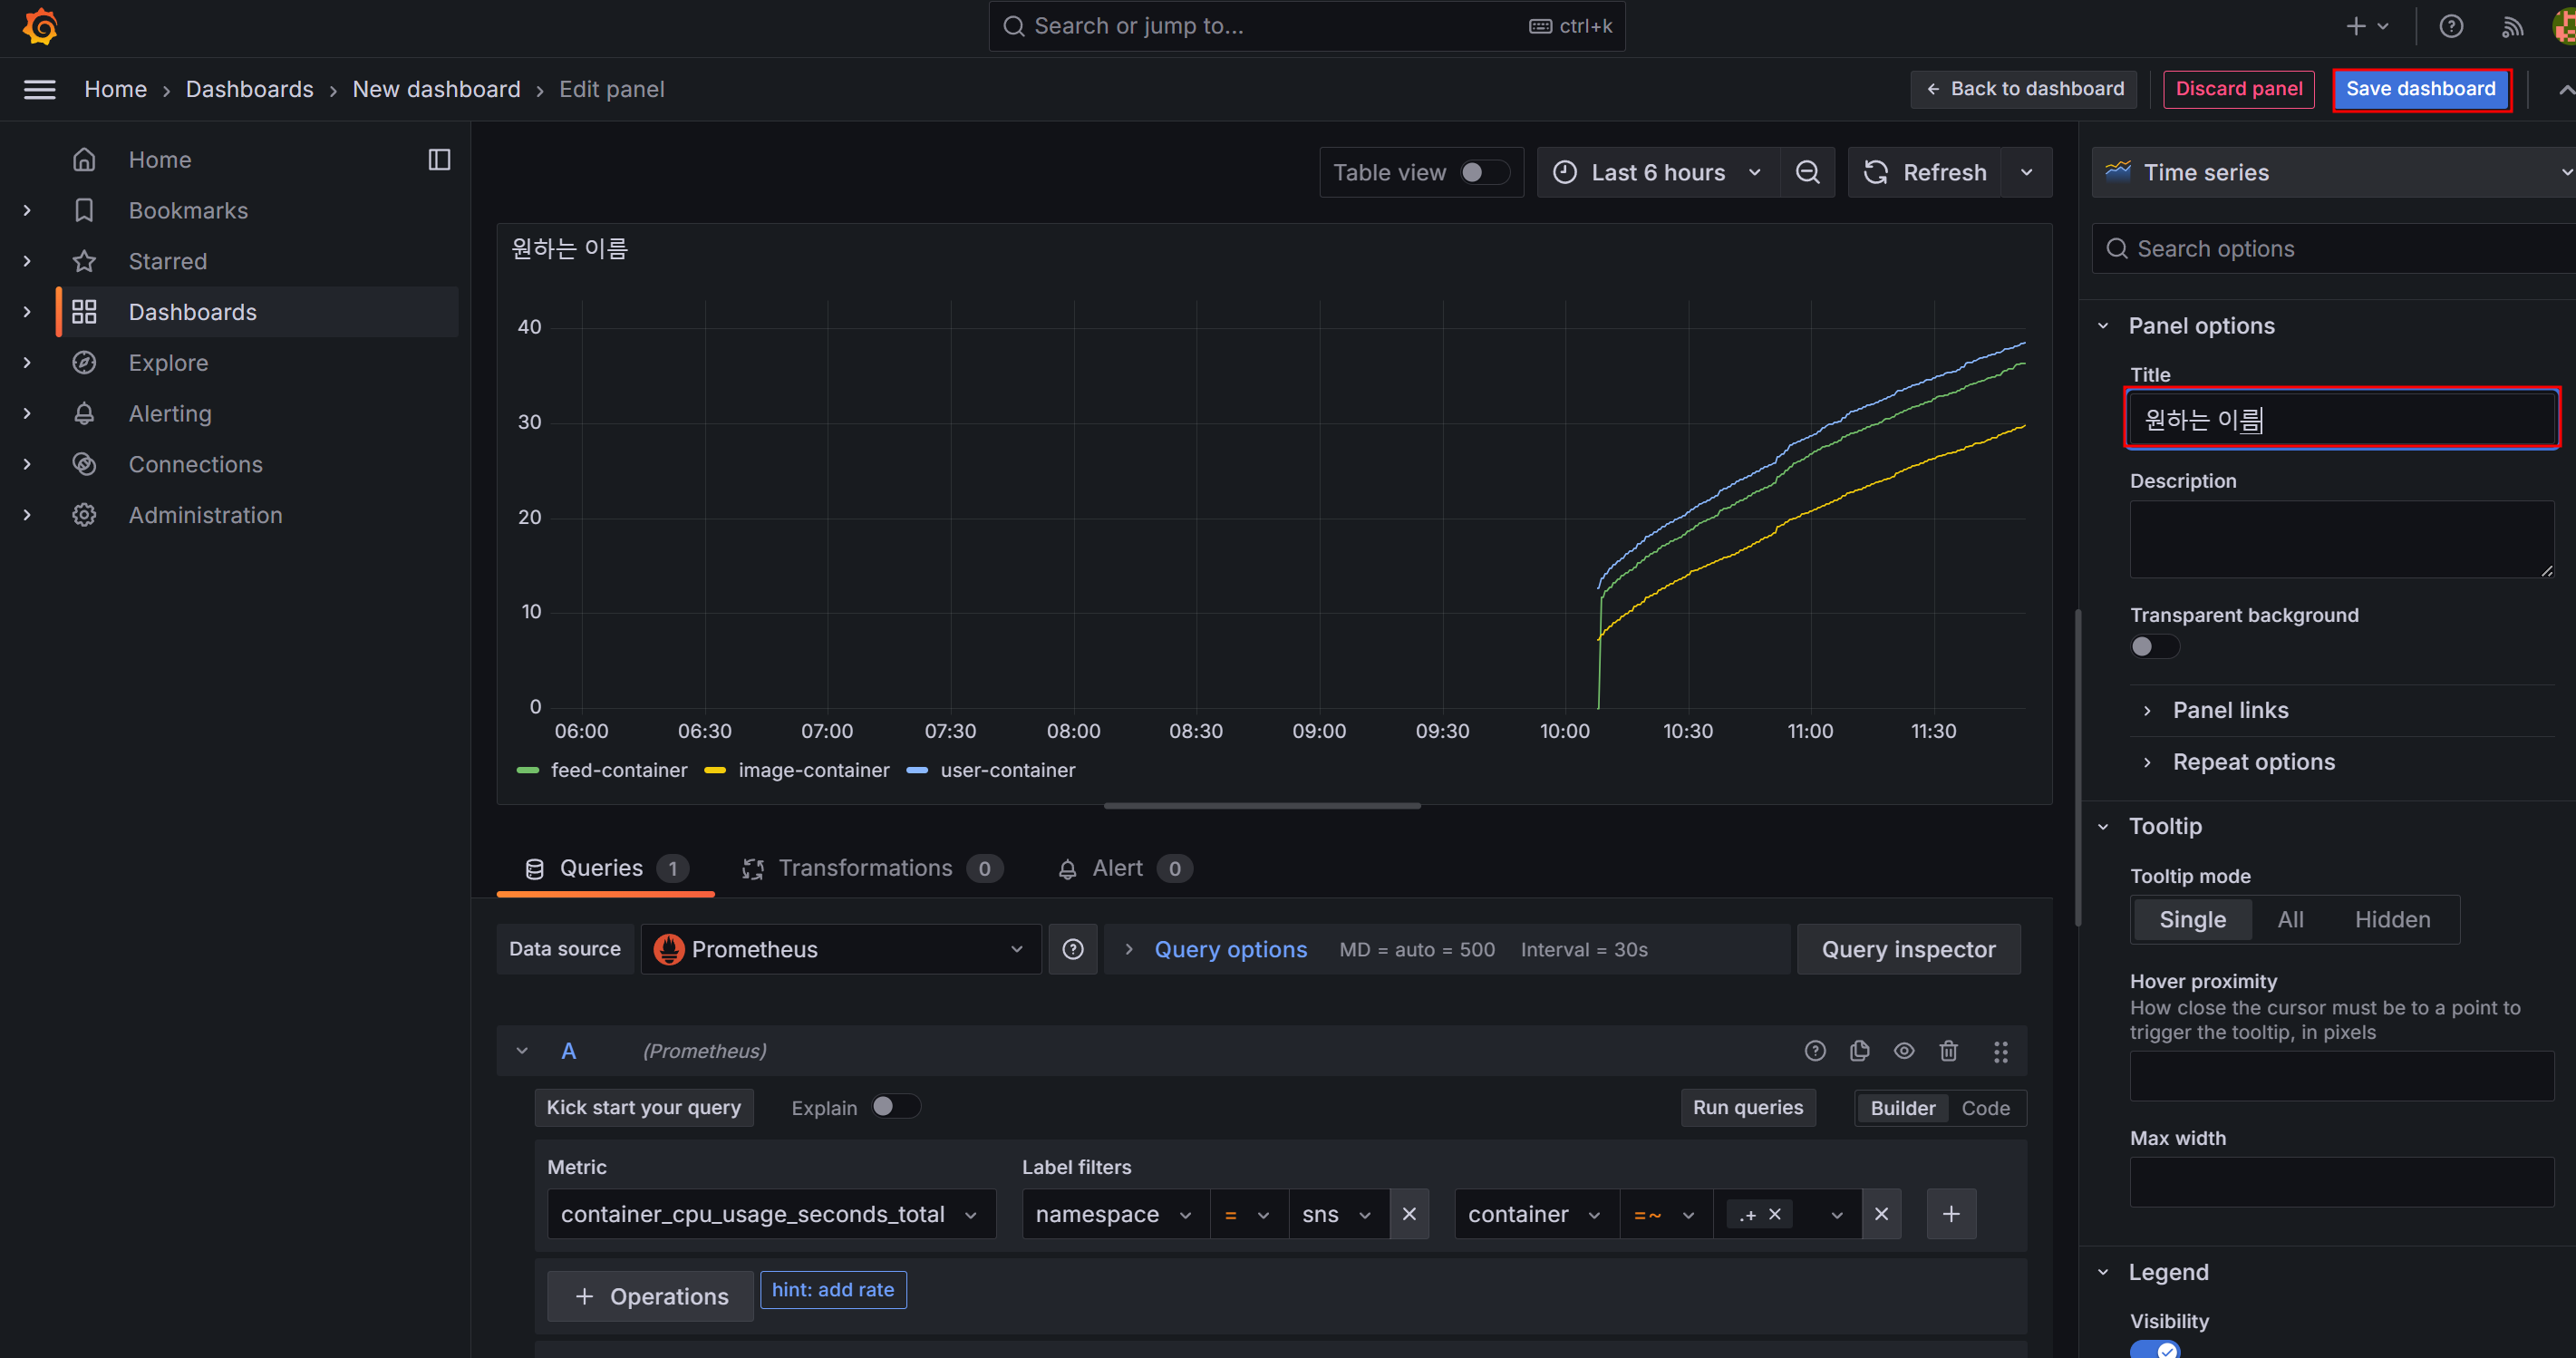
5) 그래프 저장
6) Memory 지표 선택 & 필터링
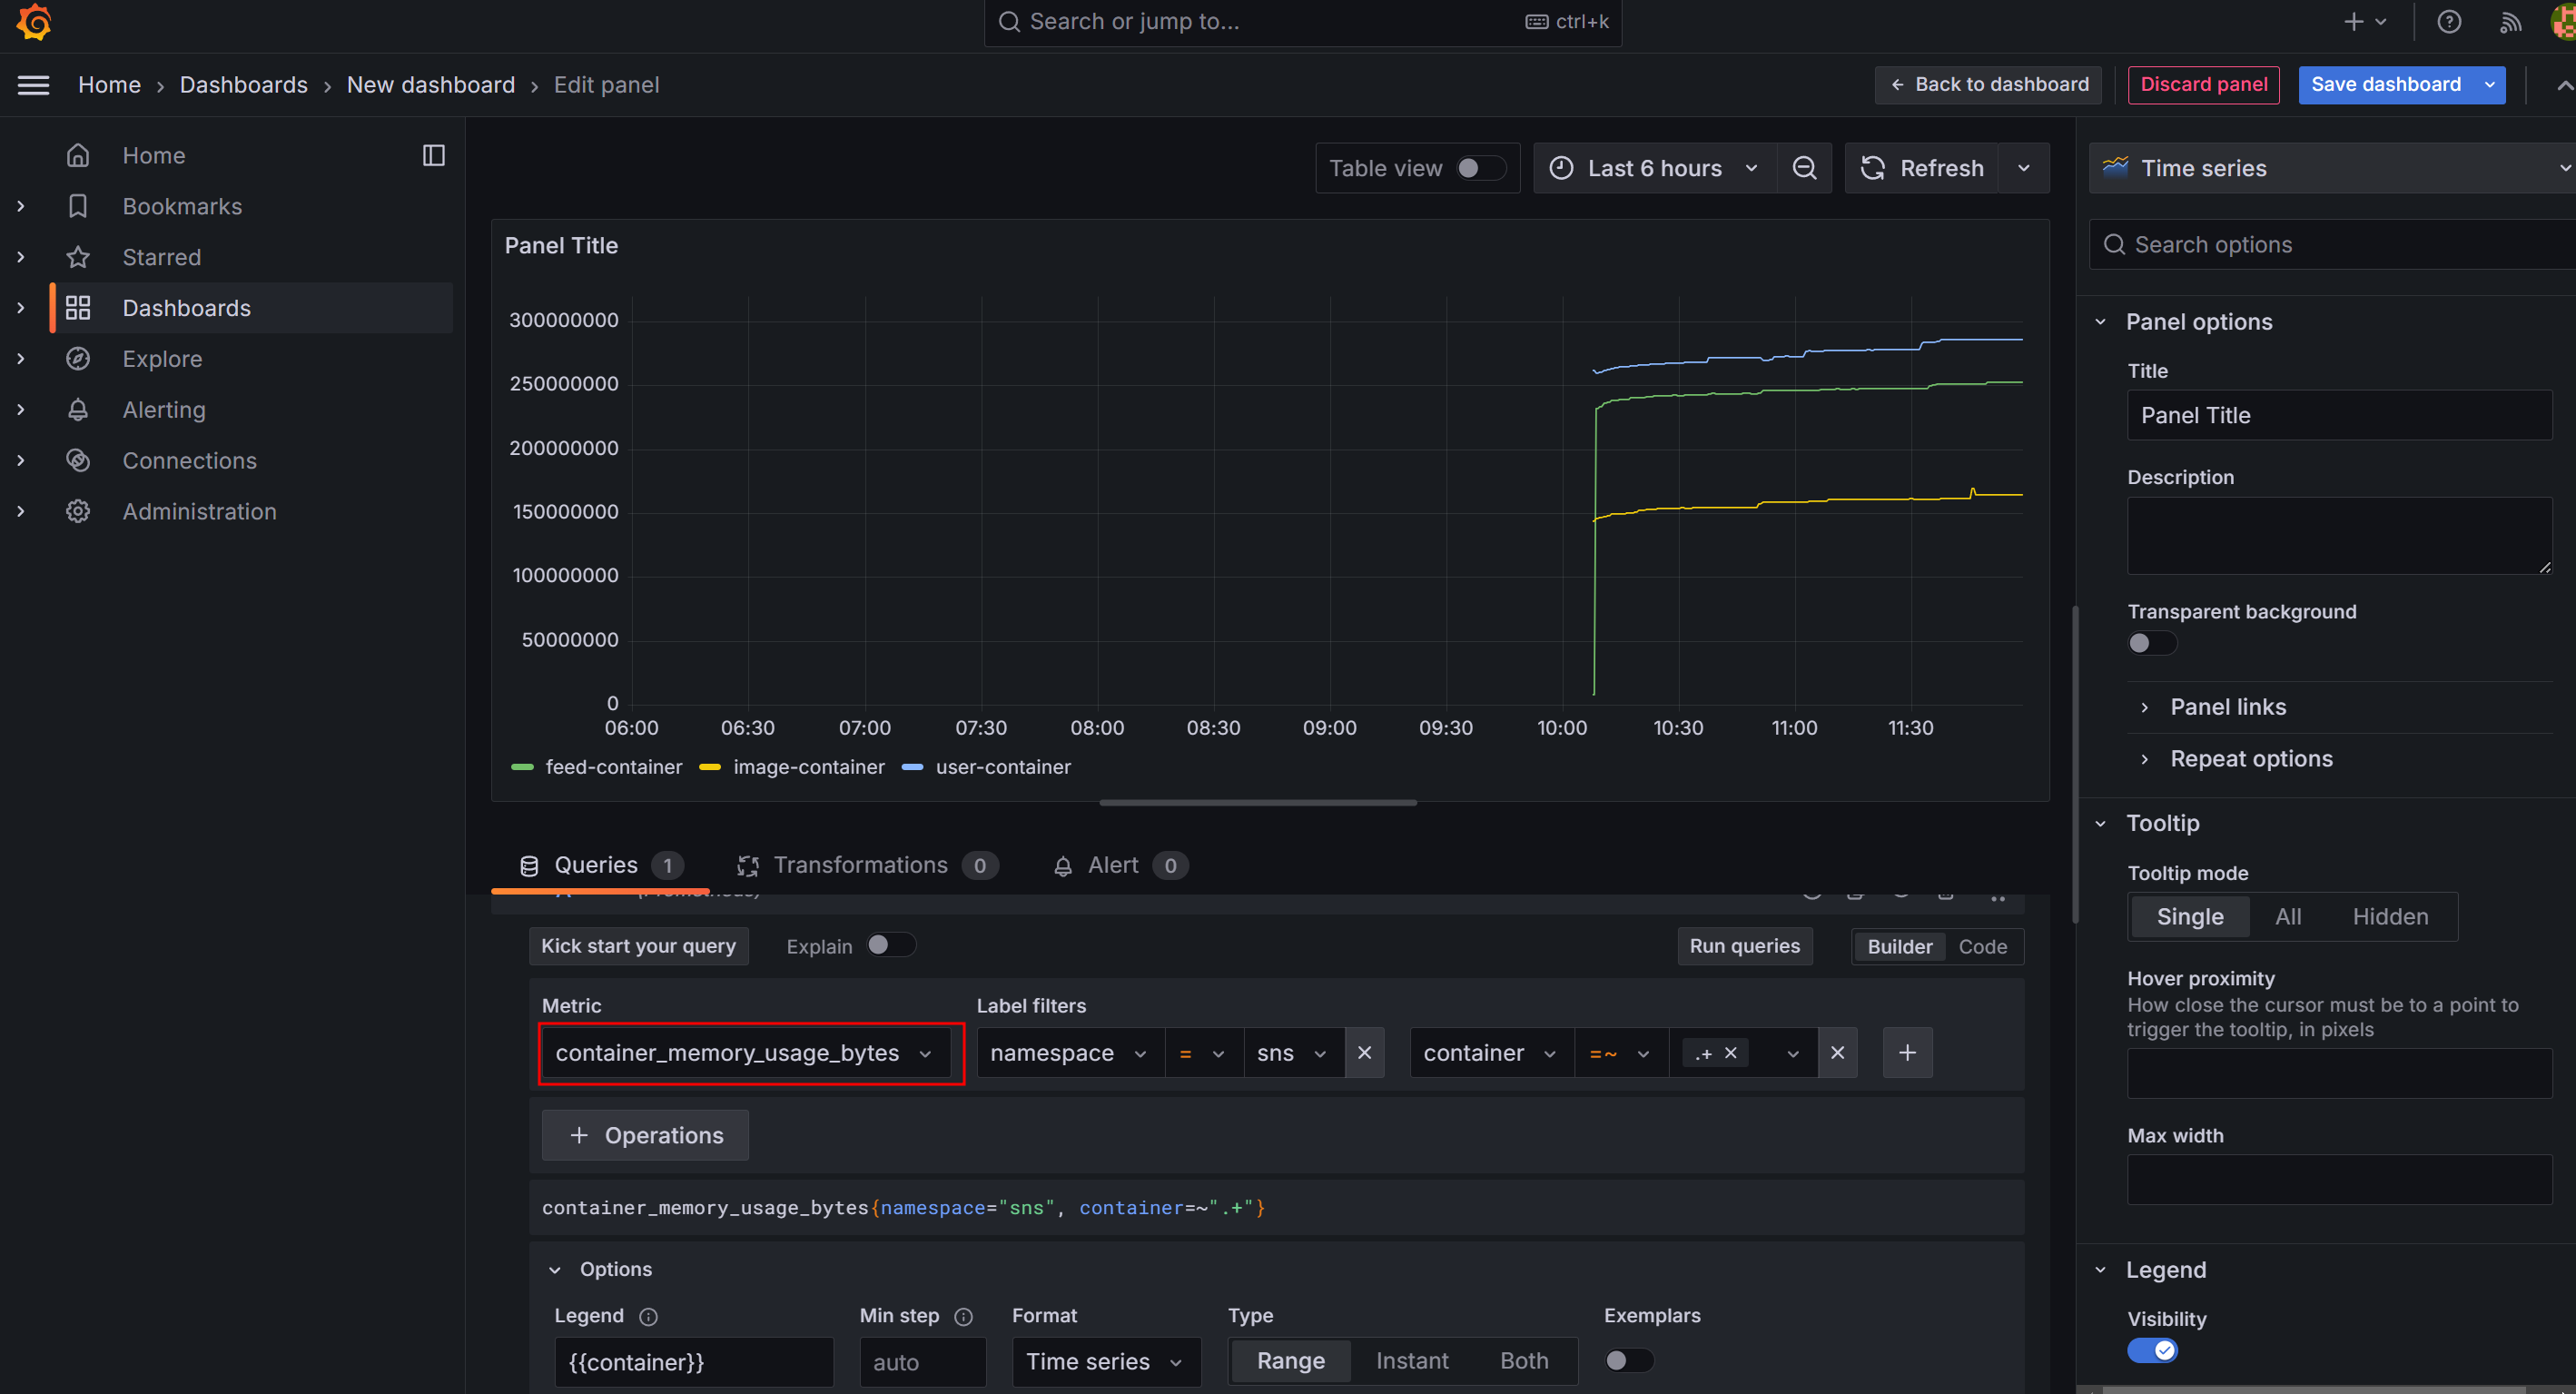
나머지는 CPU 사용량 그래프를 생성할 때와 동일하고, 지표만 container_memory_usage_bytes로 선택한다.
7) Memory 단위 변경
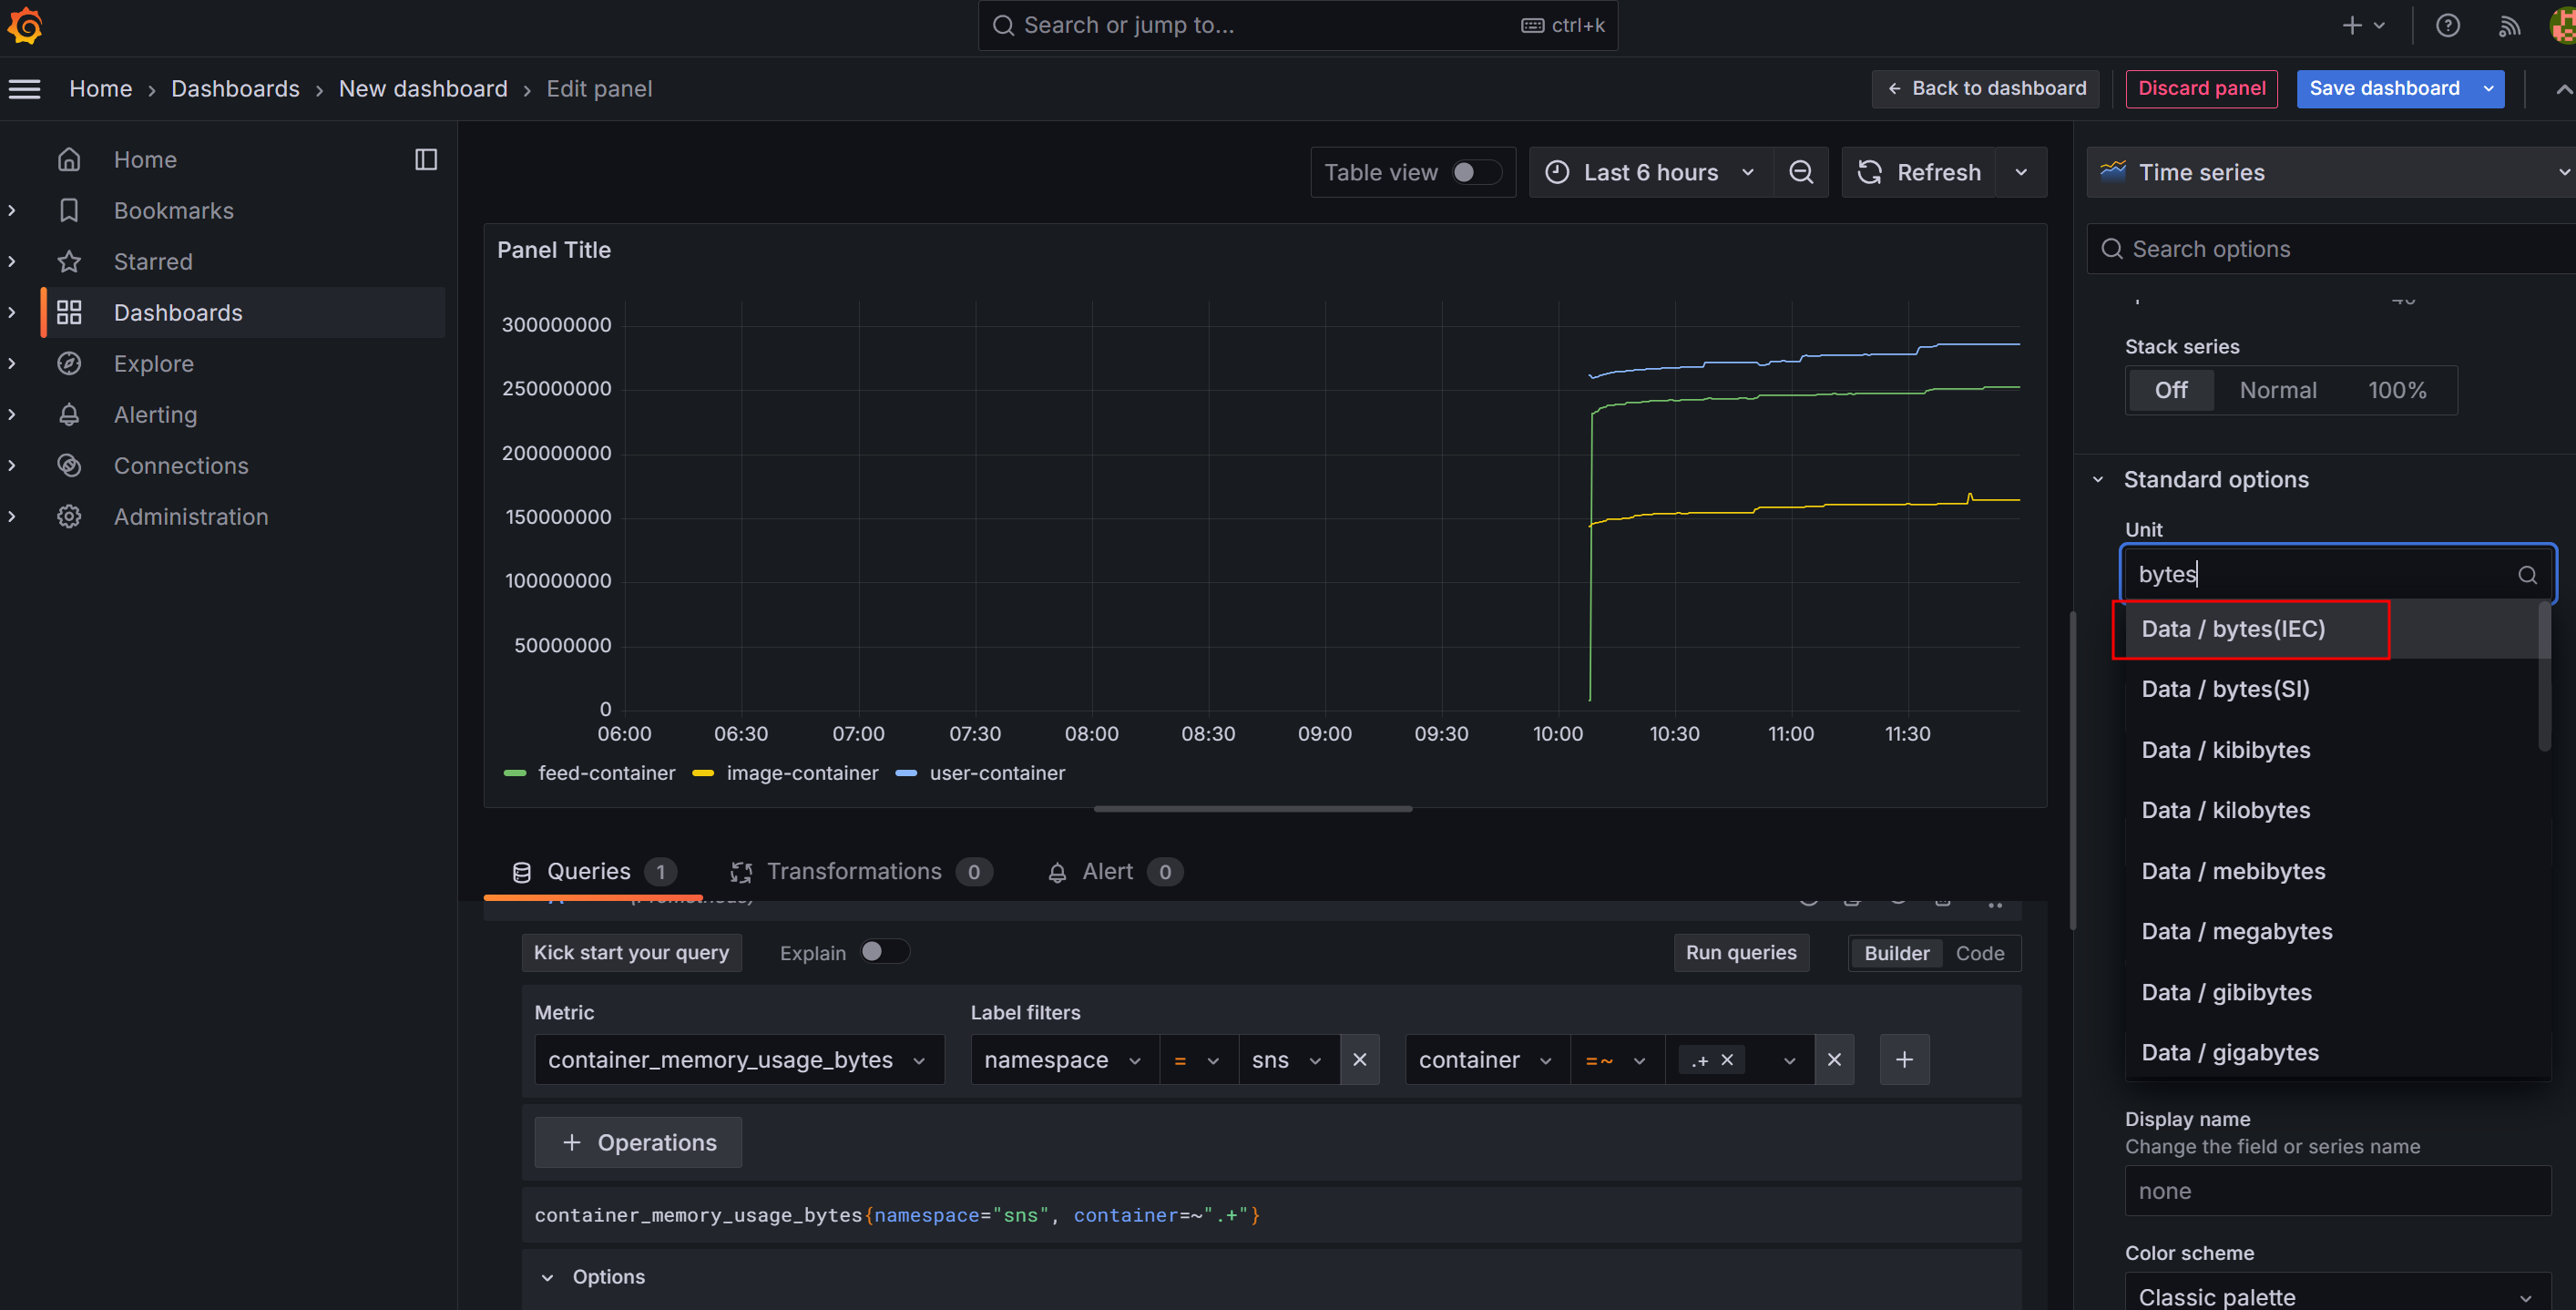
사람들에게 친숙한 단위로 변경한다.
8) 완성
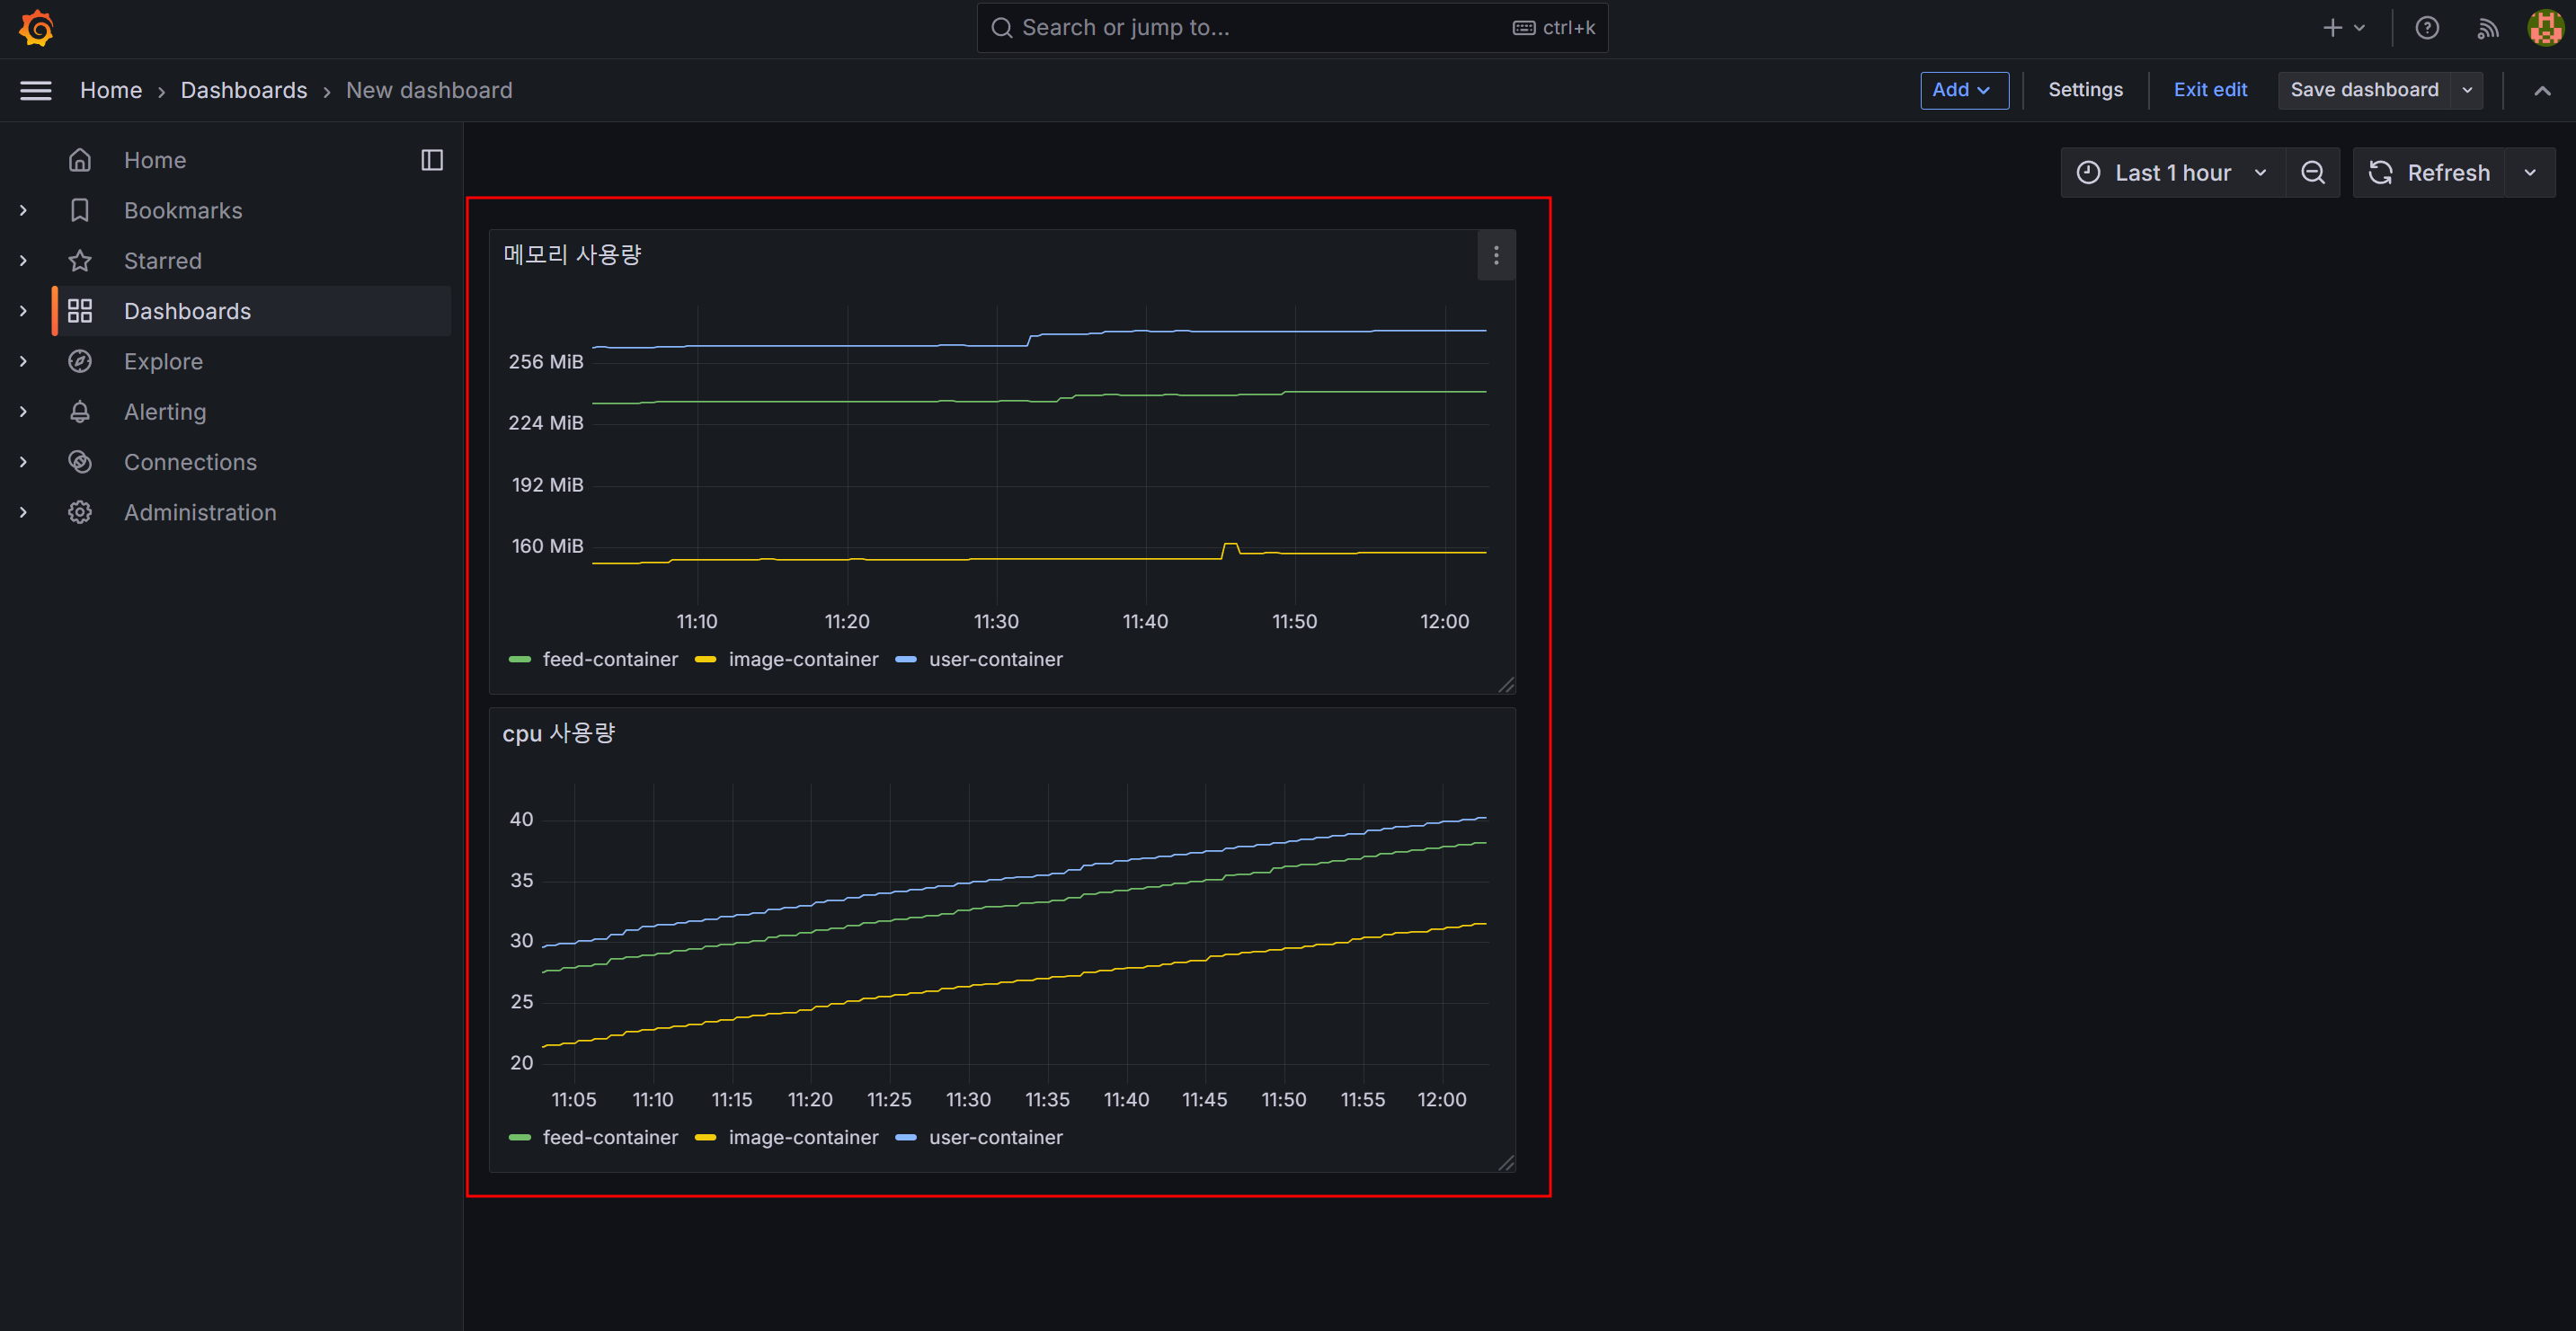
아주 간단한 형태이긴 하지만, 운영중인 서비스들의 CPU와 Memory 사용량을 모니터링할 수 있는 대시보드를 만들어보았다.
🐧 대시보드 가져오기
아시는 분들은 알고 있겠지만, 그라파나에 올라온 공식 또는 누군가 만든 대시보드를 가져다 사용할 수도 있으니, 훤칠한(?) 대시보드를 임포트해서 사용해보는 것도 좋을 것 같다.