조건
1. 서울시 구별 주유소 데이터 정보 크롤링을 통해 데이터 수집
- 수집한 데이터는 Pandas 데이터 프레임으로 정리
- 부가정보 데이터는 Y, N 으로 저장
- 데이터 컬럼은 총 14개 (컬럼 이름은 영문으로 저장)
- 주유소명, 주소, 브랜드, 휘발유 가격, 경유 가격
- 셀프 여부, 세차장 여부, 충전소 여부, 경정비 여부
- 편의점 여부, 24시간 운영 여부, 구, 위도, 경도
2. 휘발유와 경유 가격이 셀프 주유소에서 더 저렴한지 분석
1. 서울시 구별 주유소 데이터 정보 크롤링을 통해 데이터 수집
import time
from selenium import webdriver

from tqdm import tqdm
from bs4 import BeautifulSoup
from selenium.webdriver.common.by import By
from selenium.webdriver import ActionChains

#1. 주유소 웹사이트 불러오기
def loadOilWeb(driver):

    # 화면 최대 크기 설정
    driver.maximize_window()
    driver.get(url)
    #모든 창이 로딩 될떄까지 기다려 줌
    time.sleep(5)
    #팝업창 화면 전환 후 닫아주기
    driver.switch_to.window(driver.window_handles[-1])
    driver.close()
    time.sleep(3)
    # 접근 페이지 다시 요청
    driver.switch_to.window(driver.window_handles[-1])
    driver.get(url)
1. 주유소 웹사이트 불러오기
url="https://www.opinet.co.kr/searRgSelect.do"
driver=webdriver.Chrome('../driver/chromedriver.exe')
loadOilWeb(driver)
2. 서울시 구 리스트 추출
#서울 선택
sido_select=driver.find_element_by_id("SIDO_NM0")
sido_select.send_keys('서울')

time.sleep(2)

# 서울시 구 리스트 추출
sigungu_select=driver.find_element(By.ID,'SIGUNGU_NM0')
sigungu_options=sigungu_select.find_elements(By.TAG_NAME,'option')
sigungu_list= [ option.get_attribute('value') for option in sigungu_options] # 서울시 구 리스트
print(sigungu_list)
['', '강남구', '강동구', '강북구', '강서구', '관악구', '광진구', '구로구', '금천구', '노원구', '도봉구', '동대문구', '동작구', '마포구', '서대문구', '서초구', '성동구', '성북구', '송파구', '양천구', '영등포구', '용산구', '은평구', '종로구', '중구', '중랑구']
서울시 주유소 데이터 추출
- 데이터 컬럼은 총 14개 (컬럼 이름은 영문으로 저장)
- 주유소명, 주소, 브랜드, 휘발유 가격, 경유 가격 ( station, address, brand, gasoline price, diesel price)
- 셀프 여부, 세차장 여부, 충전소 여부, 경정비 여부 (self-service, car wash, charging station, light maintenance price)
- 편의점 여부, 24시간 운영 여부, 구, 위도, 경도 (convenience store, 24-hour, district, latitude, longitude)
주유소 세부정보
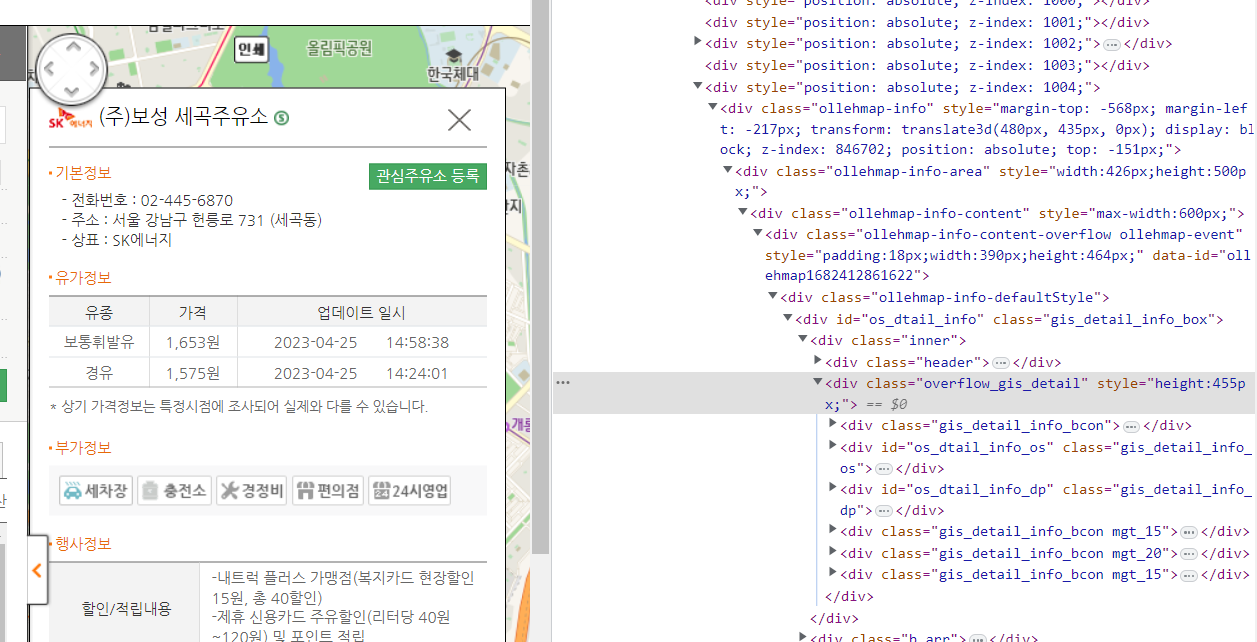
getInfoDetail : 서울시 주유소 세부 정보 가져오기
#Beautiful Soup을 이용하여 주유소 데이터 추출


def getInfoDetail(driver, seoul_gu):

    seoul_oil_station=[]
    gu_list=[] # 구
    car_wash_list=[] # 세차장
    charging_list=[] #충전소
    maintenance_list=[] #경정비
    convenience_list=[] #편의점
    sel24_list=[] #24시 영업
    self_list=[] #셀프
    name_list = [] #주유소 명
    brand_list=[] #브랜드
    address_list=[] #주소
    gasolin_price_list=[] # 가솔린가격
    diesel_price_list=[] #경유가격

    car_wash=''
    charging=''
    maintenance=''
    convenience=''
    sel24=''
    self=''

    req=driver.page_source
    soup=BeautifulSoup(req,'html.parser')
    result_oil_info=soup.select_one('.result_gis #os_price1 #body1')
    time.sleep(2)

    # 해당 구의 모든 주유소: 주유소명, 브랜드, 주소
    oil_detail_list=result_oil_info.select('.rlist')

    #구 리스트
    gu_list=[seoul_gu for i in range(len(oil_detail_list)) ]


    for idx, detail in tqdm(enumerate(oil_detail_list)):

        # 셀프 여부
        if '셀프' in detail.text.strip():
            self='Y'
        else:
            self='N'

        self_list.append(self)

        # inner info
        #Beautiful Soup을 이용하여 주유소 데이터 추출
        # 로딩되기 전 데이터를 불러올 경우 에러 발생

        rlist=driver.find_element(By.CSS_SELECTOR,f'#body1 > tr:nth-child({idx+1}) > td.rlist > a')

        time.sleep(4)

        # 각 주유소를 클릭해서 inner info 접근
        rlist.click()
        time.sleep(4)

        req=driver.page_source
        soup=BeautifulSoup(req,'html.parser')
        inner_station_info=soup.select_one('.ollehmap-info #os_dtail_info')

        name = inner_station_info.select_one('#os_nm').text #주유소 명
        brand=inner_station_info.select_one('#poll_div_nm').text #브랜드
        address=inner_station_info.select_one('#rd_addr').text #주소
        gasolin_price=inner_station_info.select_one('#b027_p').text # 가솔린가격
        diesel_price=inner_station_info.select_one('#d047_p').text #경유가격


        # 각 리스트에 추가
        name_list.append(name)
        brand_list.append(brand)
        address_list.append(address)
        gasolin_price_list.append(gasolin_price)
        diesel_price_list.append(diesel_price)


        # 부가정보 데이터
        # 세차장, 충전소, 경정비, 편의점, 24시 영업
        service_info=inner_station_info.select_one('.service')
        #세차장
        car_wash_img=service_info.select_one('#cwsh_yn').get('src')
        if 'off' in car_wash_img:
            car_wash='N'
        else:
            car_wash='Y'

        # 충전소
        charging_img=service_info.select_one('#lpg_yn').get('src')
        if 'off' in charging_img:
            charging='N'
        else:
            charging='Y'
        # 경정비
        maintenance_img=service_info.select_one('#maint_yn').get('src')
        if 'off' in maintenance_img:
            maintenance='N'
        else:
            maintenance='Y'
        #편의점
        convenience_img=service_info.select_one('#cvs_yn').get('src')
        if 'off' in convenience_img:
            convenience='N'
        else:
            convenience='Y'
        # 24시 영업
        sel24_img=service_info.select_one('#sel24_yn').get('src')
        if 'off' in convenience_img:
            sel24='N'
        else:
            sel24='Y'

        # 각 리스트에 추가
        car_wash_list.append(car_wash)
        charging_list.append(charging)
        maintenance_list.append(maintenance)
        convenience_list.append(convenience)
        sel24_list.append(sel24)

        time.sleep(2)


    # 주유소 데이터 통합
    data={
        '주유소명' : name_list,
        '주소' : address_list,
        '브랜드' : brand_list,
        '휘발유 가격' : gasolin_price_list,
        '경유 가격' : diesel_price_list,
        '셀프 여부' : self_list,
        '세차장 여부' : car_wash_list,
        '충전소 여부' : charging_list,
        '경정비 여부' : maintenance_list,
        '편의점 여부' : convenience_list,
        '24시간 운영 여부' : sel24_list,
        '구' : gu_list
    }

    print(data)


    return data
seoul_oil_station_dict={}

def getStationInfo(driver,sigungu_list):

    for gu in tqdm(sigungu_list[1:]):
        # 서울시 구 선택
        sigungu_select=driver.find_element(By.ID,'SIGUNGU_NM0')
        sigungu_select.send_keys(gu)
        time.sleep(2)
        # 군/구 버튼 클릭
        sigungu_btn = driver.find_element(By.CSS_SELECTOR,'#searRgSelect')
        sigungu_btn.click()
        time.sleep(3)
        # 주유소 딕셔너리에 구별 주유소 데이터 추가
        seoul_oil_station_dict[gu]=getInfoDetail(driver,gu)
        time.sleep(2)


    seoul_oil_station_dict

    driver.quit()


getStationInfo(driver, sigungu_list) #주유소 세부정보 가져오기
❗해설 영상에서는 driver을 통해세부 정보 가져오는 방법 사용 hiddentext 를 가져오기 위해서 element.get_attribute(innerText') 사용
❗ text는 화면에 안보이면 데이터를 불러오지 못하지만 , InnerText / innerHTML / TextContent 는 화면에 보이지 않더라도 데이터를 자져올 수 있다.
데이터 프레임으로 변환
- 컬럼명 영어로 변경
❗ 초기 데이터 수집시 복잡한 형태로 수집하여 데이터 프레임 변경 과정이 까다로워짐,,
import pandas as pd
import numpy as np

car_wash_dict_list=[] # 세차장
charging_dict_list=[] #충전소
maintenance_dict_list=[] #경정비
convenience_dict_list=[] #편의점
sel24_dict_list=[] #24시 영업
self_dict_list=[] #셀프
name_dict_list = [] #주유소 명
brand_dict_list=[] #브랜드
address_dict_list=[] #주소
gasolin_dict_price_list=[] # 가솔린가격
diesel_dict_price_list=[] #경유가격
gu_dict_list=[] # 구

for key in seoul_oil_station_dict:

    car_wash_dict_list+=[val for val in seoul_oil_station_dict[key]['세차장 여부']]
    charging_dict_list+=[val for val in seoul_oil_station_dict[key]['충전소 여부']]
    maintenance_dict_list+=[val for val in seoul_oil_station_dict[key]['경정비 여부']]
    convenience_dict_list+=[val for val in seoul_oil_station_dict[key]['편의점 여부']]
    sel24_dict_list+=[val for val in seoul_oil_station_dict[key]['24시간 운영 여부']]
    self_dict_list+=[val for val in seoul_oil_station_dict[key]['셀프 여부']]
    name_dict_list+=[val for val in seoul_oil_station_dict[key]['주유소명']]
    brand_dict_list+=[val for val in seoul_oil_station_dict[key]['브랜드']]
    address_dict_list+=[val for val in seoul_oil_station_dict[key]['주소']]
    gasolin_dict_price_list+=[val for val in seoul_oil_station_dict[key]['휘발유 가격']]
    diesel_dict_price_list+=[val for val in seoul_oil_station_dict[key]['경유 가격']]
    gu_dict_list+=[val for val in seoul_oil_station_dict[key]['구']]
위도, 경도 정보 추가
- 구글맵 이용
import googlemaps

gmaps_key=''
gmaps=googlemaps.Client(key=gmaps_key)

oil_station_df['lat']=np.nan
oil_station_df['lng']=np.nan

for idx, rows in oil_station_df.iterrows():
    station_address=rows['address']
    tmp=gmaps.geocode(station_address,language='ko')
    lat=tmp[0]['geometry']['location']['lat']
    lng=tmp[0]['geometry']['location']['lng']
    address=tmp[0]['formatted_address'].split()[2]
    oil_station_df.loc[idx,'lat']=lat
    oil_station_df.loc[idx,'lng']=lng


oil_station_df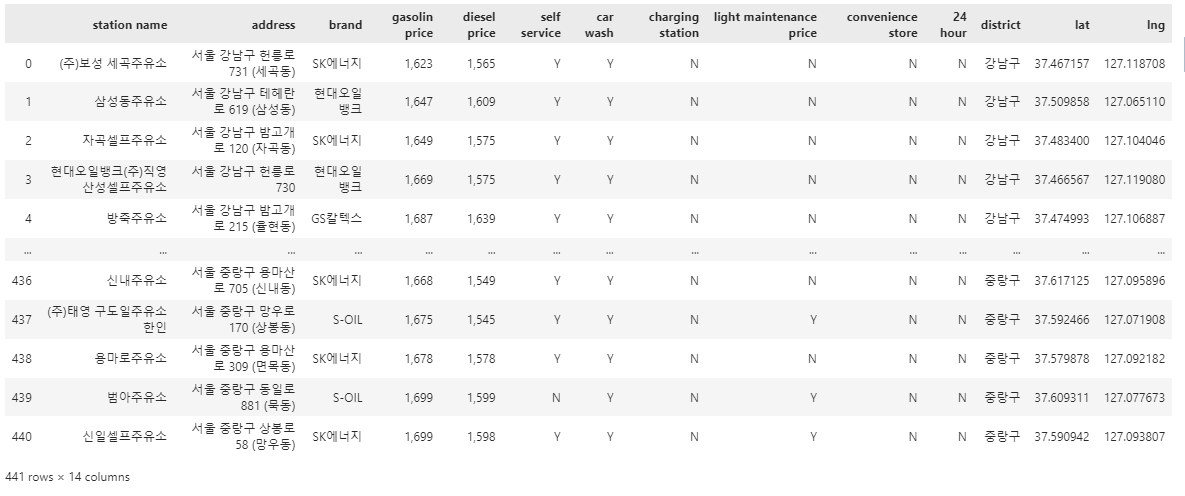
데이터 저장
oil_station_df.to_csv('../data/seoul_oil_station_info_data.csv',sep=',',encoding='utf-8')2. 휘발유와 경유 가격이 셀프 주유소에서 더 저렴한지 분석
데이터 가져오기
import pandas as pd
import numpy as np

df_oil_station=pd.read_csv('../data/seoul_oil_station_info_data.csv',index_col=0)
df_oil_station
데이터 검증과 전처리
- 결측치 확인
- 데이터 타입 변경
df_oil_station.info()<class 'pandas.core.frame.DataFrame'>
Int64Index: 441 entries, 0 to 440
Data columns (total 14 columns):
# Column Non-Null Count Dtype
--- ------ -------------- -----
0 station name 441 non-null object
1 address 441 non-null object
2 brand 441 non-null object
3 gasolin price 441 non-null object
4 diesel price 441 non-null object
5 self service 441 non-null object
6 car wash 441 non-null object
7 charging station 441 non-null object
8 light maintenance price 441 non-null object
9 convenience store 441 non-null object
10 24 hour 441 non-null object
11 district 441 non-null object
12 lat 441 non-null float64
13 lng 441 non-null float64
dtypes: float64(2), object(12)
memory usage: 51.7+ KB범주형 데이터를 수치형으로 변경
df_oil_station[['gasolin price', 'diesel price']]=df_oil_station[['gasolin price', 'diesel price']].apply(lambda x:x.str.replace(',','')).astype(int)
df_oil_station.info()<class 'pandas.core.frame.DataFrame'>
Int64Index: 441 entries, 0 to 440
Data columns (total 14 columns):
# Column Non-Null Count Dtype
--- ------ -------------- -----
0 station name 441 non-null object
1 address 441 non-null object
2 brand 441 non-null object
3 gasolin price 441 non-null int32
4 diesel price 441 non-null int32
5 self service 441 non-null object
6 car wash 441 non-null object
7 charging station 441 non-null object
8 light maintenance price 441 non-null object
9 convenience store 441 non-null object
10 24 hour 441 non-null object
11 district 441 non-null object
12 lat 441 non-null float64
13 lng 441 non-null float64
dtypes: float64(2), int32(2), object(10)
memory usage: 48.2+ KB# 범주형 데이터 수치형 데이터로 변환
df_oil_station_nemberic=df_oil_station.copy()
df_oil_station_nemberic.iloc[:,5:-3]=df_oil_station_nemberic.iloc[:,5:-3].applymap(lambda x: 1 if x=='Y' else 0)
df_oil_station_nemberic.head()
# df_oil_station_nemberic[:,5:-3]=df_zero_one
# df_oil_station_nemberic데이터 정규화
- 나중에 데이터 시각화 과정에서 사용하기 위해 데이터 정규화
# 구별 서비스 시행 유무 개수
service_col=['self service','car wash','charging station','light maintenance price','convenience store','24 hour']
df_oil_station_service_cnt=df_oil_station_nemberic.groupby('district')[service_col].agg('sum')
df_oil_station_service_cnt.head()
# 구별 평균 휘발유, 경유 가격
df_oil_price_pivot=df_oil_station_nemberic.groupby('district')[['gasolin price','diesel price']].agg('mean')
df_oil_price_pivot
# 구별 주유소 개수
district_oil_station_cnt=df_oil_station_nemberic.groupby('district')[['gasolin price']].agg('count')
district_oil_station_cnt.columns=['oil station cnt']
# 구별 데이터 병합
df_service_cnt_price=pd.concat([district_oil_station_cnt,df_oil_station_service_cnt,df_oil_price_pivot], axis=1)
df_service_cnt_price.sort_values(by='gasolin price',ascending=False).head()
#정규화
col=df_service_cnt_price.columns
service_cnt_norm=df_service_cnt_price[col]/df_service_cnt_price[col].max()
service_cnt_norm.head()
셀프 주유소와 일반 주유소의 휘발유과 경유 가격 비교
셀프 주유소의 휘발유와 경유 평균 가격이 약 150 (원 / 리터) 정도 더 비싸다.
df_self_price=df_oil_station.groupby(['self service'])[['gasolin price', 'diesel price']].agg('mean')
df_self_price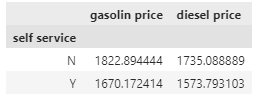
서울시 구별 셀프 주유소인 경우와 아닌 경우로 나누어서 평균 가격 보기
- 대부분 셀프 주유소의 가격이 더 저렴하나 아닌 경우도 존재한다.
df_self_price_pivot=df_oil_station.pivot_table(values=['gasolin price','diesel price'],
                           columns=['self service'],
                           index=['district',], aggfunc='mean')

df_self_price_pivot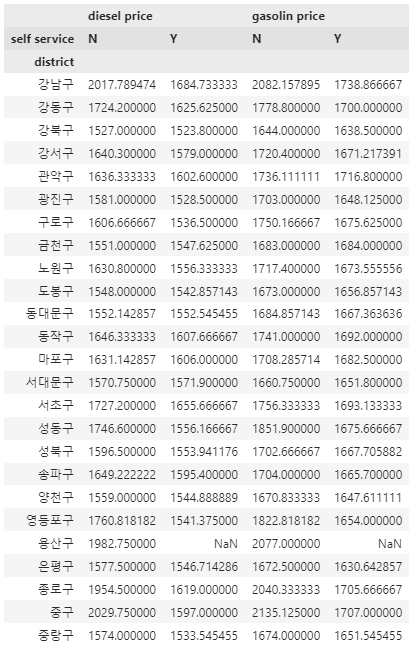
데이터 시각화
# %load set_matplotlib_hangul

import matplotlib.pyplot as plt
from matplotlib import font_manager, rc
import seaborn as sns
import platform

# %matplotlib inline
get_ipython().run_line_magic("matplotlib","inline")

path='C:/Windows/Fonts/malgun.ttf'
plt.rcParams['axes.unicode_minus'] = False

if platform.system()=="Darwin": #mac
    rc("font",family='Arial Unicodes MS')
    sns.set(font='Arial Unicodes MS',
        rc={"axes.unicode_minus":False}),
    print('MAC Hangul OK')
elif platform.system()=="Windows":  #window
    font_name=font_manager.FontProperties(fname=path).get_name()
    rc("font",family=font_name)
    sns.set(font=font_name,
    rc={"axes.unicode_minus":False})
    print('WIndow Hangul OK')

else:
    print('Unknown System')
Seaborn 을 이용한 데이터 시각화
stripplot, pointplot
셀프 주유소 가격 비교 : 휘발유
# Show each observation with a scatterplot

def drawStripPoint(x,y,hue):
    plt.figure(figsize=(14,10))
#     sns.set(font="Malgun Gothic",
#             rc={"axes.unicode_minus":False},
#             style="darkgrid")

    sns.set_context("poster", font_scale = .6)
    sns.stripplot(
        data=df_oil_station, x=x, y=y, hue=hue,
        dodge=True, alpha=.35, zorder=1, legend=False,
        palette='seismic'
    )

    sns.pointplot(
        data=df_oil_station, x=x, y=y, hue=hue,
        join=True, palette="seismic",
        markers="o", scale=.50, errorbar=None,
        linestyles='-.'

    )

    plt.grid(True)
    plt.show()
구별 셀프 주유소 가격 비교 : 휘발유
셀프 주유소가 없는 구도 존재한다. (용산구)
금천구 용산구 제외 대부분 셀프주유소의 휘발유 가격이 더 저렴한것을 확인할 수 있다.
대략 평균적으로 적게는 리터당 100원 이하에서 400원까지 차이가 나는걸로 보인다.
중구에서 가격 차이가 가장 큰것을 볼 수 있다.
drawStripPoint('gasolin price', 'district', 'self service')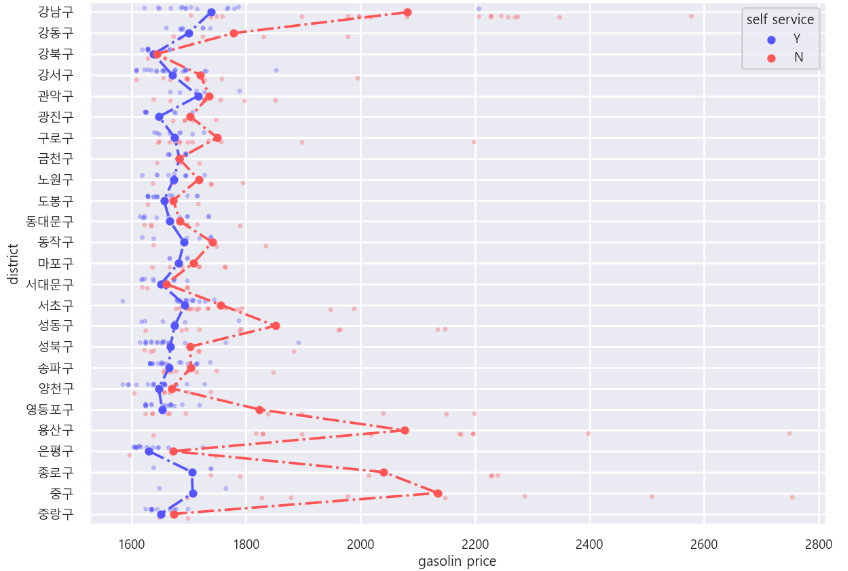
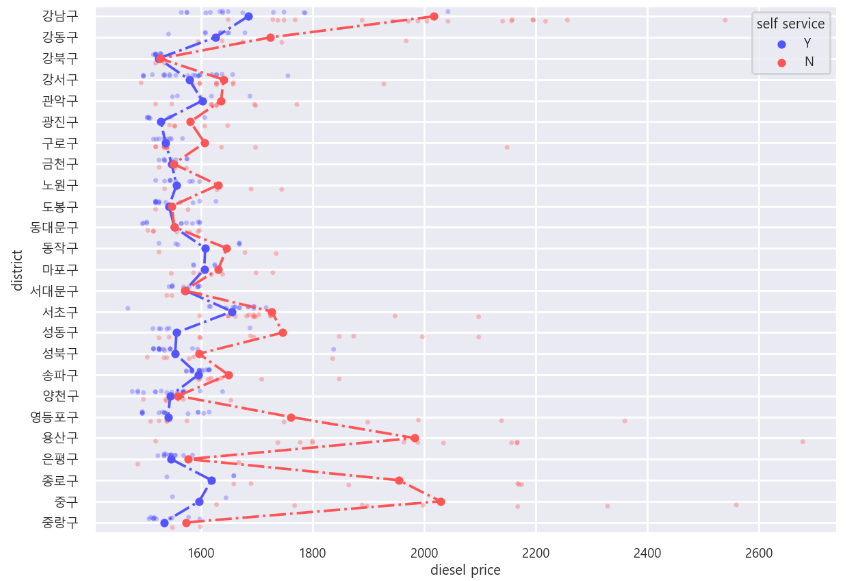
셀프 주유소 가격 비교 : 경유
셀프 주유소가 없는 구도 존재한다. (용산구)
전체적으로 셀프주유소의 경유 가격이 더 저렴한것을 확인할 수 있지만 휘발유 보다는 가격 차이 적을걸 볼 수 있다.
가격의 차이가 거의 나지 않는 곳도 보인다 : 강북구, 동대문구, 서대문구, 금천구
경유 또한 중구에서 가격 차이가 가장 큰것을 볼 수 있다.
Folium을 이용한 지도 시각화
import json
import folium
import pandas as pd
import numpy as np

geo_path='../data/02. skorea_municipalities_geo_simple.json'
geo_str=json.load(open(geo_path,encoding='utf-8'))
drawChoropleth , drawMarker 함수 생성
- Choropleth 을 이용하 서울시 지도 그래프 생성
- 지도 위에 구별 주유소 마커 표시
- 파란색 마커 : 셀프 주유소, 노란색 마커 : 일반 주유소
- tooltip을 이용해서 정보 표시
# 경계선 추가
def drawChoropleth(my_map,data,cols,legend):

    folium.Choropleth(
        geo_data=geo_str,
        data=data,
        columns=cols,
        key_on='feature.id',
        fill_color='PuRd',
        fill_opacity=0.7,
        line_opacity=0.2,
        legend_name=legend
    ).add_to(my_map)


def drawMarker(my_map, oil_name, price_col):
    for idx, rows in df_oil_station.iterrows():
        tooltipY=f"주유소 명 : {rows['station name']}<br>셀프 주유소 : {rows['self service']} <br>{oil_name} 가격 : {rows[price_col]} (원/리터)"
        tooltipN=f"주유소 명 : {rows['station name']}<br>셀프 주유소 : {rows['self service']} <br>{oil_name} 가격 : {rows[price_col]} (원/리터)"

        if rows['self service']=='Y':
            folium.CircleMarker(
                location = [rows['lat'],rows['lng']],
                radius = 8,
                fill= True,
                color='#0090ff',
                fill_color='#0090ff',
                weight = 2,
                tooltip=tooltipY,

        ).add_to(my_map)
        else :
            folium.CircleMarker(
                location = [rows['lat'],rows['lng']],
                radius = 8,
                fill= True,
                color='#ff913d',
                fill_color='#ffc311',
                weight = 2,
                tooltip=tooltipN,

        ).add_to(my_map)
구별 경유가격 시각화
- 노란색 마커 (일반주유소) 가 밀집된 지역의 경유 가격이 높을걸 확인할 수있다.
- 서울 외곽으로 갈 수록 셀프 주유소의 수가 많아지며 중심부일 수록 셀프주유소의 수가 적다
my_map=folium.Map(
    location=[37.541, 126.986], #서울시 좌표
    zoom_start=12,
    tiles='Stamen Toner'
)

drawChoropleth(my_map,
               df_oil_price_pivot['diesel price'],
               [df_oil_price_pivot.index,df_oil_price_pivot['diesel price']],
               '서울시 구별 경유 가격')


drawMarker(my_map,'경유','diesel price')


my_map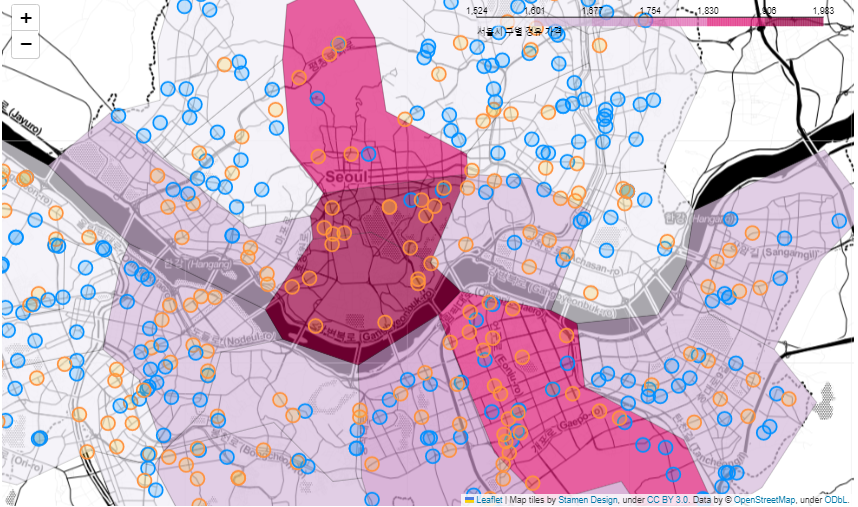
구별 휘발유 가격 시각화
- 노란색 마커 (일반주유소) 가 밀집된 지역의 휘발유 가격이 높을걸 확인할 수있다.
- 서울 외곽으로 갈 수록 셀프 주유소의 수가 많아지며 중심부일 수록 셀프주유소의 수가 적다
my_map=folium.Map(
    location=[37.541, 126.986], #서울시 좌표
    zoom_start=12,
    tiles='Stamen Toner'
)

drawChoropleth(my_map,
               df_oil_price_pivot['gasolin price'],
               [df_oil_price_pivot.index,df_oil_price_pivot['gasolin price']],
               '서울시 구별 휘발유 가격')


drawMarker(my_map,'휘발유','gasolin price')


my_map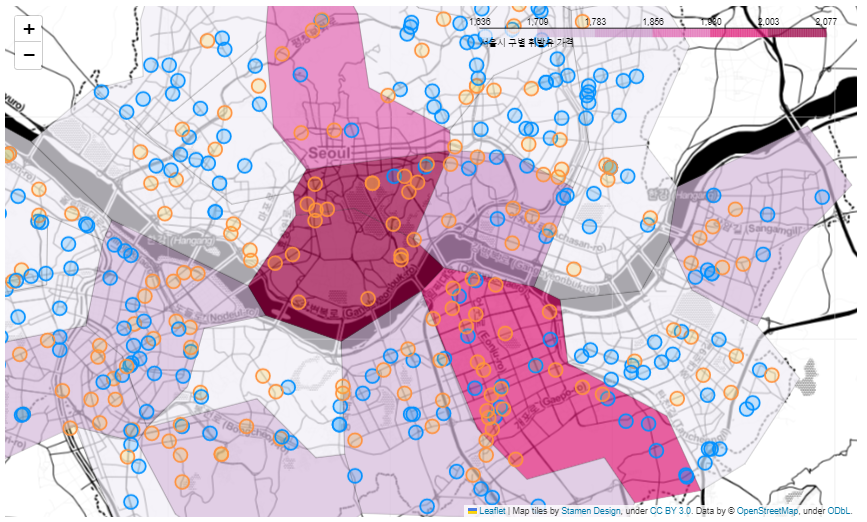
번외
구별 부가정보 유무 시각화
강서구의 주유소는 부가 서비스를 많이 제공한다.
충전소가 있는 주유소는 드물다
# heatmeap

plt.figure(figsize=(10,8))
sns.heatmap(data=service_cnt_norm.iloc[:,:-2],
            annot=True,
            fmt='.2') # annot=True 데이터 값 표시 , fmt = 'd' 정수형 표현
plt.show()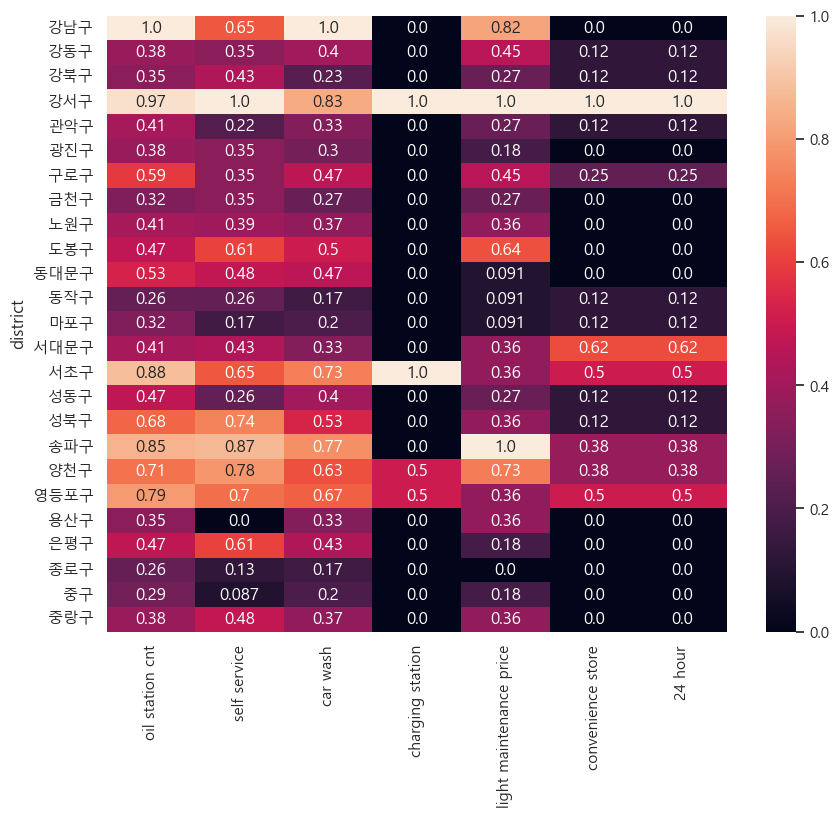
결론
서울시 주유소는 대부분 셀프 주유소의 가격이 더 저렴한 것을 알 수 있다.
데이터 시각화를 통해 서울시 구별로 가격을 비교했을때 셀프 주유소가 없는 지역의 가격이 더 비싼것을 확인할 수 있었다.
서울시 모든 주유소의 셀프 부유소 여부에 따른 경유와 휘발유 평균 가격을 비교 했을때도 셀프 주유소의 가격이 더 저렴했다.
따라서, 서울시 셀프주유소의 경유와 휘발유 가격은 일반 주유소보다 저렴한 것을 확인할 수 있다.

개발하고싶은사람