🔎 인구 소멸 위기 지역 분석
1. 목표
1. 인구 소멸 위기 지역 파악
2. 인구 소멸 위기 지역의 지도 표현
3. 지도 표현에 대한 카르토그램 표현
2. 데이터 읽고 인구 소멸 지역 계산하기
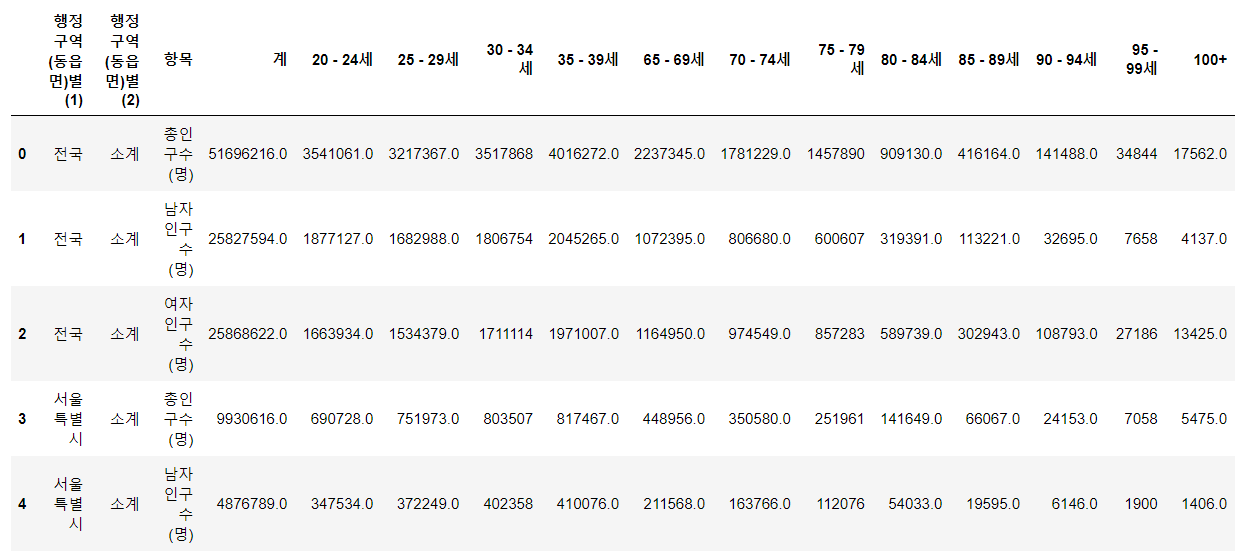
✍️ 인구 데이터 가져오기
population = pd.read_excel('../data/07_population_raw_data.xlsx', header=1)
population.fillna(method="pad", inplace=True)
population
# 컬럼이름 변경
population.rename(
    columns={
        "행정구역(동읍면)별(1)" : "광역시",
        "행정구역(동읍면)별(2)" : "시도",
        "계" : "인구수"
    }, inplace=True)

population.head()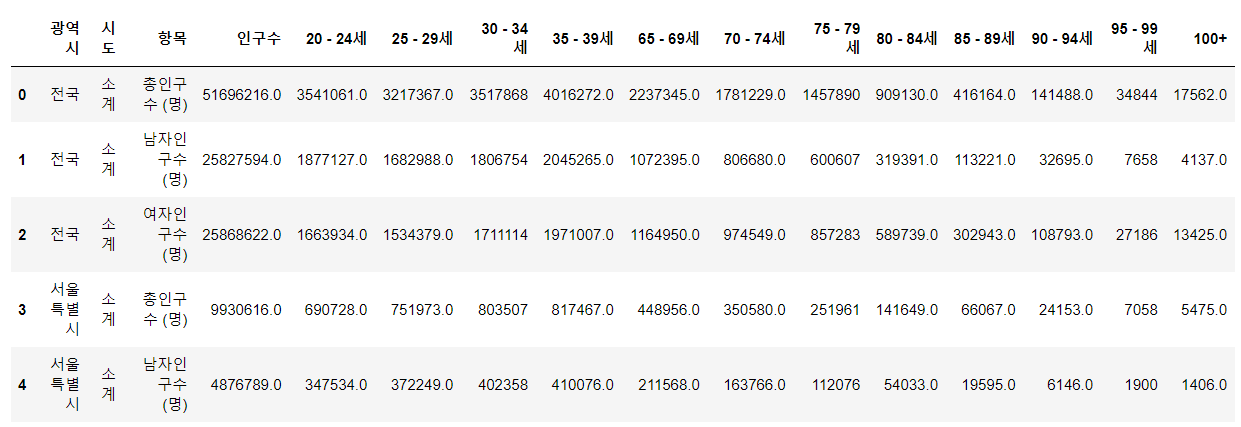
# 소계 제거
population = population[population["시도"]!="소계"]

# 컬럼명 변경
population.is_copy=False #copy warning 방지

population.rename(
    columns={"항목" : "구분"},
    inplace=True
)

# 구분의 value값 변경
population.loc[population["구분"]=="총인구수 (명)","구분"] = "합계"
population.loc[population["구분"]=="남자인구수 (명)","구분"] = "남자"
population.loc[population["구분"]=="여자인구수 (명)","구분"] = "여자"

population.head()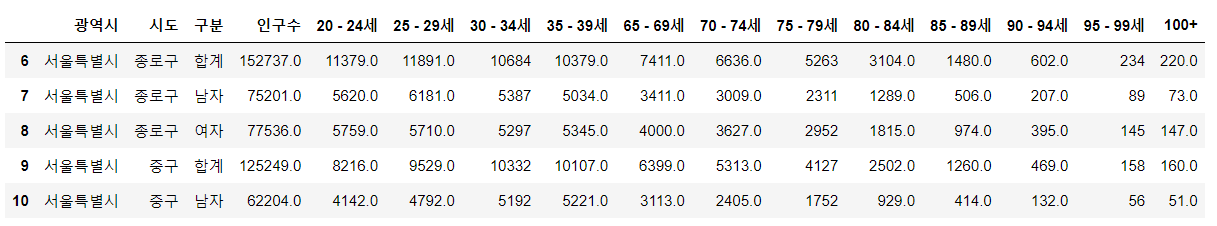
✍️ 소멸 지역을 조사하기 위한 컬럼 추가
# 소멸 지역을 조사하기 위한 데이터
population["20 - 39세"] = (
population["20 - 24세"]+
population["25 - 29세"]+
population["30 - 34세"]+
population["35 - 39세"]
)
population["65세 이상"] = (
population["65 - 69세"]+
population["70 - 74세"]+
population["75 - 79세"]+
population["80 - 84세"]+
population["85 - 89세"]+
population["90 - 94세"]+
population["95 - 99세"]+
population["100+"]
)
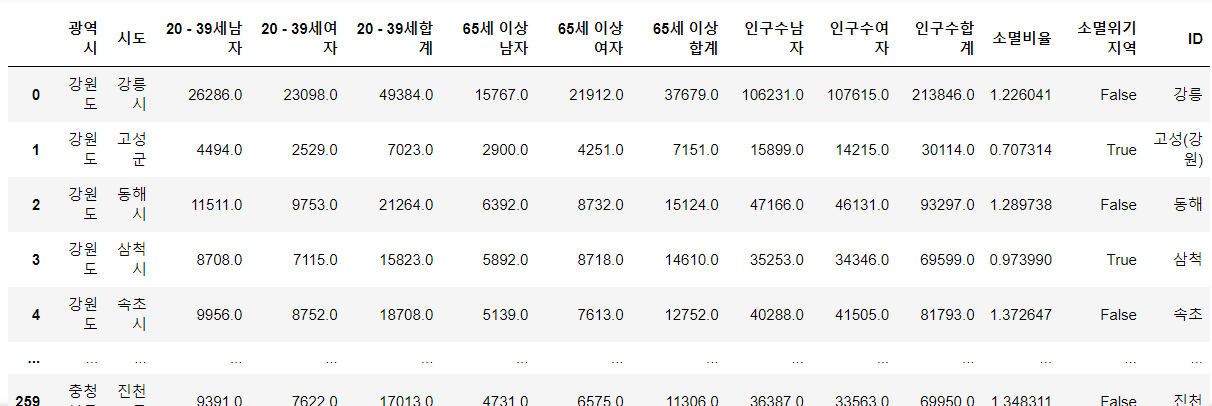
population.head()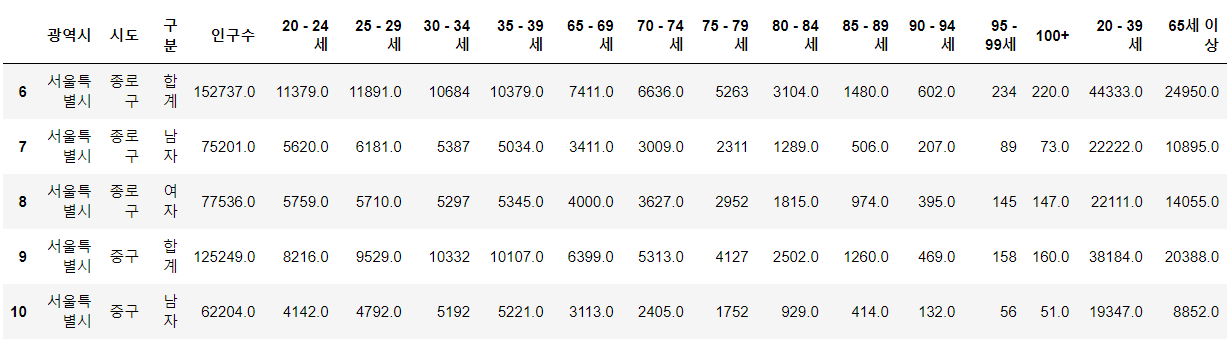
✍️ 피벗테이블
# pivot_table

pop=pd.pivot_table(
    data=population,
    index=["광역시","시도"],
    columns=["구분"],
    values=["인구수","20 - 39세","65세 이상"]
)

pop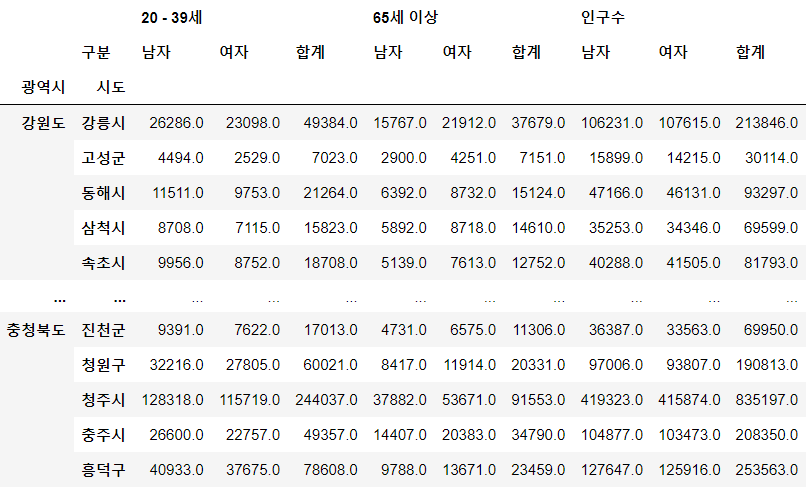
✍️ 소멸위기지역 컬럼 생성
# 소멸 비율 계산
pop["소멸비율"]=pop["20 - 39세","여자"]/(pop["65세 이상", "합계"] / 2)
pop.tail()

# 소멸위기지역 컬럼 생성
pop["소멸위기지역"]=pop["소멸비율"]<1.0

pop.head()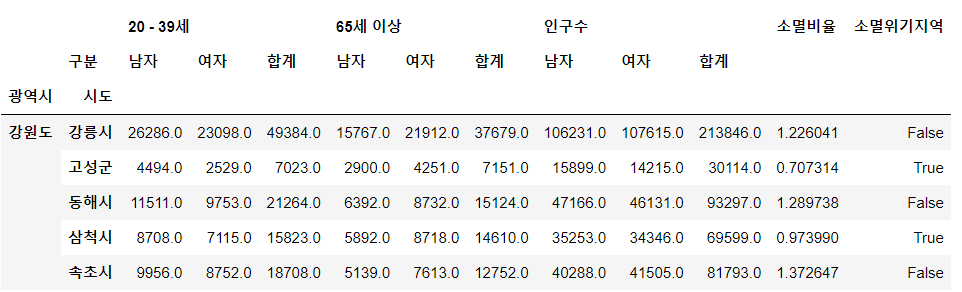
#소멸위기지역 조회
pop[pop["소멸위기지역"]==True].index.get_level_values(1)
Index(['고성군', '삼척시', '양양군', '영월군', '정선군', '평창군', '홍천군', '횡성군', '가평군', '양평군',
       '연천군', '거창군', '고성군', '남해군', '밀양시', '산청군', '의령군', '창녕군', '하동군', '함안군',
       '함양군', '합천군', '고령군', '군위군', '문경시', '봉화군', '상주시', '성주군', '영덕군', '영양군',
       '영주시', '영천시', '예천군', '울릉군', '울진군', '의성군', '청도군', '청송군', '동구', '영도구',
       '강화군', '옹진군', '강진군', '고흥군', '곡성군', '구례군', '담양군', '보성군', '신안군', '영광군',
       '영암군', '완도군', '장성군', '장흥군', '진도군', '함평군', '해남군', '화순군', '고창군', '김제시',
       '남원시', '무주군', '부안군', '순창군', '임실군', '장수군', '정읍시', '진안군', '공주시', '금산군',
       '논산시', '보령시', '부여군', '서천군', '예산군', '청양군', '태안군', '홍성군', '괴산군', '단양군',
       '보은군', '영동군', '옥천군'],
dtype='object', name='시도')pop.reset_index(inplace=True)
pop.head()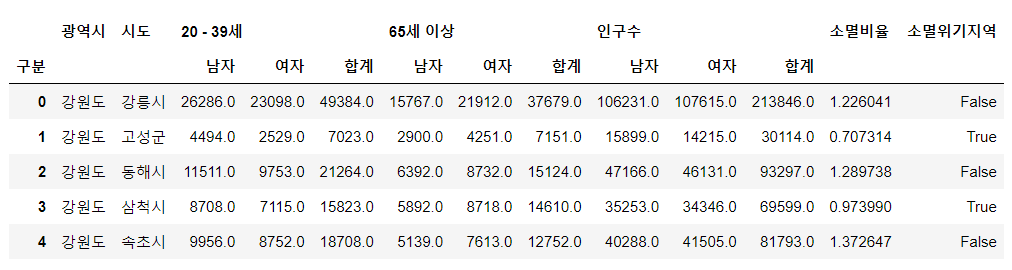
tmp_columns=[
    pop.columns.get_level_values(0)[n]+pop.columns.get_level_values(1)[n]
    for n in range(0,len(pop.columns.get_level_values(0)))
]

tmp_columns
['광역시',
'시도',
'20 - 39세남자',
'20 - 39세여자',
'20 - 39세합계',
'65세 이상남자',
'65세 이상여자',
'65세 이상합계',
'인구수남자',
'인구수여자',
'인구수합계',
'소멸비율',
'소멸위기지역']pop.columns=tmp_columns
pop.head()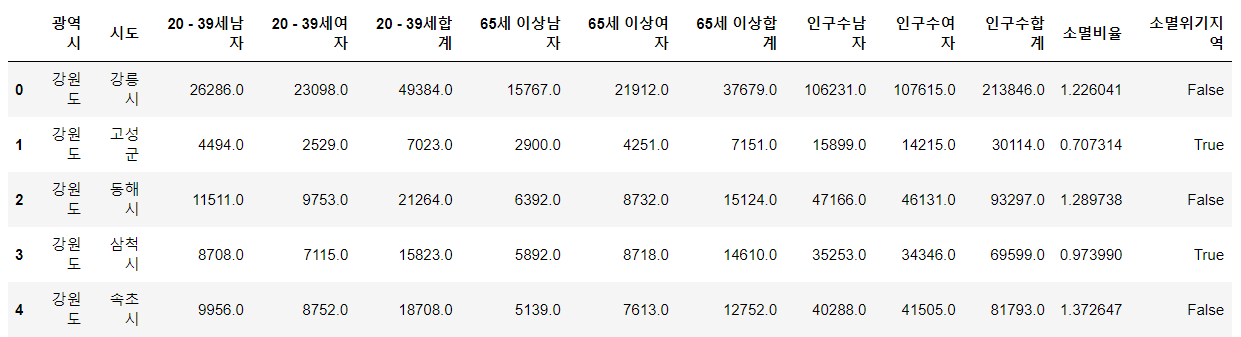
3. 지도 시각화를 위한 지역별 ID 만들기
✍️ 만들고자 하는 ID 형태
서울 중구
서울 서초
통영
남양주
포항 북구
인천 남동
si_name=[None]*len(pop)

tmp_gu_dict={
    "수원":["장안구","권선구","팔달구","영통구"],
    "성남":["수정구","중원구","분당구"],
    "안양":["만안구","동안구"],
    "안산":["상록구","단원구"],
    "고양":["덕양구","일산동구","일산서구"],
    "용인":["처인구","기흥구","수지구"],
    "청주":["상당구","서원구","흥덕구","청원구"],
    "천안":["동남구","서북구"],
    "전주":["완산구","덕진구"],
    "포항":["남구","북구"],
    "창원":["의창구","성산구","진해구","마산합포구","마산회원구"],
    "부천":["오정구","원미구","소사구"]
}
✍️ (1) 일반 시 이름과 세종시, 광역시도 일반 구 정리
for idx, row in pop.iterrows():
    if row["광역시"][-3:] not in ["광역시", "특별시", "자치시"]:
        si_name[idx] = row["시도"][:-1]

    elif row["광역시"] == "세종특별자치시":
        si_name[idx] = "세종"

    else:
        if len(row["시도"]) == 2:
            si_name[idx] = row["광역시"][:2] + " " + row["시도"]
        else:draw_korea_raw_stacked=pd.DataFrame(draw_korea_raw.stack())
            si_name[idx] = row["광역시"][:2] + " " + row["시도"][:-1]

pop["ID"]=si_name
pop
pop.drop(columns=["20 - 39세남자", "65세 이상남자","65세 이상여자"], inplace=True)
pop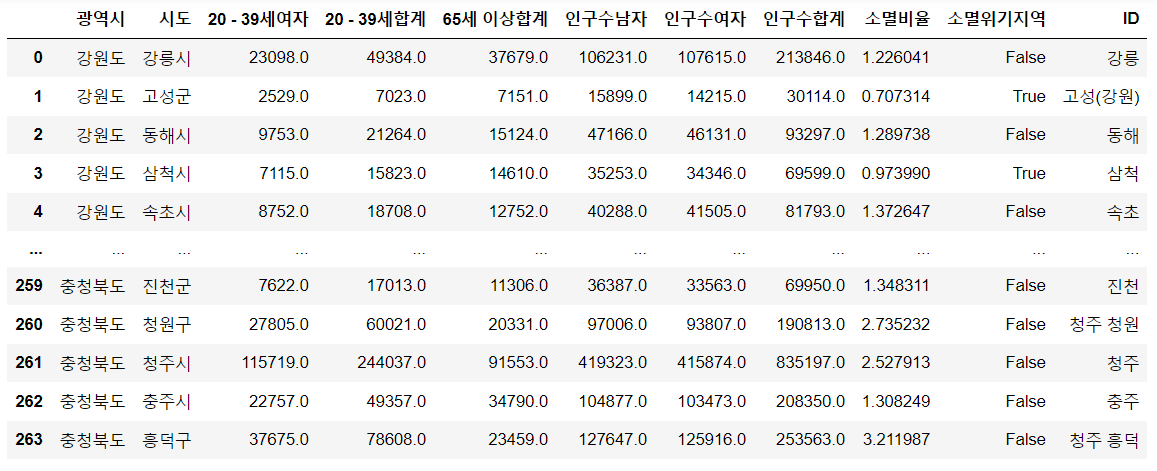
4. 지도그리기 - 카르토그램
✍️ 대한민국 지도를 그리기위한 데이터 가져오기
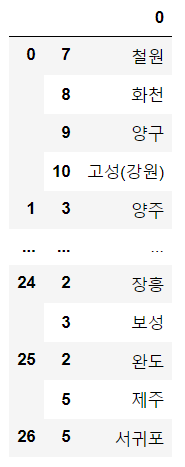
draw_korea_raw=pd.read_excel('../data/07_draw_korea_raw.xlsx')
draw_korea_raw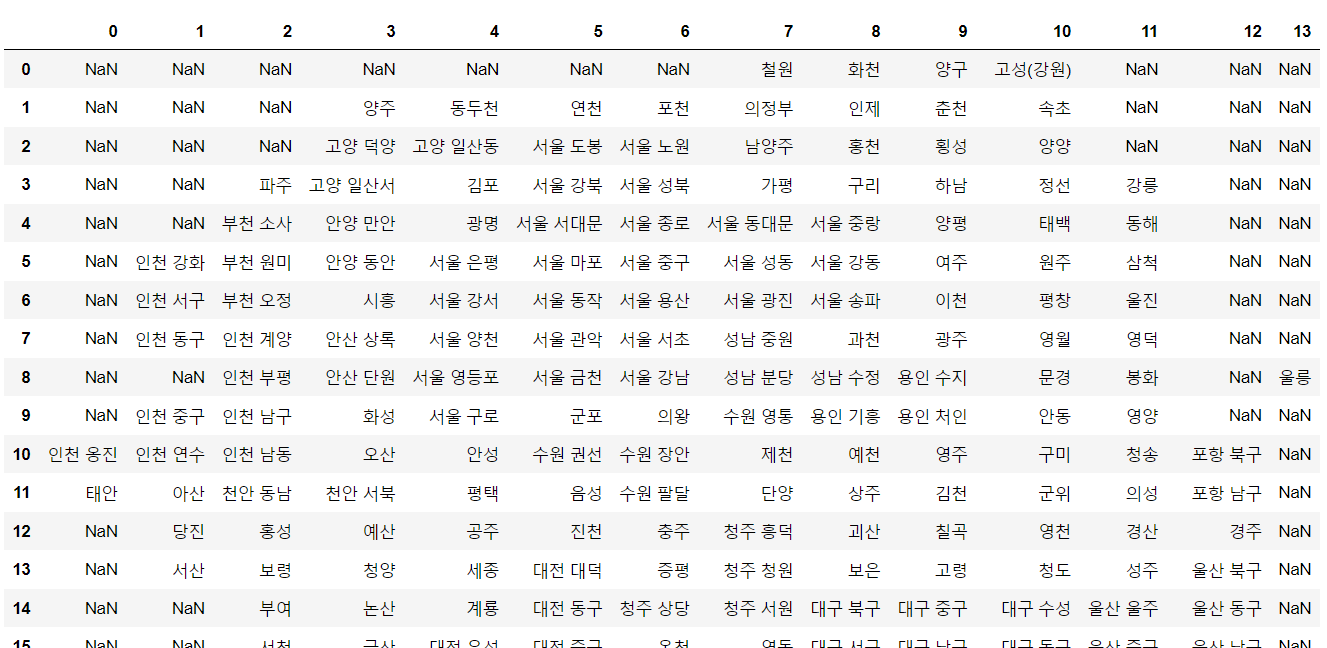
✍️ 엑셀 데이터 원본
✍️ 각 지역 위치를 x,y 좌표로 만들기 위한 작업
draw_korea_raw_stacked=pd.DataFrame(draw_korea_raw.stack())
draw_korea_raw_stacked
draw_korea_raw_stacked.reset_index(inplace=True)
draw_korea_raw_stacked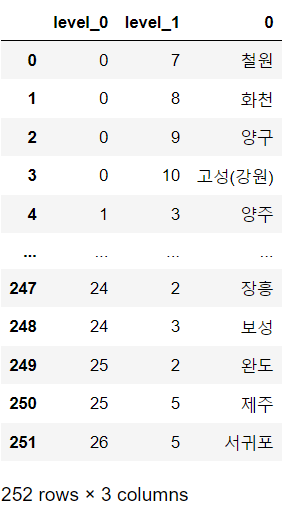
draw_korea=draw_korea_raw_stacked.rename(
    columns={
     "level_0":"y",
    "level_1":"x",
        0:'ID'
    })

draw_korea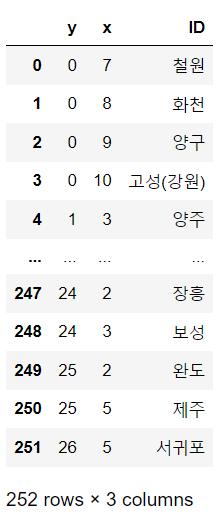
✍️ 각 지역 경계선
BORDER_LINES = [
    [(5, 1), (5, 2), (7, 2), (7, 3), (11, 3), (11, 0)], # 인천
    [(5, 4), (5, 5), (2, 5), (2, 7), (4, 7), (4, 9), (7, 9), (7, 7), (9, 7), (9, 5), (10, 5), (10, 4), (5, 4)], # 서울
    [(1, 7), (1, 8), (3, 8), (3, 10), (10, 10), (10, 7), (12, 7), (12, 6), (11, 6), (11, 5), (12, 5), (12, 4), (11, 4), (11, 3)], # 경기도
    [(8, 10), (8, 11), (6, 11), (6, 12)], # 강원도
    [(12, 5), (13, 5), (13, 4), (14, 4), (14, 5), (15, 5), (15, 4), (16, 4), (16, 2)], # 충청북도
    [(16, 4), (17, 4), (17, 5), (16, 5), (16, 6), (19, 6), (19, 5), (20, 5), (20, 4), (21, 4), (21, 3), (19, 3), (19, 1)], # 전라북도
    [(13, 5), (13, 6), (16, 6)],
    [(13, 5), (14, 5)], # 대전시 # 세종시
    [(21, 2), (21, 3), (22, 3), (22, 4), (24, 4), (24, 2), (21, 2)], # 광주
    [(20, 5), (21, 5), (21, 6), (23, 6)], # 전라남도
    [(10, 8), (12, 8), (12, 9), (14, 9), (14, 8), (16, 8), (16, 6)], # 충청북도
    [(14, 9), (14, 11), (14, 12), (13, 12), (13, 13)], # 경상북도
    [(15, 8), (17, 8), (17, 10), (16, 10), (16, 11), (14, 11)], # 대구
    [(17, 9), (18, 9), (18, 8), (19, 8), (19, 9), (20, 9), (20, 10), (21, 10)], # 부산
    [(16, 11), (16, 13)],
    [(27, 5), (27, 6), (25, 6)]
]
✍️ 데이터 검증
- 공통 ID 값이 아닌건 제외해준다
set(draw_korea['ID'].unique())-set(pop['ID'].unique())
set(pop['ID'].unique())-set(draw_korea["ID"].unique())

tmp_list=list(set(pop['ID'].unique())-set(draw_korea["ID"].unique()))

for tmp in tmp_list:
    pop=pop.drop(pop[pop["ID"]==tmp].index)

set(pop['ID'].unique())-set(draw_korea["ID"].unique())
✍️ 데이터 합치기
pop = pd.merge(pop,draw_korea,how='left', on='ID')
pop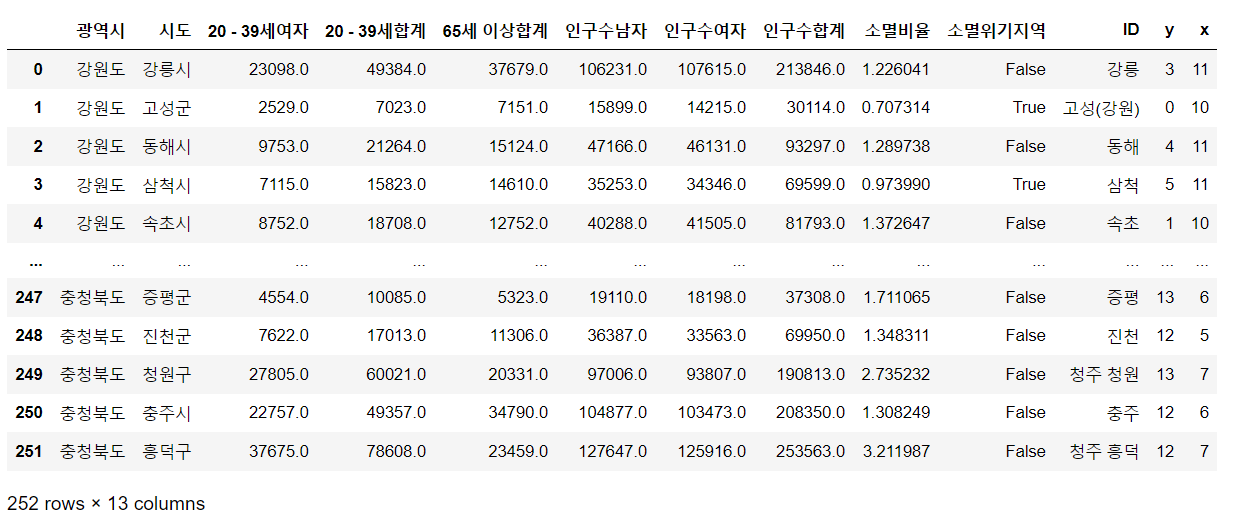
✍️그림을 그리기 위한 데이터를 계산하는 함수
- 색상을 만들 때, 최소값은 흰색
- blockedMap : 인구현황(pop)
- tagetData : 그리고 싶은 컬럼
get_data_info
def get_data_info(targetData, blockedMap):
    whitelabelmin = (
        max(blockedMap[targetData]) - min(blockedMap[targetData])
    ) * 0.25 + min(blockedMap[targetData])
    vmin = min(blockedMap[targetData])
    vmax = max(blockedMap[targetData])

    mapdata = blockedMap.pivot_table(index="y", columns="x", values=targetData)

    return mapdata, vmax, vmin, whitelabelmin
get_data_info_for_zero_center
def get_data_info_for_zero_center(targetData, blockedMap):
    whitelabelmin = 5
    tmp_max = max(
        [np.abs(min(blockedMap[targetData])), np.abs(max(blockedMap[targetData]))]
    )
    vmin, vmax = -tmp_max, tmp_max
    mapdata = blockedMap.pivot_table(index="y", columns="x", values=targetData)

    return mapdata, vmax, vmin, whitelabelmin
plot_text
def plot_text(targetData, blockedMap, whitelabelmin):
    for idx, row in blockedMap.iterrows():
        if len(row["ID"].split()) == 2:
            dispname = "{}\n{}".format(row["ID"].split()[0], row["ID"].split()[1])
        elif row["ID"][:2] == "고성":
            dispname = "고성"
        else:
            dispname = row["ID"]

        if len(dispname.splitlines()[-1]) >= 3:
            fontsize, linespacing = 9.5, 1.5
        else:
            fontsize, linespacing = 11, 1.2


        annocolor = "white" if np.abs(row[targetData]) > whitelabelmin else "black"
        plt.annotate(
            dispname,
            (row["x"] + 0.5, row["y"] + 0.5),
            weight="bold",
            color=annocolor,
            fontsize=fontsize,
            linespacing=linespacing,
            ha="center", # 수평 정렬
            va="center", # 수직 정렬
        )
drawKorea
   def drawKorea(targetData, blockedMap, cmapname, zeroCenter=False):
    if zeroCenter:
        masked_mapdata, vmax, vmin, whitelabelmin = get_data_info_for_zero_center(targetData, blockedMap)

    if not zeroCenter:
        masked_mapdata, vmax, vmin, whitelabelmin = get_data_info(targetData, blockedMap)

    plt.figure(figsize=(8, 11))
    plt.pcolor(masked_mapdata, vmin=vmin, vmax=vmax, cmap=cmapname, edgecolor="#aaaaaa", linewidth=0.5)

    plot_text(targetData, blockedMap, whitelabelmin)

    for path in BORDER_LINES:
        ys, xs = zip(*path)
        plt.plot(xs, ys, c="black", lw=1.5)

    plt.gca().invert_yaxis()
    plt.axis("off")
    plt.tight_layout()
    cb = plt.colorbar(shrink=0.1, aspect=10)
    cb.set_label(targetData)
    plt.show()
drawKorea("인구수합계",pop, 'Blues') 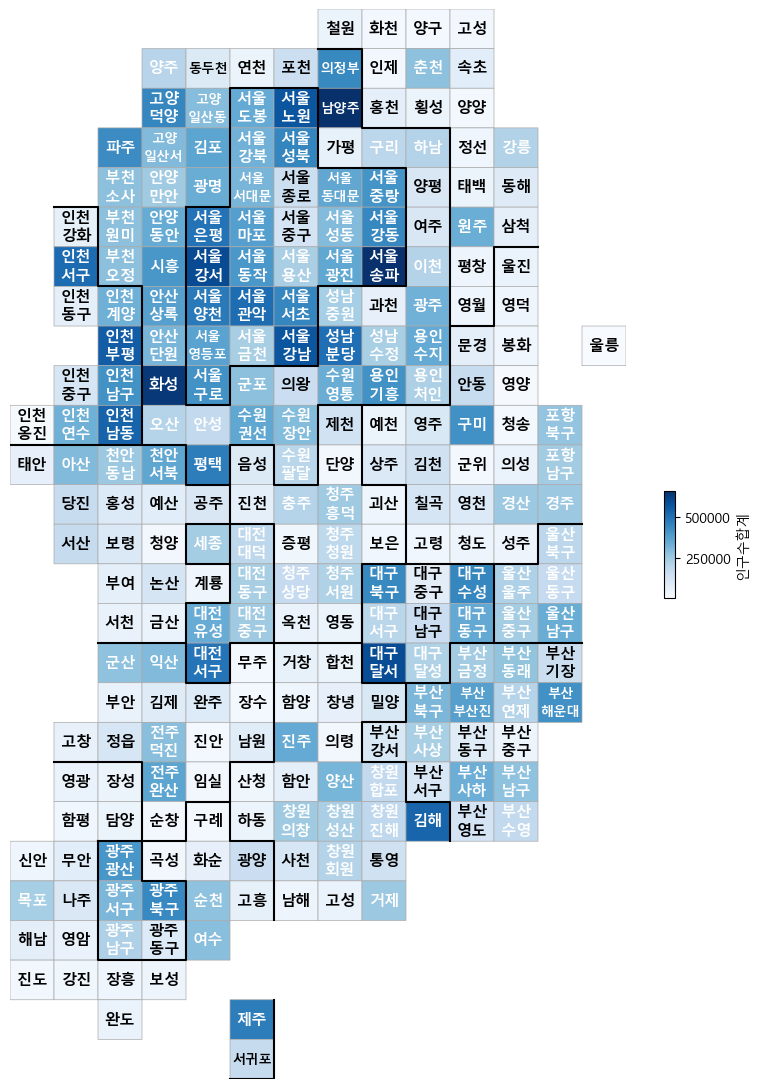
pop['소멸위기지역'] = [1 if con else 0 for con in pop['소멸위기지역']]
drawKorea("소멸위기지역", pop, 'Reds')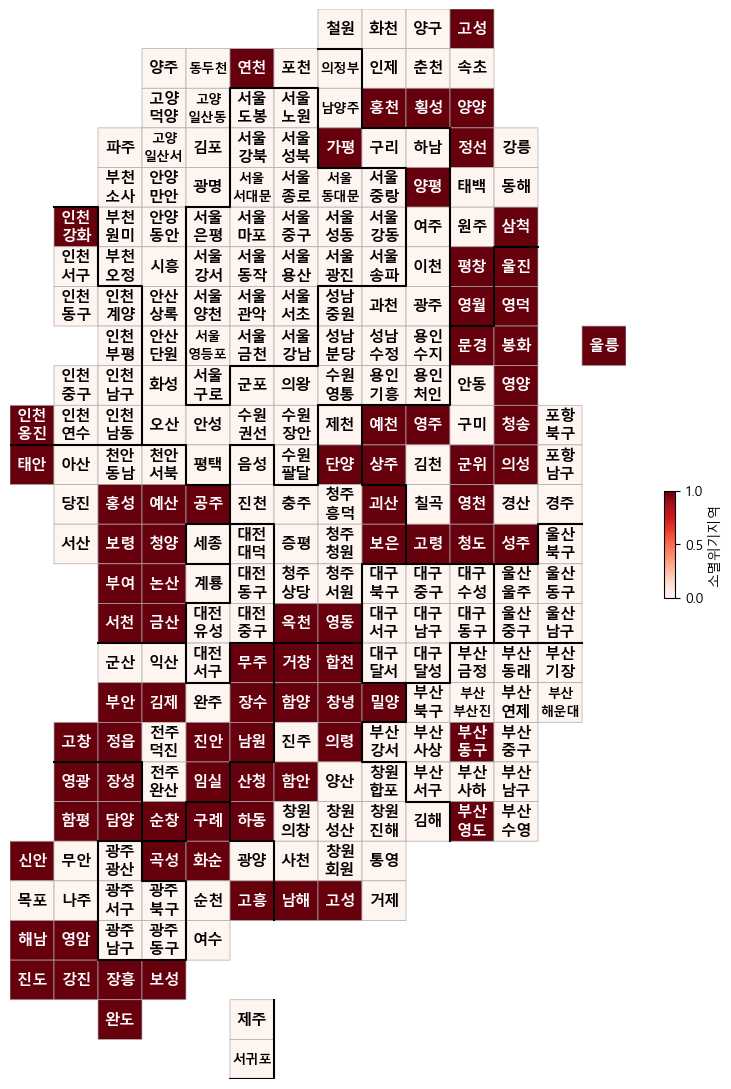
5. Folium.choropleth
import folium
import json
pop_folium=pop.set_index("ID")
pop_folium.head()
geo_path="../data/07_skorea_municipalities_geo_simple.json"
geo_str=json.load(open(geo_path,encoding='utf-8'))
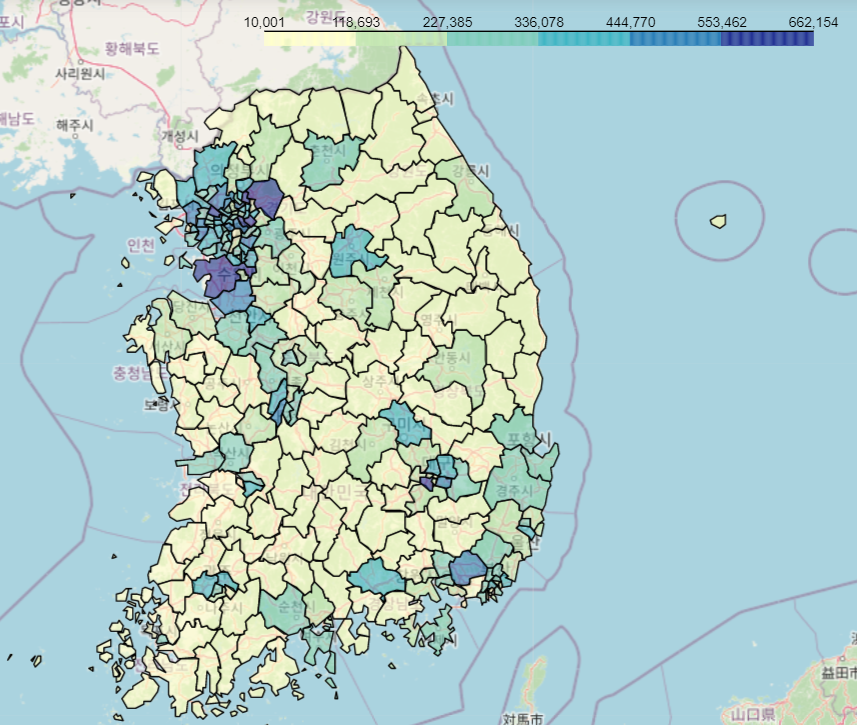
# 인구수합계 시각화
my_map=folium.Map(
location=[36.2002,127.054],
zoom_start=7
)
my_map.choropleth(
geo_data=geo_str,
data=pop_folium['인구수합계'],
key_on='feature.id',
columns=[pop_folium.index, pop_folium['인구수합계']],
fill_color="YlGnBu"
)
my_map
# 소멸위기지역 시각화
my_map=folium.Map(
    location=[36.2002,127.054],
    zoom_start=7
)
my_map.choropleth(
    geo_data=geo_str,
    data=pop_folium['소멸위기지역'],
    key_on='feature.id',
    columns=[pop_folium.index, pop_folium['소멸위기지역']],
    fill_color="PuRd"
)

my_map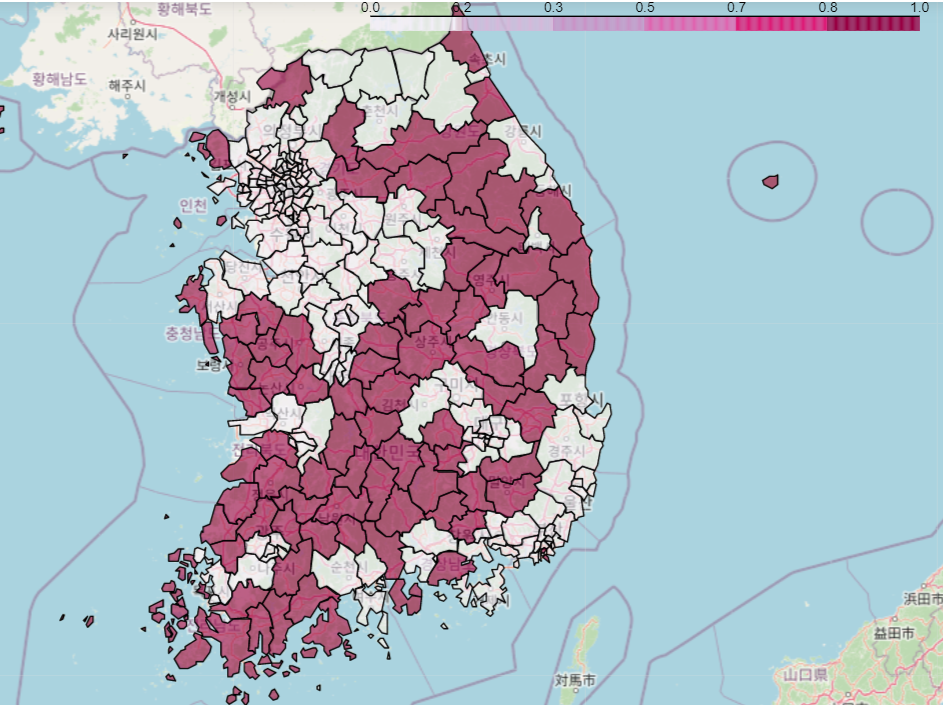
✍️ 데이터 저장
#데이터 저장
draw_korea.to_csv("../data/07_draw_korea.csv")
개발하고싶은사람