Basics terms of Data Analysis
-
Raw Data: Uncleaned version of data collected from different sources
-
Variable: Hold different values
- Categorical variable: Places an individual or an item into are of several groups or categories. (Ordinal variable is when categories have an ordering or ranking)
- Quantitative variable: Takes numerical values for which arithmetic operations such as adding and averaging make sense. (measurement variable)
ex)
- Age: numerical
- Typical classroom seat location(front/middle/back): categorical
- Number of songs on an ipad: numerical
- time spent studying(in hours): numerical
Summerizing Data
-
mean: Average value
-
median: Middle value of the data is arranged from the smallest to the largest
-
Range: Measures the spread over 100% of data. (Range = High value - low value = Max - min)
-
Persentiles: The Pth percentile is the value that P% of observations fall at or below that value
Q1: 25th percentile(first quartie)
Q2: 50th percentile(median)
Q3: 75th percentile(third quartie)
Interquatie range: P3-Q1ex)
ordered: 63, 65, 67, 69, 69, 71, 71, 72, 74, 75, 78, 79, 80, 81, 83mean: 73.13 (1097/15)
median: 72
Q1: 69
Q3: 79
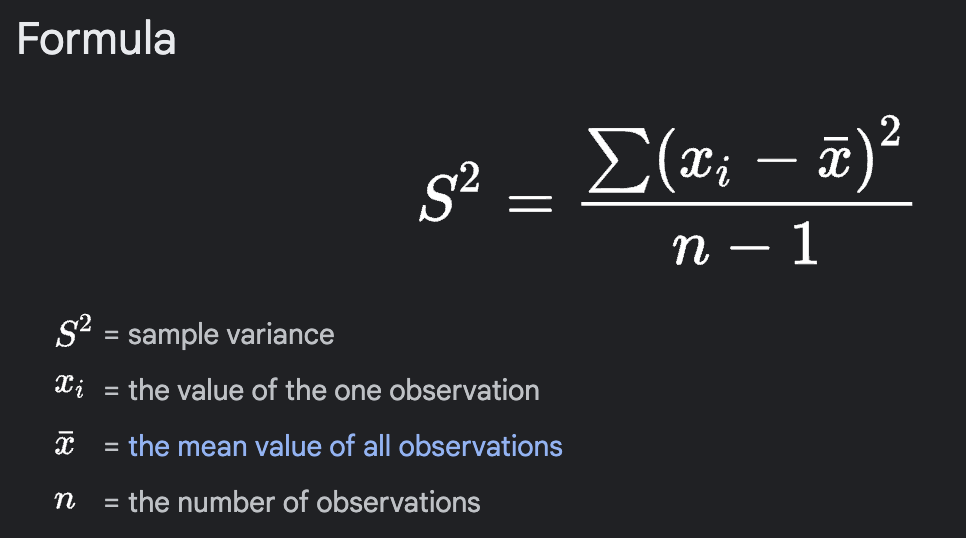
Variance: 37.12
STD: 5.89 -
std-deviation:
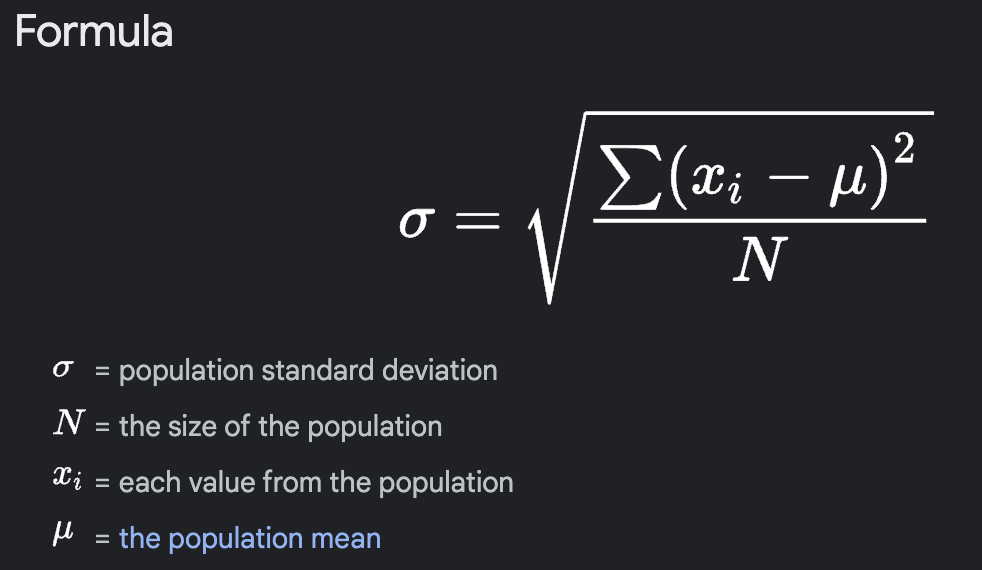
- variance

Studying for Data Analysis, Data Engineering & Data Science