가장 주요한 기법
AARRR
Funnel 분석
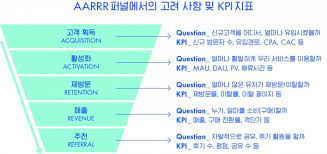
acquisition (사용자 획득) : 사용자가 어떻게 서비스를 접하는가?
activation (사용자 활설화) : 사용자가 처음 서비스를 이용했을 때 경험이 좋았는가?
retention (사용자 유지) : 사용자가 우리 서비스를 계속 이용하는가?
referral (추천) : 어떻게 돈을 버는가?
revenue (매출) : 사용자가 다른 사람들에게 제품을 소개하는가?
acquisition : 미디어 별 데이터로 효율적인 마케팅 믹스 도출
activation : 활성 사용자의 고객 획득 비용 계산(CAC)
retention : AB 테스트 결과 분석으로 고객유지율 높이기(Statistical verfification)
referral : 적당한 것이 없어, 고객 구매 후기 분석으로 소비자 인식 조사(Text Mining)
revenue : 고객 세그먼트 도출과 각 고객군별 전략 수립(Clustering)
Acquisition
데이터 셋 설명
TV - TV 매체비 입니다.
radio - 라디오 매체비 입니다.
newspaper - 신문 매체비 입니다.
sales - 매출액 입니다.
문제 정의
전제
- 실제로는 광고 매체비 이와의 많은 요인이 매출에 영향을 미칩니다. (e.g. 영업인력 수, 입소문, 경기, 유행 등)
- 본 분석에서는 다른 요인이 모두 동일한 상황에서 매체비만 변경했을 때 매출액의 변화가 발생한 것이라고 간주해봅니다.
- 실제로 Acquisition 단계에서는 종속변수가 매출액보다는 방문자수, 가입자수, DAU, MAU 등의 지표가 될 것입니다.
- 여러분은 지금 2011년에 있다고 상상합니다.
분석의 목적
- 각 미디어별로 매체비를 어떻게 쓰느냐에 따라서 매출액이 어떻게 달라질지 예측합니다.
- 궁극적으로는 매출액을 최대화할 수 있는 미디어 믹스의 구성을 도출합니다.
이 미디어믹스는 향후 미디어 플랜을 수립할 때 사용될 수 있습니다.
데이터 불러오기 및 확인
import pandas as pd
import numpy as np
import matplotlib.pyplot as plt
import seaborn as sns

# 데이터를 불러옵니다.
from google.colab import files
uploaded = files.upload()
 # 데이터를 확인 합니다.
df = pd.read_csv('Advertising.csv')
print(df.shape)
df.tail()
df.info()
df.describe()
(200, 5)
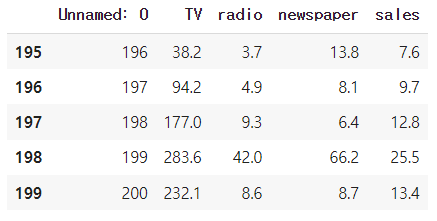
첫번쨰 column은 index인것으로 추정하고 단위가 명확하지는 않음
DF 가공
#0번 column 제거
df = df[['TV', 'radio', 'newspaper', 'sales']]
df.tail()
EDA-heatmap
df.describe()
# 변수간의 correlation을 확인합니다.
df.corr()
corr = df.corr()
sns.heatmap(corr, annot=True)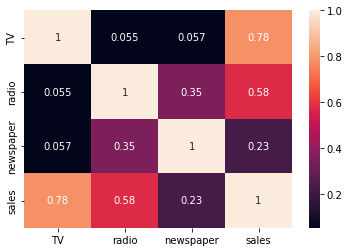
sales와 높은 상관관계를 가지는 것은 TV, radio 인것을 알 수 있음
EDA-pairplot
sns.pairplot(df)
plt.show() 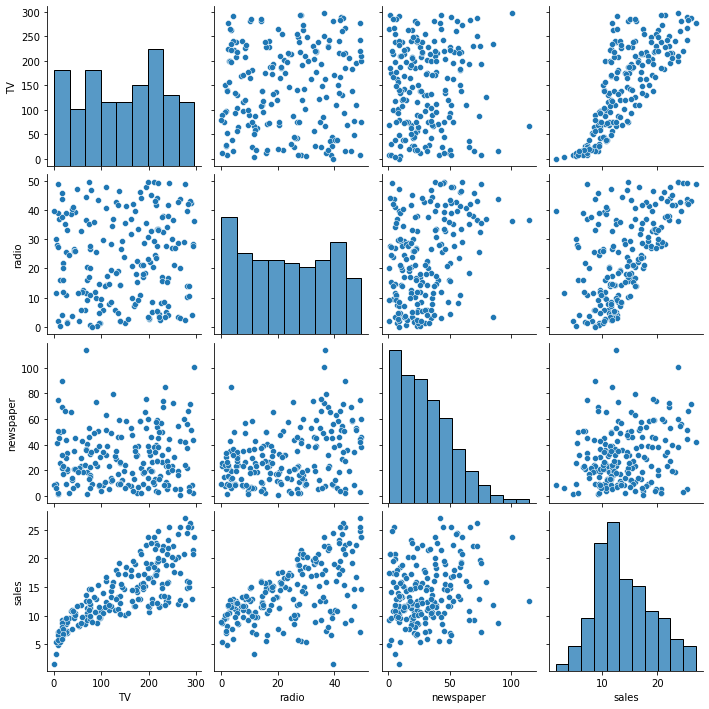
TV와 radio는 거의 선형 그래프를 나타냄
target과 feature 분리
# Labels와 features를 지정해줍니다.
Labels =df['sales']
features = df[['TV' ,'radio', 'newspaper']]
EDA
# 3개의 시각화를 한 화면에 배치합니다.
figure, ((ax1, ax2, ax3)) = plt.subplots( 1,3)

# 시각화의 사이즈를 설정해줍니다.
figure.set_size_inches(20, 6)

# 미디어별 매체비 분포를 scatterplot으로 시각화해봅니다.
sns.scatterplot(data =df, x='TV', y='sales', ax=ax1)
sns.scatterplot(data =df, x='radio', y='sales', ax=ax2)
sns.scatterplot(data =df, x='newspaper', y='sales', ax=ax3)
선형회귀 분석
import statsmodels.formula.api as sm
model1 = sm.ols(formula = 'sales ~ TV + radio + newspaper', data =df).fit()
print(model1.summary())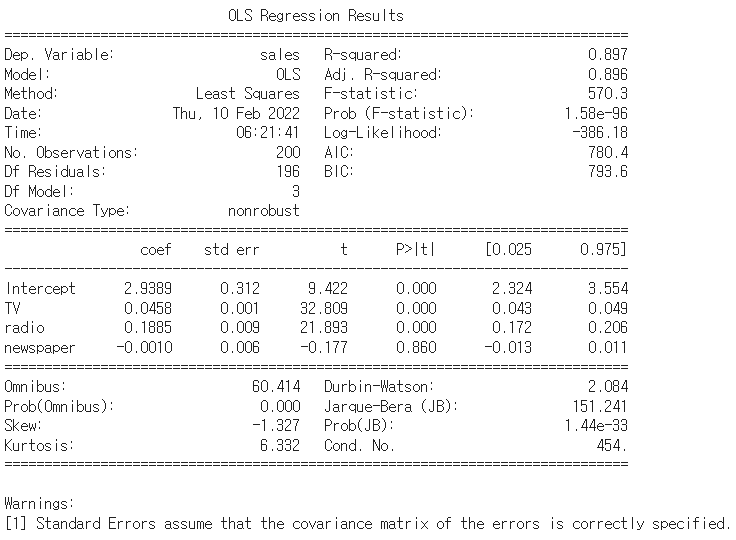
OLS분석
- r_square : 0.897로 매우 높다, 현실적으로 너무 높아도 문제 주로 데이터의 질에 따라 많이 바뀜
- p-value : 0.05 수준에서 유의미 낮을 수록 유의미, newspaper는 해석하기 어렵다는 것
- coef : sales에 영향을 미치는 정도, TV가 매출에 큰 영향을 준다는 것을 알 수 있음
선형회귀분석 in scikitlearn
# sklearn의 선형회귀분석 결과와도 같습니다.
from sklearn.datasets import make_regression
from sklearn.linear_model import LinearRegression

model = LinearRegression().fit(features, Labels)
print(model.intercept_, model.coef_)
2.938889369459412 [ 0.04576465 0.18853002 -0.00103749]
계수가 똑같다
# 변수의 포함여부에 따른 ols 결과를 봅니다.
model1 = sm.ols(formula = 'sales ~ TV + radio + newspaper', data =df).fit()
model2 = sm.ols(formula = 'sales ~ TV + radio ', data =df).fit()
model3 = sm.ols(formula = 'sales ~ TV', data =df).fit()

print(model1.summary())
print(model2.summary())
print(model3.summary())
결과 해석
- 유의하지 않은 변수 newspaper를 제거한 model2의 AIC, BIC가 가장 낮습니다.
- 여러개의 모델 중 선택을 할 때 AIC, BIC가 가장 낮은지 여부로 정하기도 합니다.
- 물론 AIC, BIC가 유일한 판단기준은 아니고 RMSE, CFI 등 다른 기준들과 함께 고려되어야 합니다.
- 결과에 따르면 p-vlaue가 0.05 이상으로, 신문광고는 매출액 예측에 있어서 변수의 유무가 통계적으로 유의한 차이를 보이지 않습니다.
- 즉, 신문광고 마케팅과 매출액은 관련이 없다고 할 수 있습니다.
이를 바탕으로 sales 예측
# 각 미디어별 매체비에 따른 sales를 예측해봅니다.
model1.predict({"TV":300, "radio":10, "newspaper":4})
0 18.549433
dtype: float64
학습된 모델에 원하는 값을 dic 형태로 넣어 예측값을 확인 할 수 있다.
데이터 변환 후 재분석
- 신문광고가 유의미하지 않다고 나왔지만 데이터의 문제일 수도 있다는 생각이 들었습니다.
- 여러분이 2011년에 살고 있다고 가정하고, 여러분의 상사는 여전히 신문광고가 유의미하다고 생각하고 있습니다.
- 분석결과에 대해 상사로부터 데이터 샘플수가 적거나 데이터 처리가 잘못되어서 이런 결과가 나온 것이 아니냐는 지적을 받았습니다.
# 데이터의 분포를 다시 시각화 해봅니다.
# 3개의 시각화를 한 화면에 배치합니다.
figure, ((ax1, ax2, ax3)) = plt.subplots(1, 3)

# 시각화의 사이즈를 설정해줍니다.
figure.set_size_inches(20, 6)

# 미디어별 매체비 분포를 seaborn의 distplot으로 시각화해봅니다.
sns.distplot(df['TV'], ax=ax1)
sns.distplot(df['radio'], ax=ax2)
sns.distplot(df['newspaper'], ax=ax3)
다른 매체에 비해 newspaper는 소액광고가 많은 것을 알 수 있음
newspaper의 경우에는 '왜도'가 심해 정확한 분석을 하기 어려울 수 있다. 그렇기 떄문에 정규화가 필요한데 이럴 떄 사용하는 정규화는 log정규화
# 데이터의 분포를 다시 시각화 해봅니다.
# 3개의 시각화를 한 화면에 배치합니다.
figure, ((ax1, ax2, ax3, ax4)) = plt.subplots(1, 4)

# 시각화의 사이즈를 설정해줍니다.
figure.set_size_inches(20, 6)

# 미디어별 매체비 분포를 seaborn의 distplot으로 시각화해봅니다.
sns.distplot(df['TV'], ax=ax1)
sns.distplot(df['radio'], ax=ax2)
sns.distplot(df['newspaper'], ax=ax3)
sns.distplot(df['log_newspaper'], ax=ax4)
어느정도 정규화가 되었음을 알 수 있다.
이를 바탕으로 새로운 OLS model 생성
model4=sm.ols(formula='sales ~ TV + radio + log_newspaper', data=df).fit()
print(model4.summary())
model1과 비교하였을 떄 newspaper의 coef값이 소폭 증가하였고 p-value도 소폭 감소하였지만 여전히 0.05구간 에서 유의하지 않았다. 결국 신문광고가 매출액에 큰 영향을 미치지 않는다는 것을 알 수 있다.
여기서 시사점은 라디오의 coef가 가장 큰것을 알 수 있다. 비용대비 효율은 라디오가 가장 좋다는 것을 알 수 있다.
적용 방안
- 지금은 2011년이고 여러분의 상사는 여전히 신문광고가 유효하다고 생각하지만 데이터 분석결과는 그렇지 않습니다.
- 신문광고를 중단하고 TV, 라디오 광고 위주로 집행해야 합니다 .
- 그런데 TV광고는 비용대비 효율은 조금 떨어지는 것 같습니다.
- 라디오 광고의 상관계수가 더 큽니다. 우리 제품은 라디오 광고를 할 수록 잘 팔리는 제품입니다.
Activation
허상적 지표와 행동적 지표
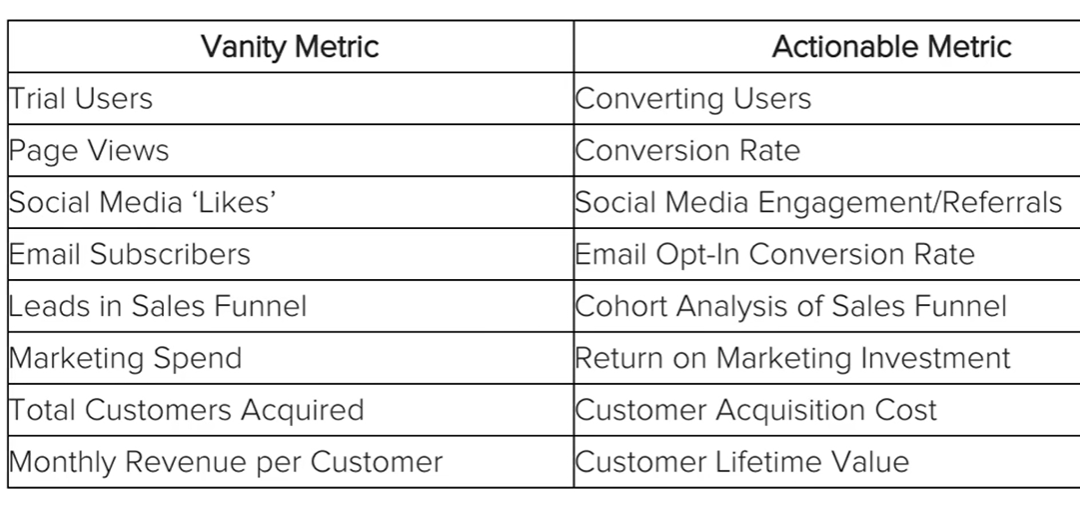
OMTM : 친구추천 기능
Retention
A/B Test로 고객 retention을 높이자
모바일 게임의 고객 로그 데이터를 분석해서 고객 유지율을 높여봅니다.
A/B Test는 각 버전을 나누어 어느것이 전략적으로 뛰어난지를 판별하는 테스트. 재구매율 및 구매 전환률등 컨샙에 따라 다양한 지표가 기준이 될 수 있음
데이터 설명
데이터는 다음의 링크에서 다운받을 수 있습니다. (https://www.kaggle.com/yufengsui/mobile-games-ab-testing)
- userid - 개별 유저들을 구분하는 식별 번호입니다.
- version - 유저들이 실험군 대조군 중 어디에 속했는지 알 수 있습니다. (gate_30, gate_40)
- sum_gamerounds - 첫 설치 후 14일 간 유저가 플레이한 라운드의 수입니다.
- retention_1 - 유저가 설치 후 1일 이내에 다시 돌아왔는지 여부입니다.
- retention_7 - 유저가 설치 후 7일 이내에 다시 돌아왔는지 여부입니다.
문제 정의
- Cookie Cats 게임에서는 특정 스테이지가 되면 스테이지가 Lock되게 합니다.
- Area Locked일 경우 Keys를 구하기 위한 특별판 게임을 해서 키 3개를 구하거나, 페이스북 친구에게 요청하거나, 유료아이템을 구매하여 바로 열 수 있습니다. Area Locked
- Lock을 몇 번째 스테이지에서 할 때 이용자 retention에 가장 좋을지 의사결정을 해야합니다.
EDA
from google.colab import files
uploaded = files.upload()

import pandas as pd
import numpy as np
import matplotlib.pyplot as plt
import seaborn as sns
데이터 기본 정보
df = pd.read_csv('cookie_cats.csv')
df.info()
df.shape
결측치는 없는 것으로 확인 shape을 통해 user 수가 9만인 것을 확인
버전별로 어떤 차이가 있는지 분석
# AB 테스트로 사용된 버전별로 유저들은 몇 명씩 있을까요?
df.groupby('version').count()
게임의 버전은 gage_30과 gate_40으로 구분되어 있고 유저 유입률은 두 버전 다 4만 정도로 비슷한것을 알 수 있다.
게임플레이 횟수 확인
# box plot을 그려봅니다.
sns.boxenplot(data = df, y='sum_gamerounds')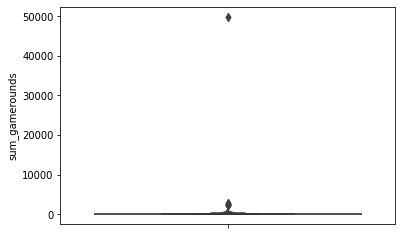
확실히 아웃라이어가 있는 것으로 보입니다.
첫 14일 동안 50,000회 가까이 게임을 한 사람들이 분명히 있지만 일반적인 사용행태라고 하기는 어렵습니다.
엄청나게 skewed한 데이터 분포입니다.
고로 데이터 4만회 이상 플레이한 플레이어는 제거하는 것이 분석에 용이할것
df = df[df['sum_gamerounds']< 40000]
df.shape
sns.boxenplot(data = df, y='sum_gamerounds')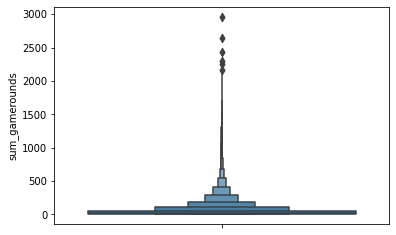
어느 정도 분석에 용이한 그래프가 나옴
sum_gamerounds에 대한 분석
df[sum_gamerounds].describe()count 90188.000000
mean 51.320253
std 102.682719
min 0.000000
25% 5.000000
50% 16.000000
75% 51.000000
max 2961.000000
Name: sum_gamerounds, dtype: float64
전반적으로 51회 게임을 진행을 했고
중앙값은 16회 인것으로 보아 빠진 사람은 푹빠지는 느낌
각 게임실행횟수 별 유저의 수를 카운트 해봅니다.
plot_df = df.groupby('sum_gamerounds')['userid'].count()
%matplotlib inline

ax = plot_df[:100].plot(figsize=(10,6))
ax.set_title("The number of players that played 0-100 game rounds during the first week")
ax.set_ylabel("Number of Players")
ax.set_xlabel('# Game rounds')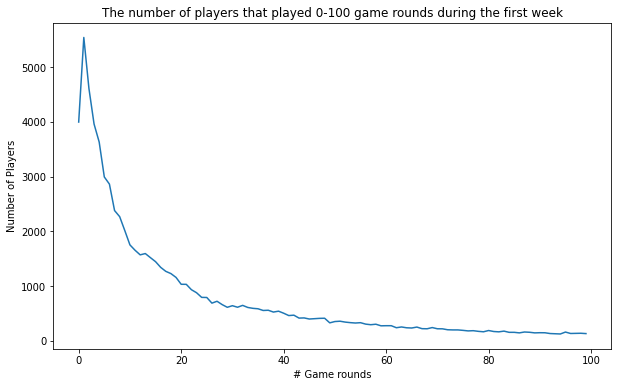
그래프를 분석해 보면 다운로드만 하는 플레이어 수도 무척 많다는 것을 알 수 있음 라운드가 진행되면 진행될 수록 유저수는 지속적으로 감소
- 게임을 설치하고 한 번도 실행하지 않은 유저들의 수가 상당하다는 것을 알 수 있습니다.
- 몇몇 유저들은 설치 첫주에 충분히 실행을 해보고 게임에 어느정도 중독(?) 되었다는 것을 알 수 있습니다.
- 비디오 게임산업에서 1-day retention은 게임이 얼마나 재미있고 중독적인지 평가하는 주요 메트릭입니다.
- 1-day retention이 높을 경우 손쉽게 가입자 기반을 늘려갈 수 있습니다.
1-day retention의 평균을 살펴봅니다.
df['retention_1'].mean()0.4452144409455803
절반 미만이 이 게임을 다음날 실행함
version별 1-day retention의 평균을 살펴봅니다.
df.groupby('version')['retention_1'].mean()version
gate_30 0.448198
gate_40 0.442283
Name: retention_1, dtype: float64
- 단순히 그룹간 평균을 비교해봐서는 게이트가 40(44.2%)인 것보다 30(44.8%)인 경우에 플레이 횟수가 더 많습니다.
- 작은 차이이지만 이 작은 차이가 retention, 더 나아가 장기적 수익에도 영향을 미치게 될 것입니다.
- 그런데 이것만으로 게이트를 30에 두는 것이 40에 두는 것보다 나은 방법이라고 확신할 수 있을까요 ?
7-day retention의 평균을 살펴봅니다.
df['retention_7'].mean()
df.groupby('version')['retention_7'].mean()# 그룹별 7-day retention의 평균을 살펴봅니다.
0.1860557945624695
version
gate_30 0.190183
gate_40 0.182000
Name: retention_7, dtype: float64
- 단순히 그룹간 평균을 비교해봐서는 게이트가 40(18.2%)인 것보다 30(19.0%)인 경우에 생존률이 더 높습니다.
- 작은 차이이지만 이 작은 차이가 retention, 더 나아가 장기적 수익에도 영향을 미치게 될 것입니다.
- 1일보다 7일일때 차이가 더 큽니다. 그런데 이것만으로 게이트를 30에 두는 것이 40에 두는 것보다 나은 방법이라고 확신할 수 있을까요 ?
Bootstrap
T-Square
K-Square
Bootstrapping
두 그룹간의 차이가 유의미한지 알아보는 다른 방법을 사용해보겠습니다.
# 각각의 AB그룹에 대해 bootstrapp된 means 값의 리스트를 만듭니다.

boot_1d = []
for i in range(1000):
    boot_mean = df.sample(frac = 1,replace = True).groupby('version')['retention_1'].mean()
    boot_1d.append(boot_mean)

# list를 DataFrame으로 변환합니다.
boot_1d = pd.DataFrame(boot_1d)

# A Kernel Density Estimate plot of the bootstrap distributions
boot_1d.plot(kind='density')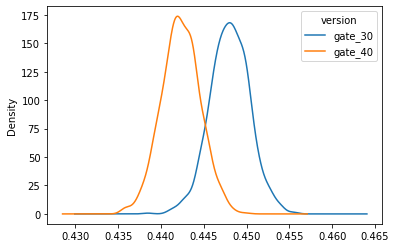
위의 두 분포는 AB 두 그룹에 대해 1 day retention이 가질 수 있는 부트 스트랩 불확실성을 표현합니다.
비록 작지만 차이의 증거가있는 것 같아 보입니다.
자세히 살펴보기 위해 % 차이를 그려 봅시다.
# 두 AB 그룹간의 % 차이 평균 컬럼을 추가합니다.
boot_1d['diff'] = (boot_1d.gate_30 - boot_1d.gate_40)/boot_1d.gate_40*100

# bootstrap % 차이를 시각화 합니다.
ax = boot_1d['diff'].plot(kind='density')
ax.set_title('% difference in 1-day retention between the two AB-groups')

# 게이트가 레벨30에 있을 때 1-day retention이 클 확률을 계산합니다.
print('게이트가 레벨30에 있을 때 1-day retention이 클 확률:',(boot_1d['diff'] > 0).mean())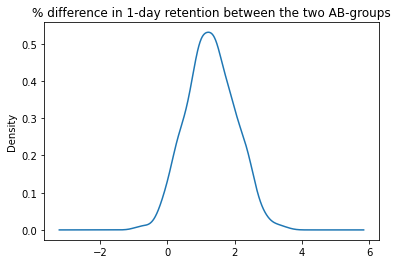
- 위 도표에서 가장 가능성이 높은 % 차이는 약 1%-2%이며 분포의 95%는 0% 이상이며 레벨 30의 게이트를 선호합니다.
- 부트 스트랩 분석에 따르면 게이트가 레벨 30에있을 때 1일 유지율이 더 높을 가능성이 높습니다.
- 그러나 플레이어는 하루 동안 만 게임을했기 때문에 대부분의 플레이어가 아직 레벨 30에 다다르지 않았을 가능성이 큽니다.
- 즉, 대부분의 유저들은 게이트가 30에 있는지 여부에 따라 retention이 영향받지 않았을 것입니다.
- 일주일 동안 플레이 한 후에는 더 많은 플레이어가 레벨 30과 40에 도달하기 때문에 7 일 retention도 확인해야합니다.
T-test
통계적인 기준으로 판단하는 방법을 알아봅니다.
df_30 =df[df['version'] == 'gate_30']
df_40 =df[df['version'] == 'gate_40']


from scipy import stats
#독립표본 T-검정 (2 Sample T-Test)

tTestResult = stats.ttest_ind(df_30['retention_1'], df_40['retention_1'])

tTestResultDiffVar = stats.ttest_ind(df_30['retention_1'], df_40['retention_1'], equal_var=False)

tTestResult
Ttest_indResult(statistic=1.7871153372992439, pvalue=0.07392220630182521)
값이 애매하다
tTestResult = stats.ttest_ind(df_30['retention_7'], df_40['retention_7'])
tTestResultDiffVar = stats.ttest_ind(df_30['retention_7'], df_40['retention_7'], equal_var=False)

tTestResult
0초
tTestResult = stats.ttest_ind(df_30['retention_7'], df_40['retention_7'])
tTestResultDiffVar = stats.ttest_ind(df_30['retention_7'], df_40['retention_7'], equal_var=False)
tTestResult
Ttest_indResult(statistic=3.1575495965685936, pvalue=0.0015915357297854773)
T Score
- t-score가 크면 두 그룹이 다르다는 것을 의미합니다.
- t-score가 작으면 두 그룹이 비슷하다는 것을 의미합니다.
P-values
- p-value는 5%수준에서 0.05입니다.
- p-values는 작은 것이 좋습니다. 이것은 데이터가 우연히 발생한 것이 아니라는 것을 의미합니다.
- 예를 들어 p-value가 0.01 이라는 것은 결과가 우연히 나올 확률이 1%에 불과하다는 것을 의미합니다.
- 대부분의 경우 0.05 (5%) 수준의 p-value를 기준으로 삼습니다. 이 경우 통계적으로 유의하다고 합니다.
t-test
https://www.statisticshowto.datasciencecentral.com/probability-and-statistics/t-test/
- 위 분석결과를 보면, 두 그룹에서 retention_1에 있어서는 유의하지 않고, retention_7에서는 유의미한 차이가 있다는 것을 알 수 있습니다.
- 다시말해, retention_7이 gate30이 gate40 보다 높은 것은 우연히 발생한 일이 아닙니다.
- 즉, gate는 30에 있는 것이 40에 있는 것보다 retention 7 차원에서 더 좋은 선택지 입니다.
사실은 t-test 수치형 데이터에 사용하는 것이고
범주형 데이터는 k-square을 사용
chi-square
- 사실 t-test는 retention 여부를 0,1 로 두고 분석한 것입니다.
- 하지만 실제로 retention 여부는 범주형 변수입니다. 이 방법보다는 chi-square검정을 하는 것이 더 좋은 방법입니다.
- 카이제곱검정은 어떤 범주형 확률변수 𝑋 가 다른 범주형 확률변수 𝑌 와 독립인지 상관관계를 가지는가를 검증하는데도 사용됩니다.
- 카이제곱검정을 독립을 확인하는데 사용하면 카이제곱 독립검정이라고 부릅니다.
- 만약 두 확률변수가 독립이라면 𝑋=0 일 때의 𝑌 분포와 𝑋=1 일 때의 𝑌 분포가 같아야 합니다.
- 다시말해 버전이 30일때와 40일 때 모두 Y의 분포가 같은 것입니다.
- 따라서 표본 집합이 같은 확률분포에서 나왔다는 것을 귀무가설로 하는 카이제곱검정을 하여 채택된다면 두 확률변수는 독립입니다.
- 만약 기각된다면 두 확률변수는 상관관계가 있는 것입니다.
- 다시말해 카이제곱검정 결과가 기각된다면 게이트가 30인지 40인지 여부에 따라 retention의 값이 변화하게 된다는 것입니다.
- 𝑋 의 값에 따른 각각의 𝑌 분포가 2차원 표(contingency table)의 형태로 주어지면 독립인 경우의 분포와 실제 y 표본본포의 차이를 검정통계량으로 계산합니다.
- 이 값이 충분히 크다면 𝑋 와 𝑌 는 상관관계가 있다.
