목표
Using 'Big-data platform center' file listed in the E-learning Notices section, do the exploratory data analysis.
-
Include link to the source data
-
Why you chose the source data
-
Use Pandas library
-
Include graphs/charts
-
At least 3 kinds of statistics
-
Explanation of Data Insight
-
Discussion
-
References
- Deliverables: Jupyter Notebook, Report.
데이터 찾기
해당 데이터의 2020년 8월과 2020년 2월꺼를 다운로드했다.
데이터 상황
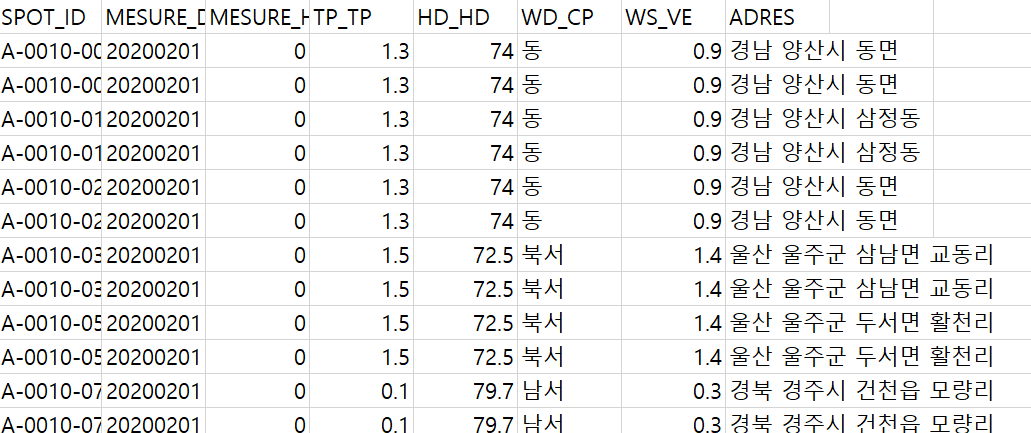
대충 이런식으로 나온다. (row는 약 백만개 이상)
column의 경우 아래와 같다.

Groupby 이용하기
groupby를 이용하려고 했더니 ADRES는 row가 너무많고 특정지을수 없기때문에
이를 경남 양산시 동면 => 경남, 경남 양산시 삼정동=> 경남 이와같이 만드는 새로운 column을 만들려고한다.
첫 단어만 추출하기
name_split = df["기존 column"].str.split(" ")
df["새로운 column"] = name_split.str.get(0)//get(0)은 띄어쓰기를 제외한 첫단어를 적용시킨다.
ex)
name_split02 = data08["ADRES"].str.split(" ")
data02["city"] = name_split02.str.get(0)
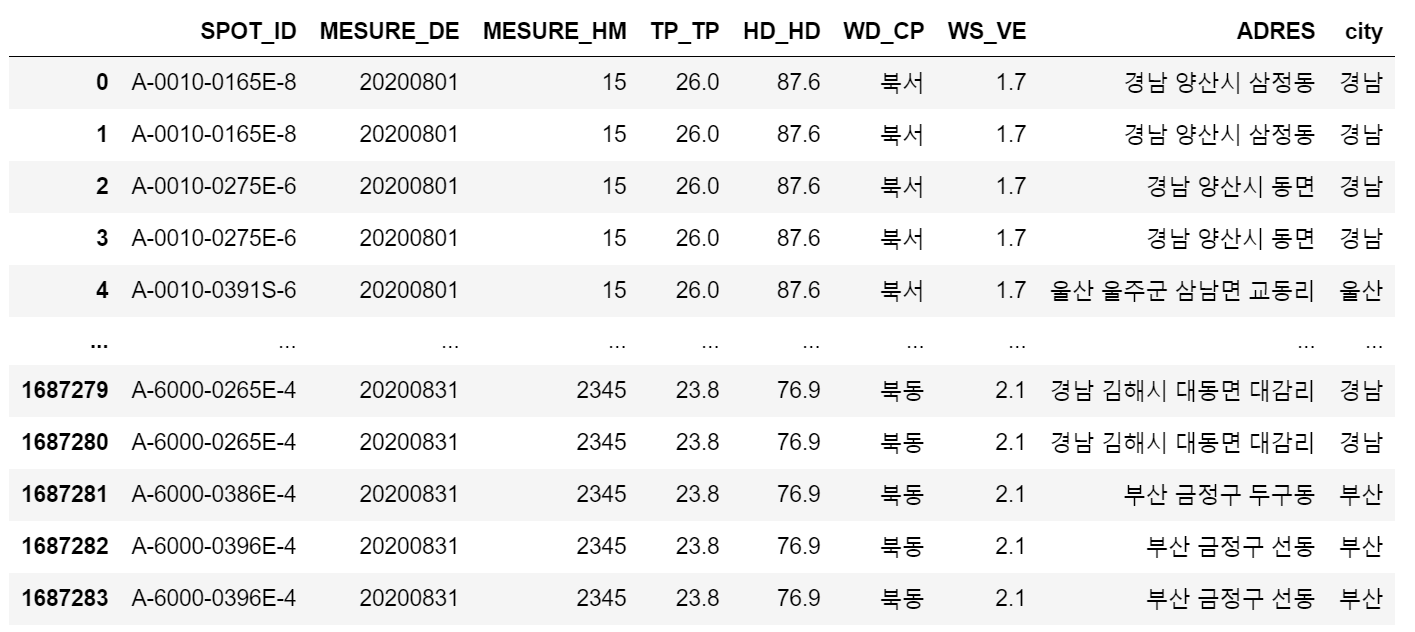
위와 같이 새로운 city column이 생성되고 ADRES에 따른 값이 나타난다.
matplotlib
import import matplotlib.pyplot as plt
plt.rcParams["figure.figsize"] = (10,4)
plt.rcParams['lines.linewidth'] = 4
plt.rcParams['lines.color'] = 'r'
plt.rcParams['axes.grid'] = True
plt.rcParams['font.family'] = 'Malgun Gothic'            #한글깨짐 방지
특히 한글깨짐 방지를 위한 것 주의
GroupBy 적용하기
plt.plot(data02.groupby('city')['TP_TP'].mean().index,data02.groupby('city')['TP_TP'].mean())dataframe 형식인 data02의 city부분이 같은 값들끼리 groupby 후 온도인 배열값들의 index를 x축으로 하고 ('경남','서울','경기' ...같은 예시)
data02의 city부분이 같은 값들끼리 groupby 후 온도값의 평균을 만들어 처리
결과
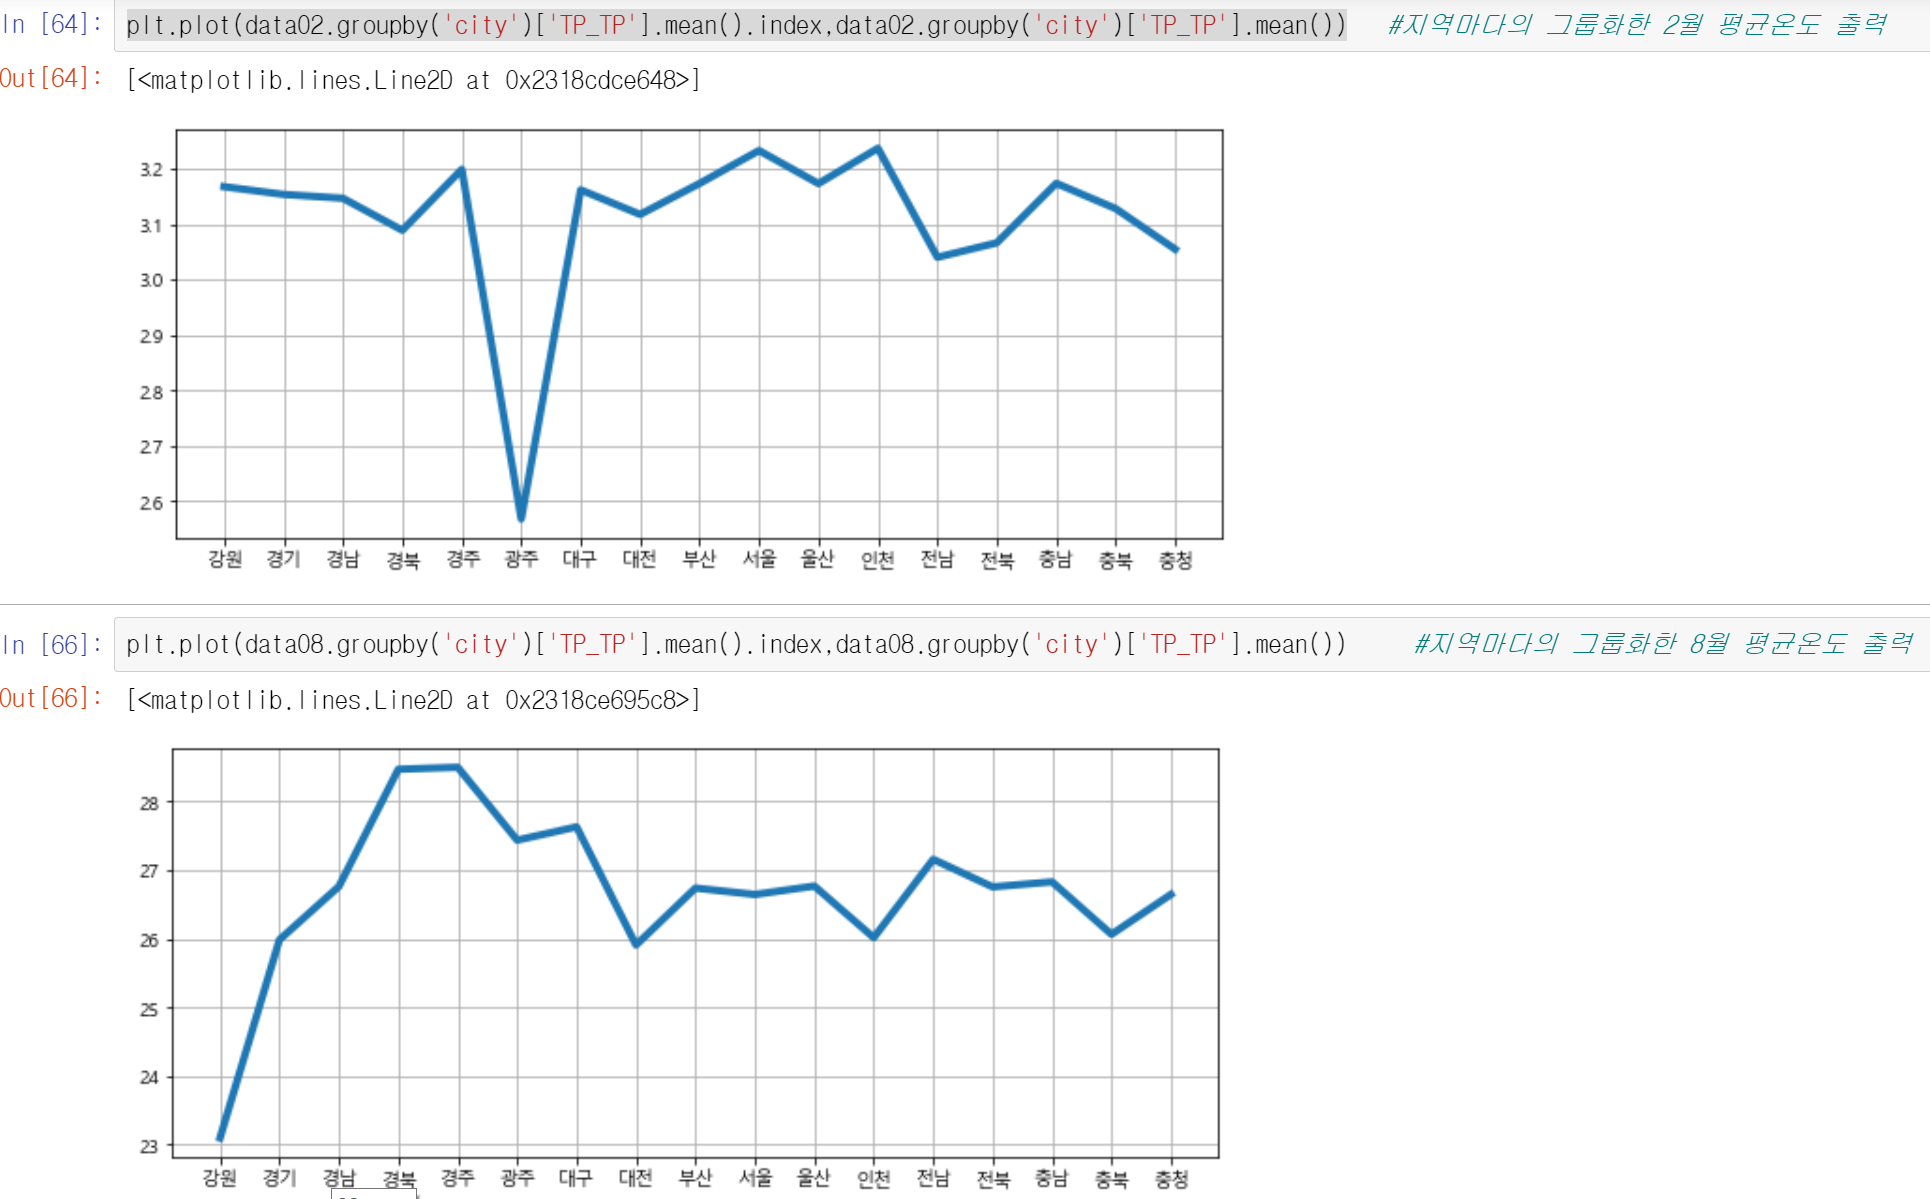
2020년 8월에 강원도가 가장 온도가 낮고 2020년 2월에 광주가 평균온도가 가장낮다.
중요부분
groupby, 첫 단어 추출하는 것과 get()함수