07. Population
목표
인구 소멸 위기 지역 파악
인구 소멸 위기 지역의 지도 표현
지도 표현에 대한 카르토그램 표현
카르토그램이란
카토그램(영어: cartogram)은 의석수나 선거인단수, 인구 등의 특정한 데이터 값의 변화에 따라 지도의 면적이 왜곡되는 그림을 말한다. 변량비례도라고 한다.
데이터 읽고 인구 소멸 지역 계산하기
import numpy as np
import pandas as pd
import matplotlib.pyplot as plt
import set_matplotlib_hangul
import warnings

warnings.filterwarnings(action="ignore")
%matplotlib inline
fillna()
population = pd.read_excel("../data/07_population_raw_data.xlsx", header=1)
population.fillna(method="pad",inplace = True)
population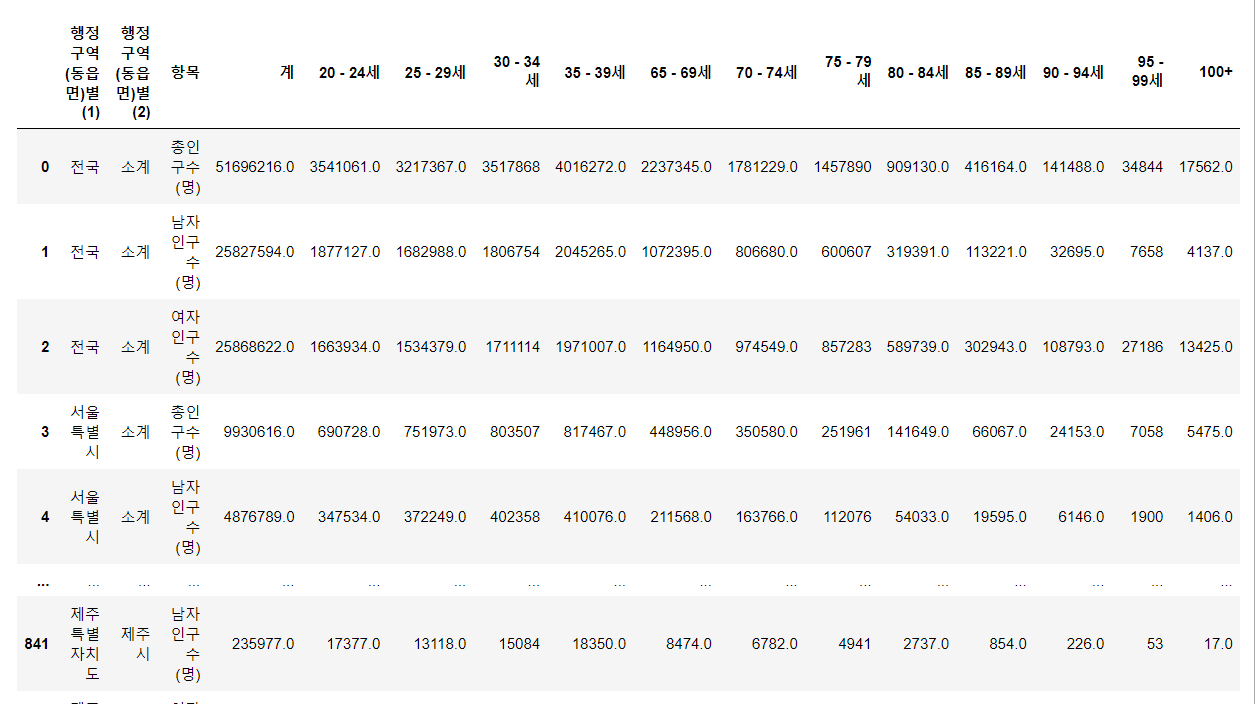
컬럼 이름 변경
population.rename(
    columns={"행정구역(동읍면)별(1)":"광역시도",
            "행정구역(동읍면)별(2)":"시도",
            "계":"인구수"}, inplace=True
)
소계 제거
population = population[population["시도"] != "소계"]합계와 남자, 여자 구분
population.loc[population["구분"]=="총인구수 (명)", "구분"] = "합계"
population.loc[population["구분"]=="남자인구수 (명)", "구분"] = "남자"
population.loc[population["구분"]=="여자인구수 (명)", "구분"] = "여자"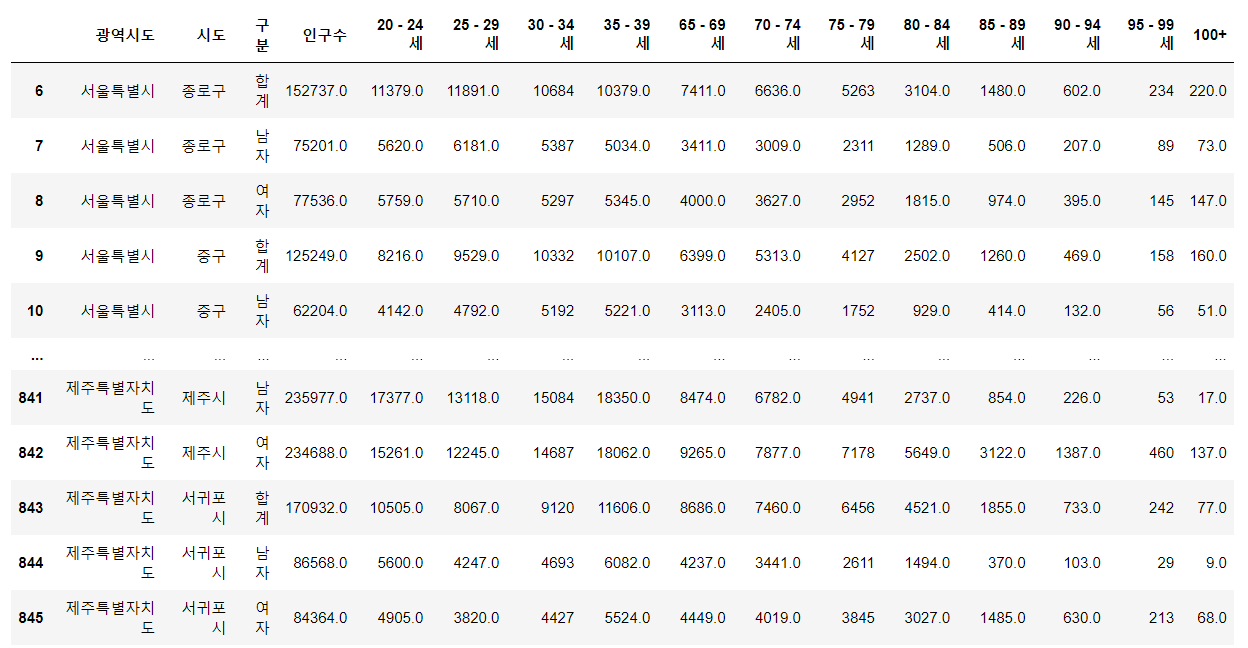
소멸지역을 조사하기 위한 데이터
population["20-39세"] = (
    population["20 - 24세"]+ population["25 - 29세"]
    + population["30 - 34세"]+ population["35 - 39세"])
population["65세 이상"] = (
    population["65 - 69세"]+
    population["70 - 74세"]+
    population["75 - 79세"]+
    population["80 - 84세"]+
    population["85 - 89세"]+
    population["90 - 94세"]+
    population["95 - 99세"]+
    population["100+"])
pivot_table
pop = pd.pivot_table(
    data=population,
    index=["광역시도","시도"],
    columns=["구분"],
values=["인구수","20-39세","65세 이상"])- columns와 values 값이 없으면 평균값이 삽입된다.
소멸 비율 계산
pop["소멸비율"]= pop["20-39세", "여자"]/ (pop["65세 이상","합계"] /2)
pop.tail()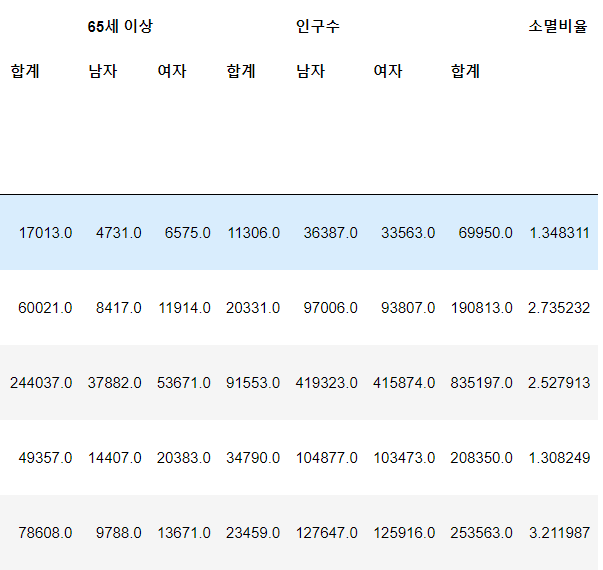
소멸 위기지역 컬럼 생성
pop["소멸위기지역"] = pop["소멸비율"] < 1.0
pop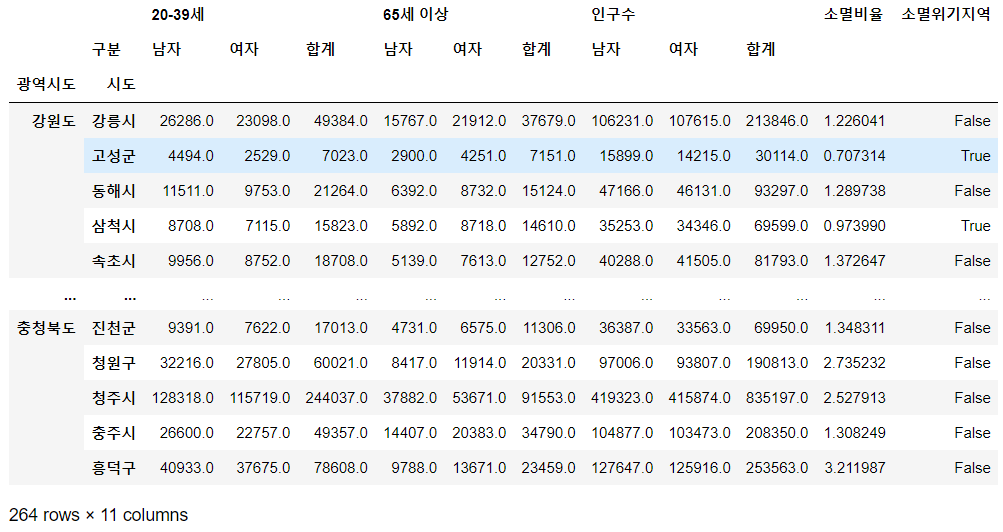
지도 시각화를 위한 지역별 ID 만들기
일반 시이름과 세종시, 광역시 일반 구 정리
for idx, row in pop.iterrows():
    if row["광역시도"][-3:] not in ["광역시","특별시","자치시"]:
        si_name[idx] = row["시도"][:-1]

    elif row["광역시도"] =="세종특별자치시":
        si_name[idx] ="세종"

    else:
        if len(row["시도"]) ==2:
            si_name[idx] = row["광역시도"][:2] +" " + row["시도"]
        else:
            si_name[idx] = row["광역시도"][:2] + " " + row["시도"][:-1]
그러면 ['강릉',
'고성',
'동해',
'삼척',
'속초']
이런 순의 리스트를 얻을 수 있습니다.
행정구
for idx, row in pop.iterrows():
    if row["광역시도"][-3:] not in ["광역시","특별시","자치시"]:
        for keys, values in tmp_gu_dict.items():
            if row["시도"] in values:
                if len(row["시도"]) ==2:
                    si_name[idx] = keys + " " + row["시도"]

                elif row["시도"] in ["마산합포구","마산회원구"]:
                    si_name[idx] = keys + " " + row["시도"][2:-1]

                else:
                    si_name[idx] = keys + " " + row["시도"][:-1]
지도 그리기(카르토그램)
BORDER_LINES=[
[(5,1),(5,2),(7,2),(7,3),(11,3),(11,0)], # 인천
[(5,4),(5,5),(2,5),(2,7),(4,7),(4,9),(7,9),(7,7),(9,7),(9,5),(10,5),(10,4),(5,4)], # 서울
[(1,7),(1,8),(3,8),(3,10),(10,10),(10,7),(12,7),(12,6),(11,6),(11,5),(12,5),(12,4),(11,4),(11,3)], # 경기도
[(8,10),(8,11),(6,11),(6,12)], # 강원도
[(12,5),(13,5),(13,4),(14,4),(14,5,),(15,5),(15,4),(16,4),(16,2)], # 충청북도
[(16,4),(17,4),(17,5),(16,5),(16,6),(19,6),(19,5),(20,5),(20,4),(21,4),(21,3),(19,3),(19,1)], # 전라북도
[(13,5),(13,6),(16,6)],
[(13,5),(14,5)], # 대전시 세종
[(21,2),(21,3),(22,3),(22,4),(24,4),(21,2),(24,2)], #광주
[(20,5),(21,5),(21,6),(23,6)], #전라남도
[(10,8),(12,8),(12,9),(14,9),(14,8),(16,8),(16,6)], # 충청북도
[(14,9),(14,11),(14,12),(13,12),(13,13)], # 경상북도
[(15,8),(17,8),(17,10),(16,10),(16,11),(14,11)], # 대구
[(17,9),(18,9),(18,8),(19,8),(19,9),(20,9),(20,10),(21,10)], # 부산
[(16,11),(16,13)],
[(27,5),(27,6),(25,6)]
]
라는 함수를 만들었어요,,경계선을 구분해줄 수 있는 좌표를 쳤습니다..휴
def plot_text_simple(draw_korea):
    for idx, row in draw_korea.iterrows():
        if len(row["ID"].split()) ==2:
            disname ="{}\n{}".format(row["ID"].split()[0],row["ID"].split()[1])
        elif row["ID"][:2] =="고성":
            disname ="고성"
        else:
            disname = row["ID"]
        if len(disname.splitlines()[-1]) >= -3:
            fontsize, linespacing = 9.5,1.5
        else:
            fontsize, linespacing = 11,1.2


        # 주석다는 기능 annotate
        plt.annotate(
            disname,
            (row["x"] + 0.5,row["y"]+ 0.5),
            weight = "bold",
            fontsize = fontsize,
            linespacing = linespacing,
            ha="center", # 수평 정렬
            va="center" # 수직 정렬
        )
def simpelDraw(draw_korea):
plt.figure(figsize=(8,11))
plot_text_simple(draw_korea)
for path in BORDER_LINES:
ys, xs = zip(*path)
plt.plot(xs,ys, c="black", lw=1.5)
plt.gca().invert_yaxis()
plt.axis("off")
plt.tight_layout()
plt.show()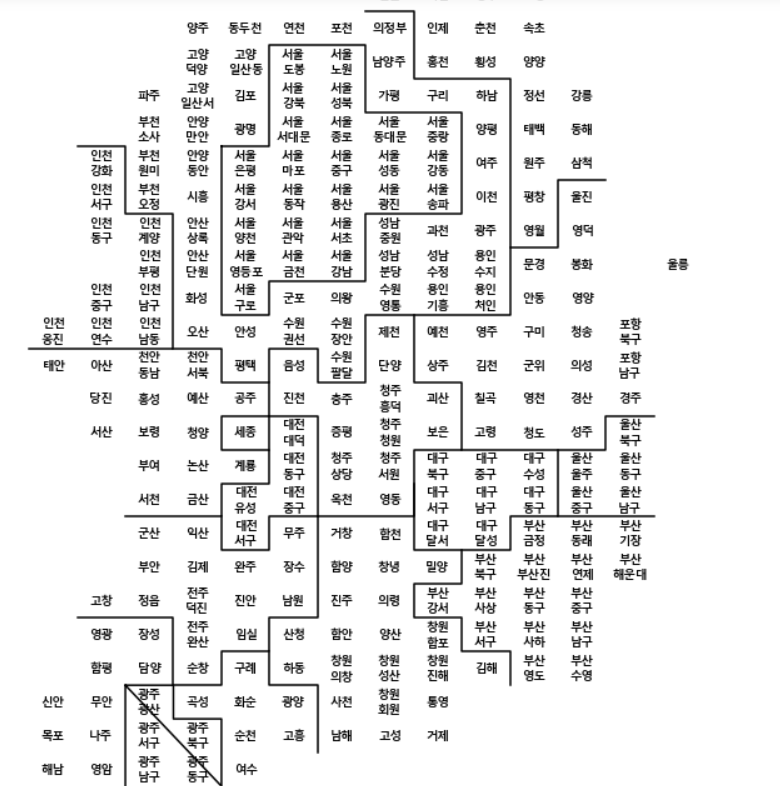
그림을 그리기 위한 데이터를 계산하는 함수
색상을 만들 때, 최소값을 흰색
blockMap : 인구현황(pop)
targetData: 그리고 싶은 컬럼
def get_data_info(targetData,blockeMap):
    whitelabelmin=(
        max(blockeMap[targetData])- min(blockeMap[targetData]))*0.25 + min(blockeMap[targetData])
    vmin = min(blockeMap[targetData])
    vmax = max(blockeMap[targetData])

    mapdata = blockeMap.pivot_table(index="y",columns="x", values= targetData)

    return mapdata, vmax, vmin, whitelabelmin

def get_data_info_for_zero_center(targetData,blockeMap):
    whitelabelmin = 5
    tmp_max = max(
        [np.abs(min(blockeMap[targetData])), np.abs(max(blockeMap[targetData]))])

    vmin, vmax = -tmp_max, tmp_max
    mapdata = blockeMap.pivot_table(index="y",columns="x", values= targetData)


    return mapdata, vmax, vmin,whitelabelmin

def plot_text(targetData, blockeMap, whitelabelmin):
    for idx, row in blockeMap.iterrows():
        if len(row["ID"].split()) ==2:
            disname ="{}\n{}".format(row["ID"].split()[0],row["ID"].split()[1])
        elif row["ID"][:2] =="고성":
            disname ="고성"
        else:
            disname = row["ID"]
        if len(disname.splitlines()[-1]) >= -3:
            fontsize, linespacing = 9.5,1.5
        else:
            fontsize, linespacing = 11,1.2


        annocolor = "white" if np.abs(row[targetData]) > whitelabelmin else "black"
        plt.annotate(
            disname,
            (row["x"] + 0.5,row["y"]+ 0.5),
            weight = "bold",
            color=annocolor,
            fontsize = fontsize,
            linespacing = linespacing,
            ha="center", # 수평 정렬
            va="center" # 수직 정렬
        )
def drawKorea(targetData, blockeMap, cmapname,zeroCenter=False):

    if zeroCenter:
        masked_mapdata, vmax,vmin, whitelabelmin = get_data_info_for_zero_center(targetData, blockeMap)

    if not zeroCenter:
        masked_mapdata, vmax,vmin, whitelabelmin = get_data_info(targetData, blockeMap)

    plt.figure(figsize=(8,11))
    plt.pcolor(masked_mapdata, vmin=vmin, vmax=vmax, cmap=cmapname,edgecolor="#aaaaaa", linewidth=0.5)

    plot_text(targetData, blockeMap, whitelabelmin)

    for path in BORDER_LINES:
        ys, xs = zip(*path)
        plt.plot(xs,ys, c="black", lw=1.5)

    plt.gca().invert_yaxis()
    plt.axis("off")
    plt.tight_layout()
    cb=plt.colorbar(shrink=0.1,aspect=10)
    cb.set_label(targetData)
    plt.show()
 drawKorea("인구수합계",pop,"Blues")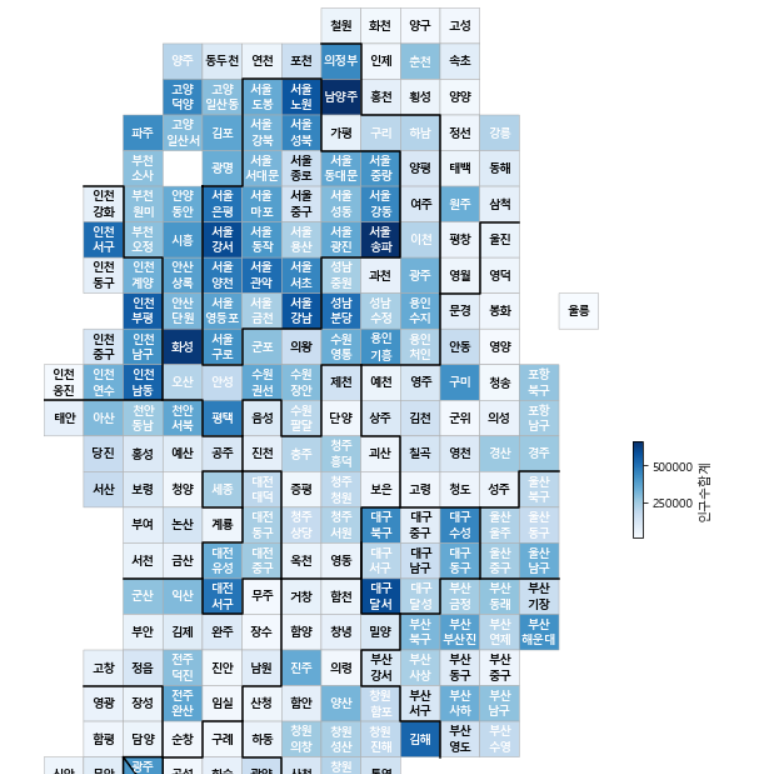
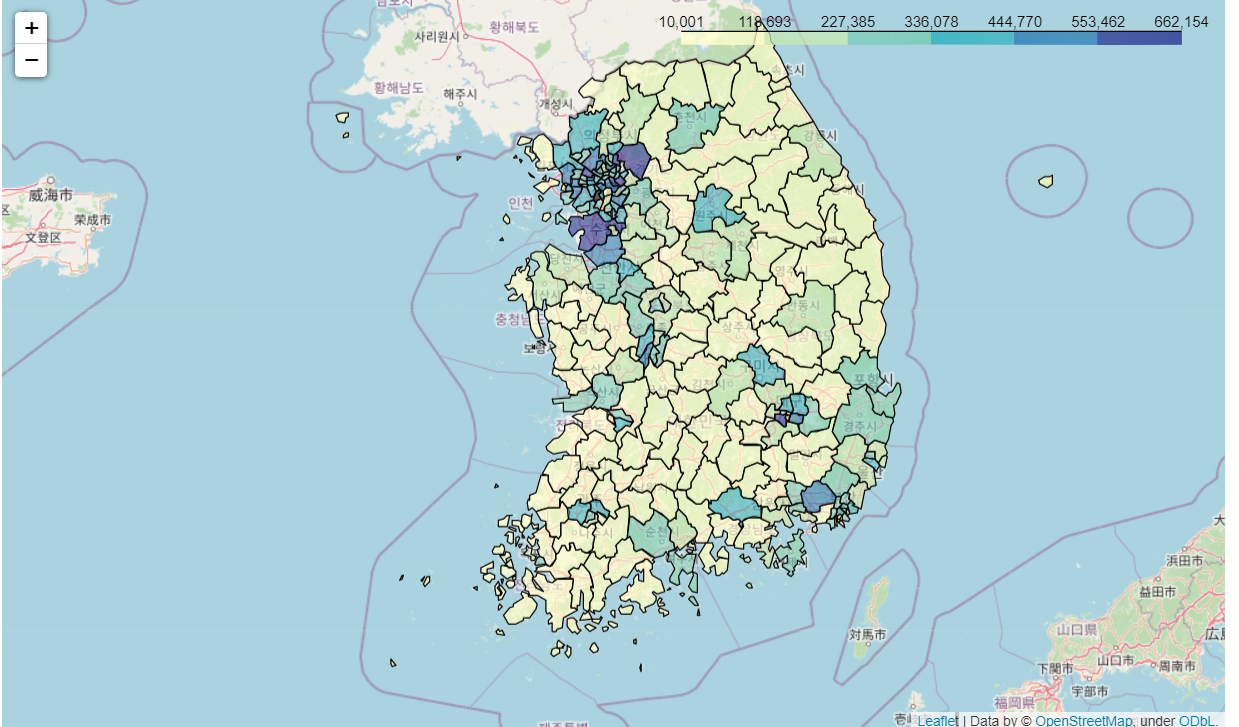
folium 이용해서 지도만들기
geo_path = "../data/07_skorea_municipalities_geo_simple.json"
geo_str = json.load(open(geo_path, encoding="utf-8"))

# 인구수 합계
mymap = folium.Map(location=[36.2002, 127.054], zoom_start=7)
mymap.choropleth(
    geo_data=geo_str,
    data= pop_folium["인구수합계"],
    key_on="feature.id",
    columns=[pop_folium.index, pop_folium["인구수합계"]],
    fill_color="YlGnBu")
mymap