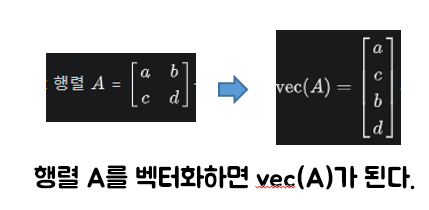
데이터 벡터화
- 벡터화란 수학적인 의미로 행렬을 세로 벡터로 바꾸는 선형변환의 하나이다.
머신러닝의 데이터
- 보통 matrix or table의 형태로 되어있다.
- 독립 변수(설명 변수)인 x와 종속 변수(반응 변수)인 y로 이루어져있다.
- 무작정 데이터를 수집하면 안된다. -> 데이터를 matrix 형태로 추출 후 벡터화하는 것이 좋다.
이미지 데이터 Embedding
- OpenCV : 실시간 컴퓨터 Vision을 처리하는 목적으로 만들어진 라이브러리이다. 크로스 플랫폼 라이브러리로서 Windows, Linux, Mac 등에서 무료로 사용 가능하다.
이미지, 영상처리, Object Detection, Motion Detection 등 매우 다양한 기능들을 제공한다.
pip install opencv-python
- skimage(scikit-image) : Python 프로그래밍 언어용 오픈 소스 이미지 처리 라이브러리이다. 파이썬 Numpy 및 SciPy와 상호 운용되도록 설계되었다.
세분화, 기하학적 변형, 색 공간 조작, 분석, 필터링, 형태학, 형상 감지 등 다양한 기능들을 제공한다.
pip install scikit-image
1. Image embedding example
skimage 라이브러리에 내장된 이미지를 호출하고 출력한다.
from skimage import data, io
from matplotlib import pyplot as plt

camera = data.camera()  # 카메라 이미지 호출 (grey scale)
io.imshow(camera)
plt.show()
print(type(camera), camera.shape)   # 512 x 512 차원
print(camera)

cat = data.chelsea()
io.imshow(cat)
plt.show()
print(type(cat), cat.shape)  # 300 x 451 x 3 차원
print(cat)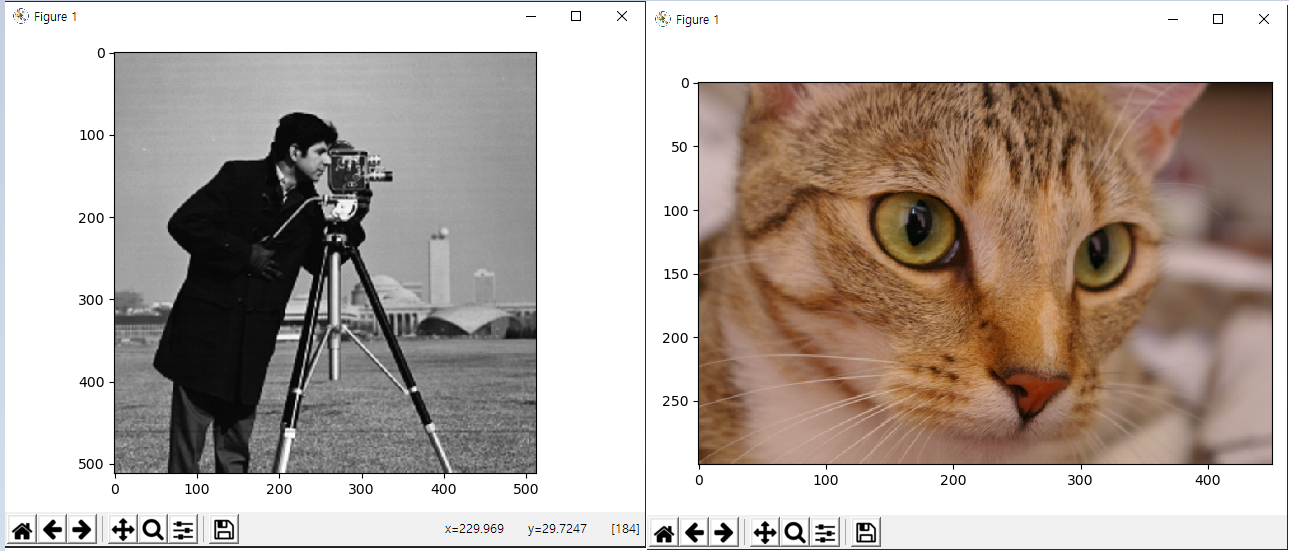
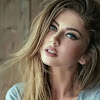
2. Image color detection
호출한 해당 url의 이미지에서 특정 범위에 있는 색상의 비율을 탐지한다. 처음으로 빨간색 부분을 흰색으로 표시 , 아닌 부분을 검게 처리한다. 다음으로 주황색 부분을 흰색으로 처리 , 아닌 부분을 검게 처리한다. (반복)
import numpy as np
import cv2 as cv
from skimage import io
from matplotlib import pyplot as plt

# HSV scale 방법
# color RGB 값 임의로 설정
red = np.array([[0, 80, 80], [10, 255, 255]])   # red RGB 값 시작~끝 값 임의로 설정
orange = np.array([[13, 80, 80], [23, 255, 255]])
yellow = np.array([[25, 80, 80], [35, 255, 255]])
green = np.array([[40, 80, 80], [80, 255, 255]])
blue = np.array([[80, 80, 80], [140, 255, 255]])
pink = np.array([[145, 80, 80], [160, 255, 255]])
red_high = np.array([[170, 80, 80], [180, 255, 255]])   # 마지막도 red

color_names = ["red", "orange", "yellow", "green", "blue", "pink"]
colors = [red, orange, yellow, green, blue, pink, red_high]

# 이미지 url
url = "https://lh3.googleusercontent.com/0ov1-rv3uTpw4KQphQUemyHPslZ4a8q-5C3c89lbXUKjbo9RzVaYH4F8_sMJBm4dsR0"
url = "https://lh6.ggpht.com/hIY78puIGVb26VFsWexvVe5T00nfLK9IKbg8uHKK9MwyAO0aPySjopPh1NUSMJYM2UWX"

image = io.imread(url)
image = cv.cvtColor(image, cv.COLOR_RGB2BGR)    # 이미지 프로토콜 변환
hsv = cv.cvtColor(image, cv.COLOR_BGR2HSV)

ratios_dic = {} # key = 색 / value = 색상 비율

for i in range(len(colors)):
    mask = cv.inRange(hsv, colors[i][0], colors[i][1])

    io.imshow(mask)
    plt.show()

    if i != len(colors) - 1:
        ratios_dic[color_names[i]] = np.count_nonzero(mask) / float(np.prod(mask.shape)) * 100
    else:
        ratios_dic[color_names[0]] = ratios_dic[color_names[0]] +  np.count_nonzero(mask) / float(np.prod(mask.shape)) * 100

print(ratios_dic)
green 색상의 비율이 가장 높다!
텍스트 데이터 embedding
문서 하나가 기준이다.
1. Tokenization : 단어 수준으로 문서를 쪼갠다.
2. stemming : 단어를 일반형(원형)으로 변환
3. stopwords : 불필요한 단어 제거
4. 동의어 처리

- 분석의 목적에 따라 단계를 skip 가능하다.
- 단어가 나오는 빈도수가 중요하지 않을 수 있다.
- NLP(Natural Language Processing) 도구에는 BERT(Google), Lucene, KKMA, Khaiii(Kakao), KoNLPy 등이 있다.
(ex)
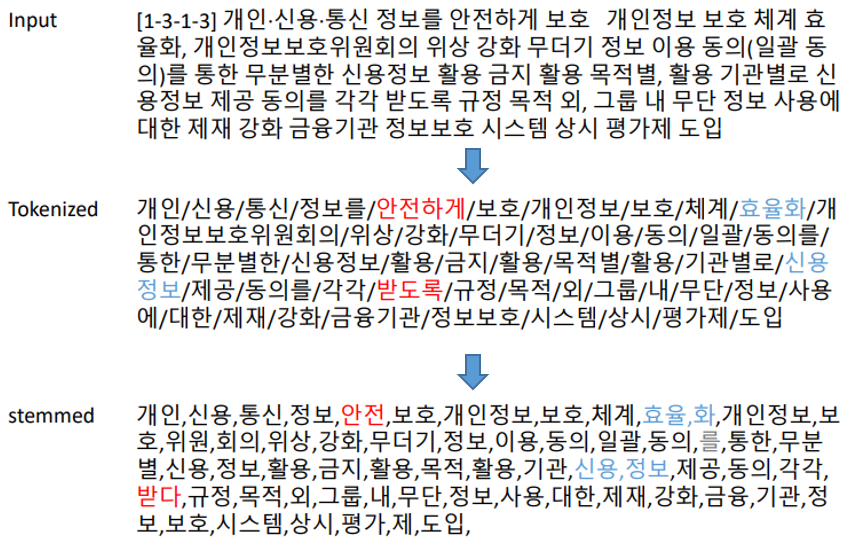
- 안전하게 -> 안전 (stemming) : 단어를 원형으로 변환
- 효율화 -> 효율 , 화 // 신용정보 -> 신용 , 정보 (stemming) : 분석하는 목적과 도메인에 따라 원형으로 변환하는 기준이 달라진다.
- 위에처럼 변환하라는 규칙은 없다!
텍스트 데이터의 일반적인 분석 단위는 문서 or 단어이다.
가장 일반적으로 사용되는 방식은 term-document-matrix 이다.
<term-document-matrix>
* 하나의 문서를 특정 단어의 등장여부/빈도수로 구성된 벡터로 표현
* 하나의 단어를 발생한 문서로 구성된 벡터로 표현 (위와 반대)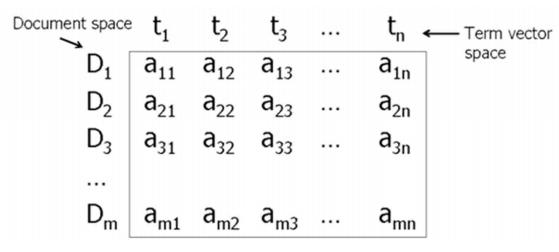
(ex1)
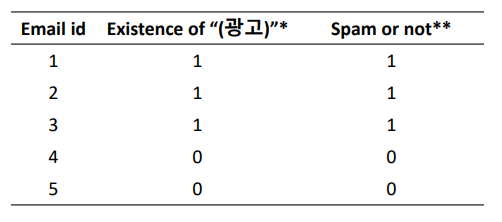
- Email : 문서 단위 // '광고'라는 단어 : 1차원 벡터
- Existence of "광고"는 벡터화 된다.
- Spam or not은 labeling(정답지) 되었다.
- DT로 스팸 메일인지 아닌지 알 수 있다.
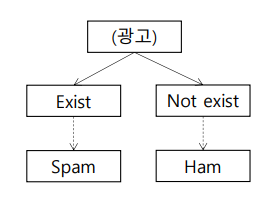
Existence of "광고" : 1 -> 단어 존재 // 0 -> 존재 X
Spam or not : 1 -> 스팸 메일 // 0 -> 스펨 메일 X
(ex2)
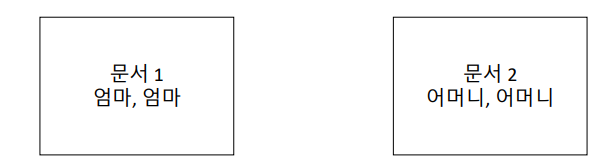
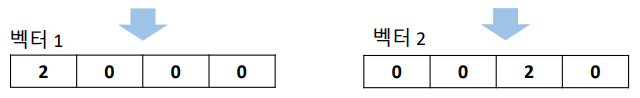
(1) '엄마', '아빠', '어머니', '아버지'로 구성된 4차원 벡터로 표현하시오.
-> word vector로 표현하자. 하나의 문서를 특정 단어의 등장여부/빈도수로 구성된 벡터로 표현하자.
(2) 일반적으로 사용될 수 있는 word vector의 차원수는?
-> 작게는 2차원 벡터부터 몇 십만, 백만 단위로 엄청 크다. 따라서 고성능의 하드웨어와 많은 컴퓨팅 자원의 소모가 필요하다.
(3) 문서1, 문서2는 다른 문서인가? and 벡터1, 벡터2는 다른 벡터인가?
-> 유사한 문서이다. 단어의 의미가 서로 유사하기 때문이다.
-> 벡터끼리의 유사도가 0으로 서로 관계가 없다. 구문적인 의미(semantic)를 담고있지 않기 때문이다.
Word Cloud 그리기 (Python)
Word Cloud : 단어 뭉치를 가시화하는 방식이다. 빈도수/중요도 등 가중치에 따라
색/크기로 차이를 주어 표현한다.
import pytagcloud
import pygame

tag = [('hello', 100), ('world', 80), ('Python', 120), ('kdb', 70), ('nice', 60), ('Deep Learning', 20), ('DB', 40),
       ('great', 120), ('MySQL', 110), ('DT', 125), ('SVM', 10), ('Text Data mining', 170), ('kaggle', 45), ('randomForest', 55), ('Regression', 160), ('Loss Function', 195)]

tag_list = pytagcloud.make_tags(tag, maxsize=50)    # tag화 시켜줌
pytagcloud.create_tag_image(tag_list, 'word_cloud.jpg', size=(900, 600), rectangular=False)

import webbrowser
webbrowser.open('word_cloud.jpg')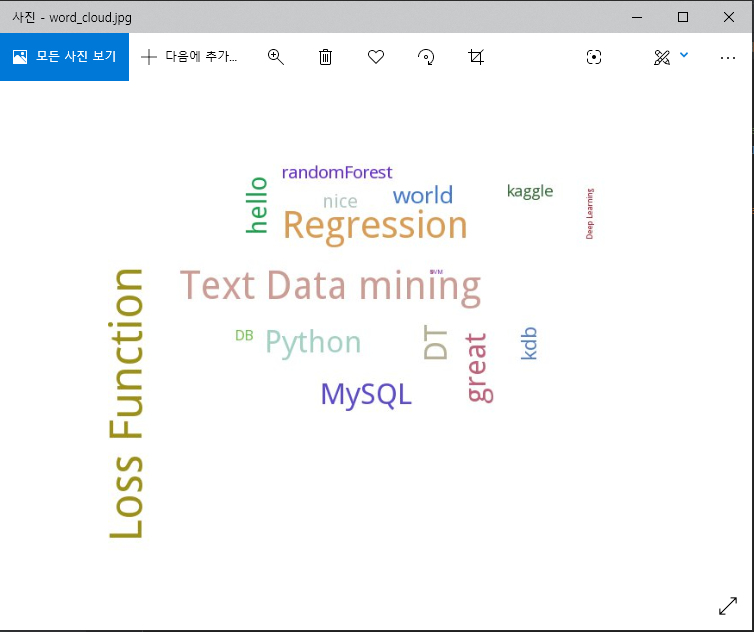
5개의 댓글

Such an interesting article here.I was searching for something like that for quite a long time and at last I have found it here. https://www.jacketsmasters.com/product/heart-of-stone-parker-jacket/
This is the best post I have ever seen. Very clear and simple. Mid-portion Is quite interesting though. Keep doing this. I will visit your site again. Eddie Munson Vest

Excellent blog! Such clever work and exposure! Keep up the very good work. Black Parade Jacket

https://3dwarehouse.sketchup.com/by/chinabamboo
https://blog.ulifestyle.com.hk/chinabamboo
https://routinehub.co/user/chinabamboo
https://hub.docker.com/u/chinabamboo
https://pantip.com/profile/9010914#topics
https://tamilculture.com/user/china-bamboo
https://www.passes.com/chinabamboo
https://aiplanet.com/profile/chinabamboo
https://bookmeter.com/users/1612789
https://linkfly.to/70816G7up4g
https://www.papercall.io/speakers/chinabamboo
https://sketchersunited.org/users/273241
https://biomolecula.ru/authors/82748
https://linkr.bio/chinabamboo/store
https://smartprogress.do/user/752262/
https://swaay.com/u/bothbest/
https://2024.hackerspace.govhack.org/profiles/china_bamboo
http://www.ssnote.net/users/chinabamboo
https://www.notebook.ai/@chinabamboo
https://cofacts.tw/user/chinabamboo
https://bio.site/bambooflooring
https://www.myminifactory.com/users/chinabamboo
https://www.upcarta.com/profile/chinabamboo
https://chinabamboo.stck.me/
https://coub.com/chinabamboo
https://portfolium.com/chinabamboo
https://motion-gallery.net/users/817902
With OpenCV, developers can access a comprehensive set of tools for manipulating and analyzing image and video shell shockers data. These tools include features like image filtering, edge detection, feature extraction, image segmentation, and more. OpenCV also provides built-in support for camera calibration, stereo vision, and 3D reconstruction.