Weblogic Monitoring Exporter
Exporter?
특정 Metrics를 수집 후 end-point에 노출시키는 SoftWare 혹은 Agent
Unix의 CPU, Memory 등의 Metrics를 수집하는 Node Exporter 외에도 DB, HardWare 등 여러 시스템에 대한 Exporter가 존재.
Weblogic Monitoring Exporter?
Weblogic의 MBean 정보를 REST API를 기반으로 모니터링을 가능하게 해주는 Prometheus용 Exporter
Prometheus 설치
테스트를 위해 k8s 환경이 아닌 Centos 서버에 직접 Prometheus를 설치
Prometheus 설정 파일을 위한 디렉토리 생성
sudo mkdir /etc/prometheus
sudo mkdir /var/lib/prometheus
sudo chown prometheus:prometheus /etc/prometheus
sudo chown prometheus:prometheus /var/lib/prometheus
Prometheus 설치
https://prometheus.io/download/ 에서 설치. 혹은
curl -LO https://github.com/prometheus/prometheus/releases/download/v2.16.0/prometheus-2.16.0.linux-amd64.tar.gz
tar xzvf prometheus-2.16.0.linux-amd64.tar.gz
실행파일 및 설정파일 복사
cd prometheus-2.16.0.linux-amd64
sudo cp prometheus /usr/local/bin
sudo cp promtool /usr/local/bin
sudo cp –r consoles /etc/prometheus
sudo cp –r console_libraries /etc/prometheus
sudo chown –R prometheus:prometheus /etc/prometheus/consoles
sudo chown –R prometheus:prometheus /usr/lib/prometheus/console_library
Prometheus yaml 파일 생성
vi prometheus.ymlglobal:
scrape_interval: 15s
scrape_configs:
- job_name: 'prometheus'
scrape_interval: 5s
static_configs:
- targets: ['localhost:9090']systemd service 파일 생성
vi /etc/systemd/system/prometheus.service[Unit]
Description=Prometheus
Wants=network-online.target
After=network-online.target
[Service]
User=prometheus
Group=prometheus
Type=simple
ExecStart=/usr/local/bin/prometheus \
--config.file /etc/prometheus/prometheus.yml \
--storage.tsdb.path /var/lib/prometheus/ \
--web.console.templates=/etc/prometheus/consoles \
--web.console.libraries=/etc/prometheus/console_libraries
# 주소 변경시 이곳에서 변경합니다. 윗 줄에 \ 를 삽입합니다.
# --web.listen-address=localhost:10000
[Install]
WantedBy=multi-user.target기동/정지
sudo systemctl daemon-reload

sudo systemctl start prometheus
sudo systemctl stop prometheus
Weblogic Monitoring Exporter 배포
https://github.com/oracle/weblogic-monitoring-exporter/releases/
해당 페이지에서 wls-exporter.war 설치 및 배포
이때 모니터링 하고자 하는 모든 인스턴스에 배포를 진행
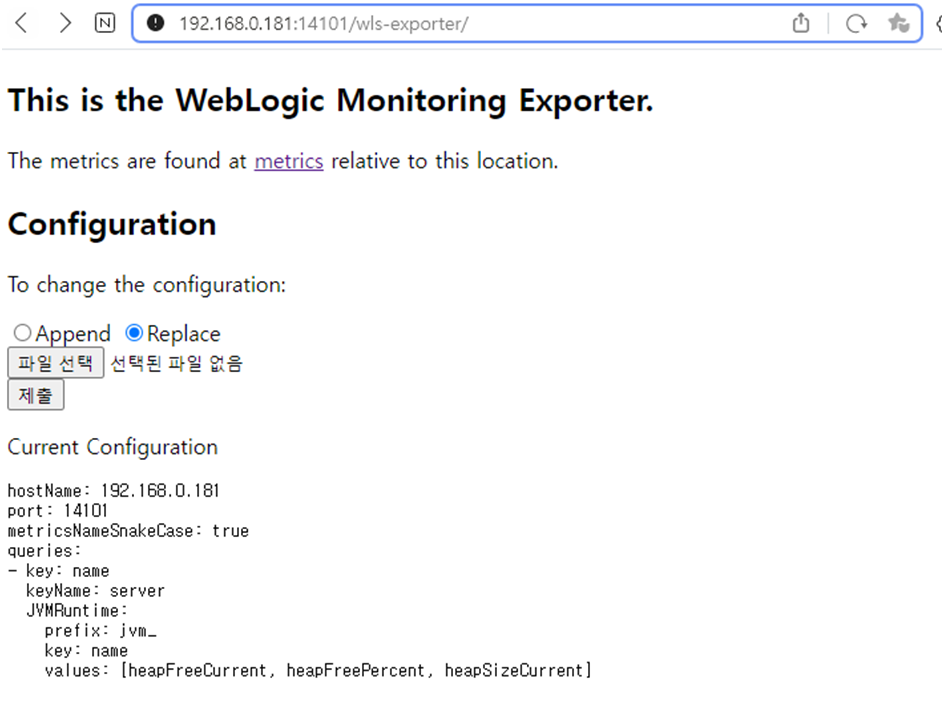
IP:PORT/wls-exporter 에 접근하면 다음과 같은 페이지 호출
설정파일 배포
https://github.com/oracle/weblogic-monitoring-exporter/tree/main/samples/configurations
해당 주소에서 sample 파일을 참고하여 설정파일을 제출 가능
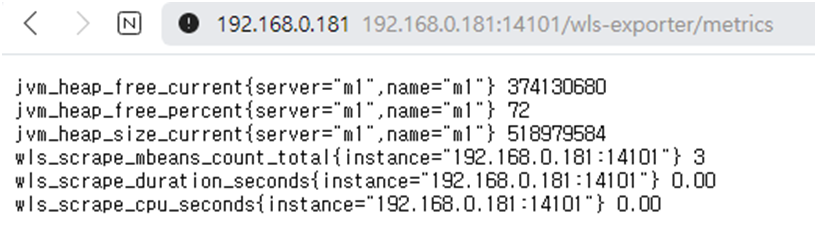
제출 후 상단의 metrics를 클릭하여 REST API를 통해 제출된 json 데이터 확인 가능
설정파일 분석
metricsNameSnakeCase: true
queries:
- key: name
  keyName: server
  JVMRuntime:
    prefix: jvm_
    key: name
    values: [heapFreeCurrent, heapFreePercent, heapSizeCurrent]
해당 설정 파일을 보면 JVMRuntime 의 heapFreeCurrent, heaFreePercent, heapSizeCurrent 정보를 요청
실제 wlst를 통해 확인시,
wls:/offline> connect('kimsw','kimsw001','t3://192.168.0.181:14100')
wls:/domainKim/serverConfig/> domainRuntime()
wls:/domainKim/domainRuntime/> cd('ServerRuntimes/m1/JVMRuntime/m1')
wls:/domainKim/domainRuntime/ServerRuntimes/m1/JVMRuntime/m1> ls()
-r--   HeapFreeCurrent                              301632432
-r--   HeapFreePercent                              58
-r--   HeapSizeCurrent                              518979584
-r--   HeapSizeMax                                  518979584
-r--   JavaVMVendor                                 Oracle Corporation
-r--   JavaVendor                                   Oracle Corporation
-r--   JavaVersion                                  1.8.0_261
-r--   Name                                         m1
-r--   OSName                                       Linux
-r--   OSVersion                                    3.10.0-1160.66.1.el7.x86_64
-r--   Type                                         JVMRuntime
-r--   Uptime                                       20916620
위와 같은 정보를 확인 가능하며, 해당 정보를 통해 json 을 생성
Weblogic Monitoring Exporter 연동
prometheus.yml 작성
cd /etc/prometheus/
vi prometheus.ymlglobal:
scrape_interval: 15s
scrape_configs:
- job_name: 'prometheus'
scrape_interval: 5s
static_configs:
- targets: ['localhost:9090']
# Weblogic 설정
- job_name: 'oracle_export'
scrape_interval: 5s
static_configs:
- targets: ['192.168.0.181:14101']
metrics_path: /wls-exporter/metrics
basic_auth:
username: kimsw
password: kimsw001yaml 작성 후 재기동
sudo systemctl stop prometheus
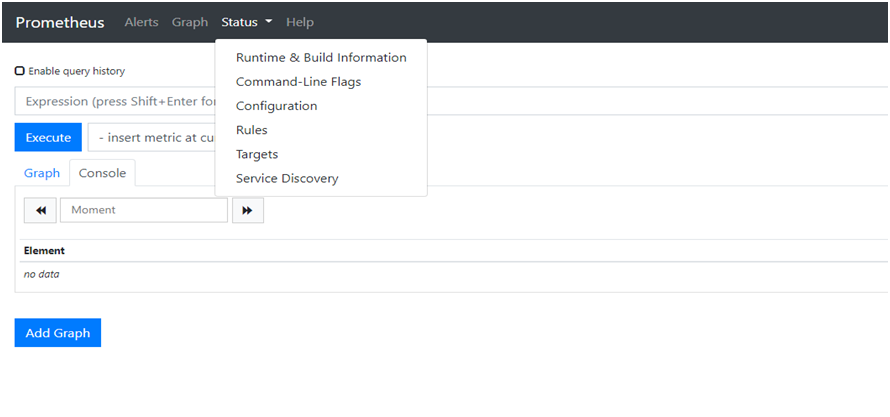
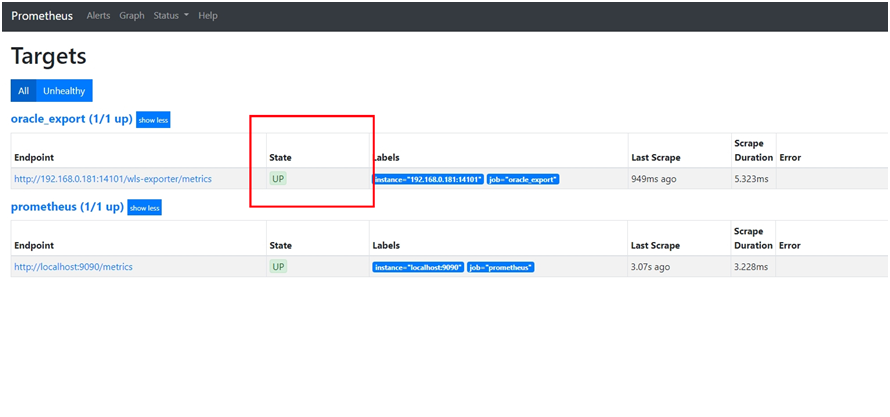
sudo systemctl start prometheusStatus - Targets
웹로직 서버 상태 확인
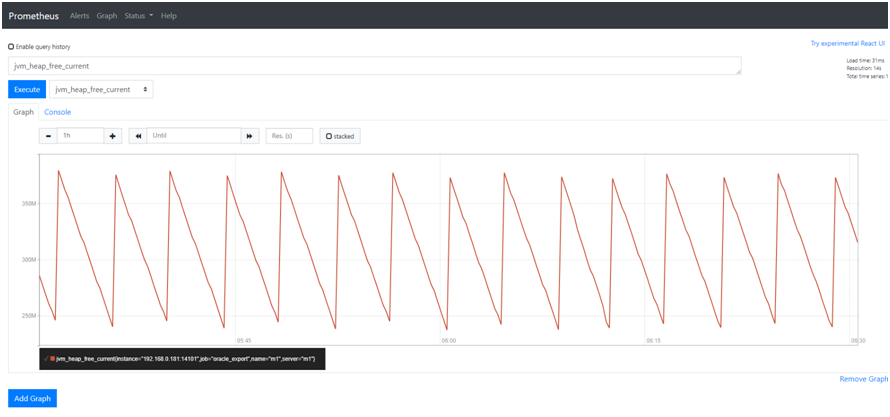
Graph에서 특정 metric 검색 가능
참고
https://mee-nam-lee.github.io/cloud/2019/k8s-weblogic-monitoring/
https://gethue.com/set-up-prometheus-server-without-kubernetes/