Matplotlib
- 다양한 형태의 그래프를 통해서 데이터 시각화를 할 수 있는 라이브러리
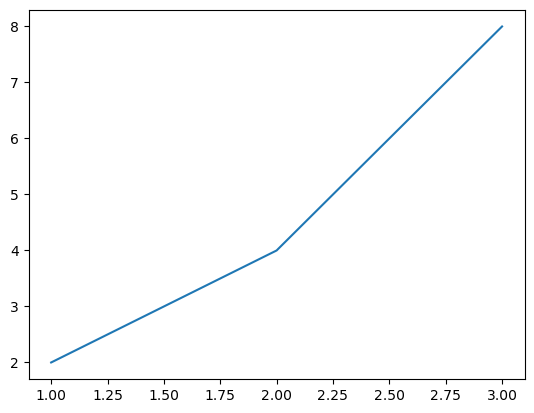
x = [1, 2, 3]
y = [2, 4, 8]
plt.plot(x , y)

print(plt.plot(x , y))
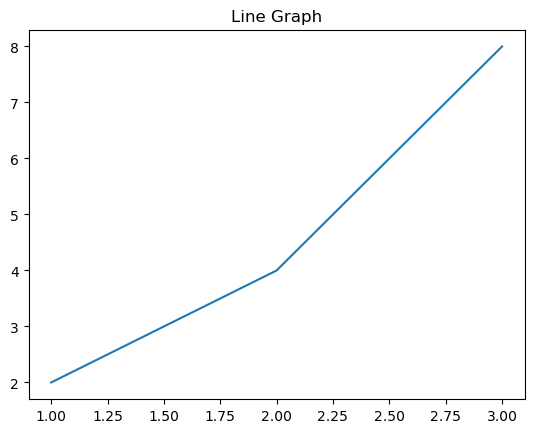
Title 설정
plt.plot(x,y)
plt.title('Line Graph')
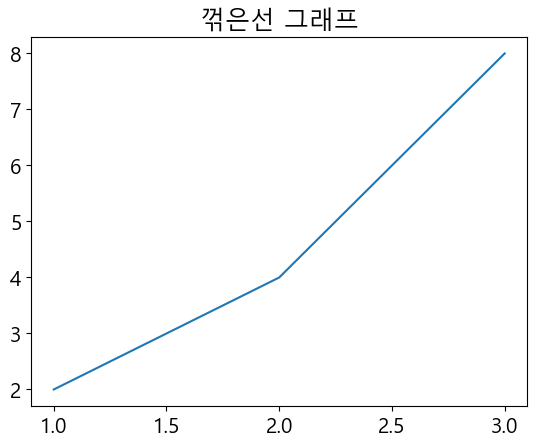
한글 폰트 설정
import matplotlib
matplotlib.rcParams['font.family'] = 'Malgun Gothic'
matplotlib.rcParams['font.family'] = 'AppleGothic'
matplotlib.rcParams['font.size'] = 15
matplotlib.rcParams['axes.unicode_minus'] = False
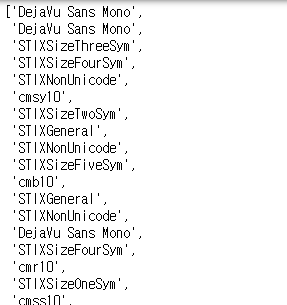
import matplotlib.font_manager as fm
fm.fontManager.ttflist
[f.name for f in fm.fontManager.ttflist]
plt.plot(x,y)
plt.title('꺾은선 그래프')
plt.plot([-1, 0, 1], [-5, -1, 2])