Spring Boot 애플리케이션에 Prometheus + Grafana 연동하기
백엔드에서만 코드를 작성 하다보면 지금 서버가 잘 돌아가는지 의문이 들 때가 있습니다. 🤷♀️🤷♂️
- 단순 로그만 보는 것으로는 그 느낌이 잘 안오기 때문입니다.
- 그래서 이번에 강의시간에 강사님의 추천으로 Spring Boot 애플리케이션의 상태를 실시간으로 모니터링하고 시각화할 수 있도록 Prometheus와 Grafana 연동 구조를 구성해보았습니다.
🔥Prometheus와 Grafana🔥
- Prometheus : Prometheus는 시계열 기반의 모니터링 도구로 다양한 애플리케이션, 인프라, 시스템에서 실시간 메트릭 데이터를 주기적으로 수집하고 이를 내부 데이터베이스에 저장하는 기능을 합니다.
- Grafana : Grafana는 시계열 데이터 시각화 플랫폼으로 Prometheus를 포함한 다양한 데이터 소스를 연결해 사용자 정의 대시보드를 만들고 실시간 그래프 및 지표를 시각적으로 표현할 수 있습니다.
🌊전체적인 흐름🌊
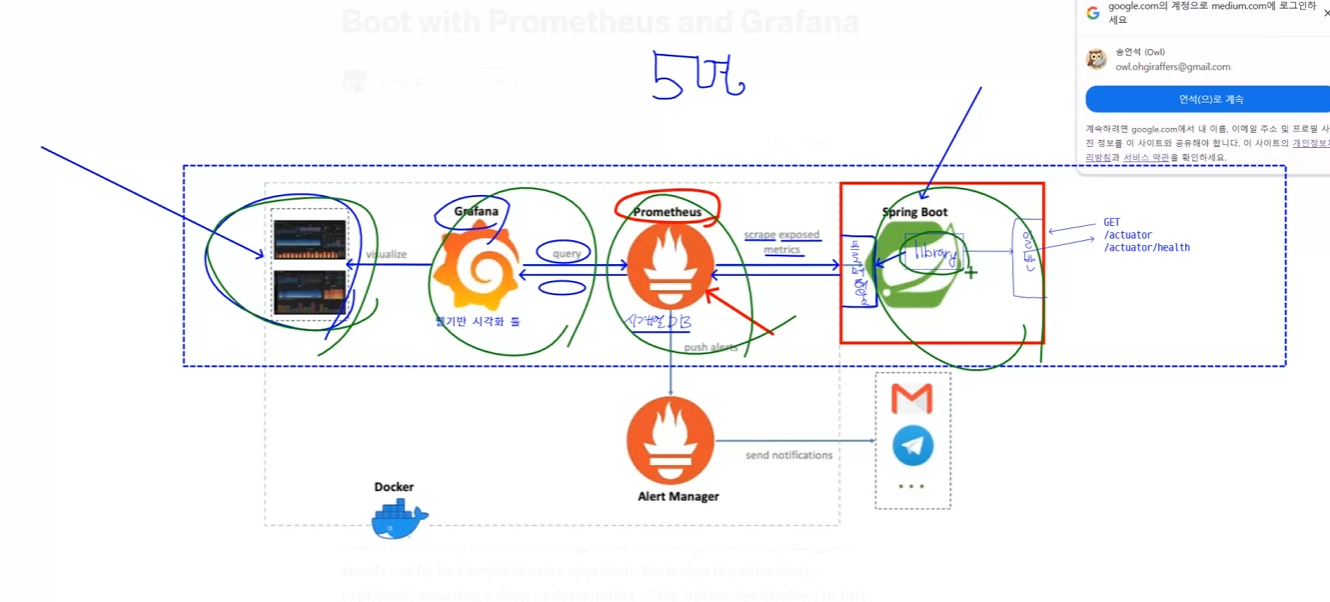
위는 강사님이 설명해주신 흐름을 간단히 정리한 구조도입니다.
- Spirng Boot는 /actuator/prometeus 경로로 상태를 노출합니다.
- Prometheus는 이를 주기적으로 수집하고 Grafana가 수집된 데이터를 기반으로 사용자가 시각적인 대시보드를 구성하고 조회할 수 있게 하는 흐름입니다.
🏗️빌드 과정🏗️
Prometheus 설치
-
우선 아래 링크에 들어가 프로메테우스를 설치 받습니다.
https://prometheus.io/download/
- 아래와 같은 의존성을 build.gradle에 추가 해줍니다.
implementation 'org.springframework.boot:spring-boot-starter-actuator' implementation 'io.micrometer:micrometer-registry-prometheus'-
그 후 git bash로 다운받은 프로메테우스가 있는 경로로 이동 후에
./prometheus.exe --config.file=prometheus.yml 명령어로 prometheus 서버를 실행하여줍니다.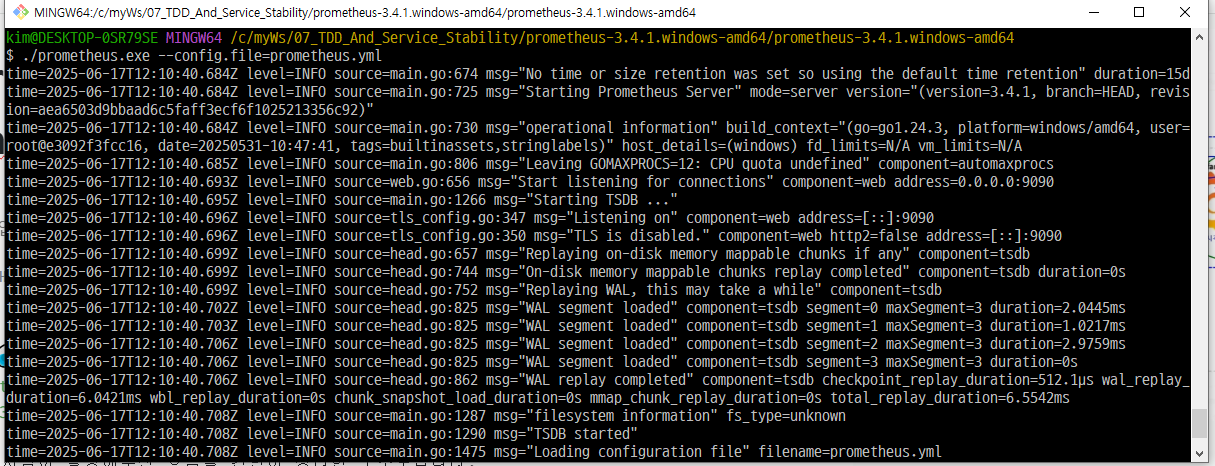
-
설치가 끝나면 http://localhost:9090 로 접속해봅니다.
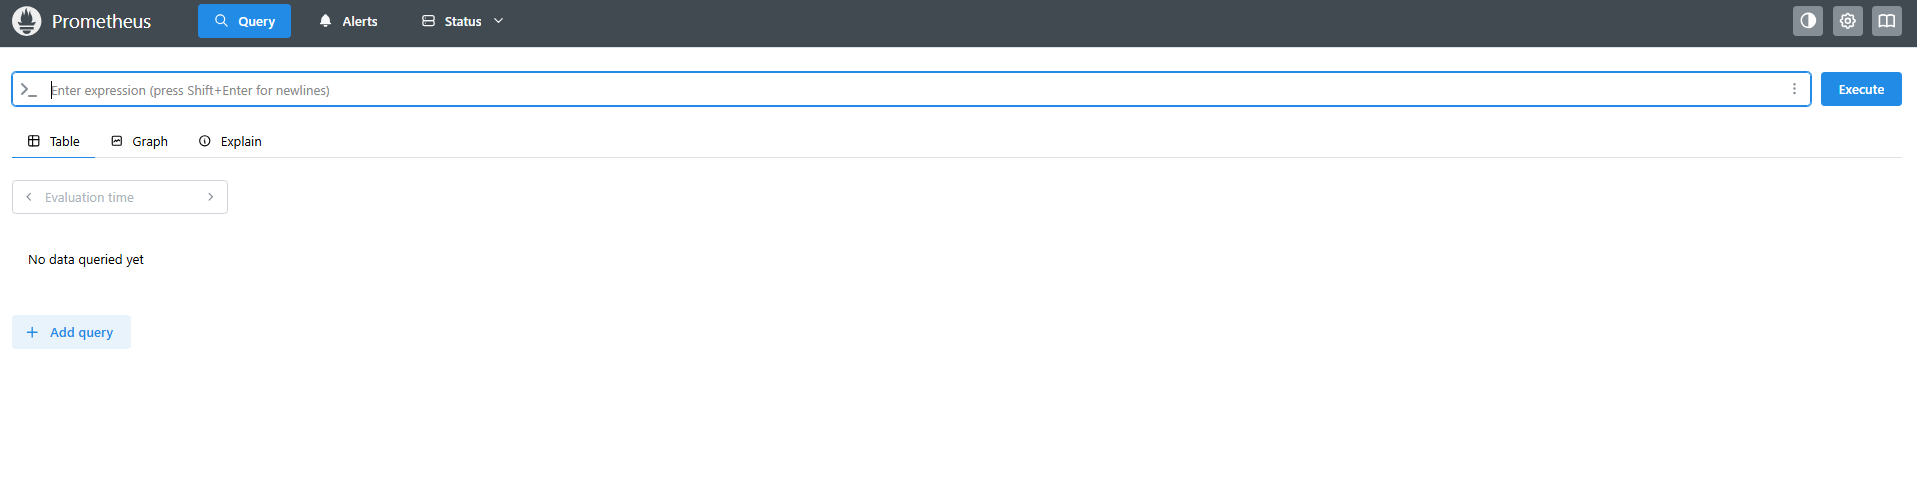
- 위와 같은 화면이 나온다면 OK
prometheus.yml 수정
- 다음으로 prometheus폴더에 prometheus.yml 파일을 수정하여 줍니다.
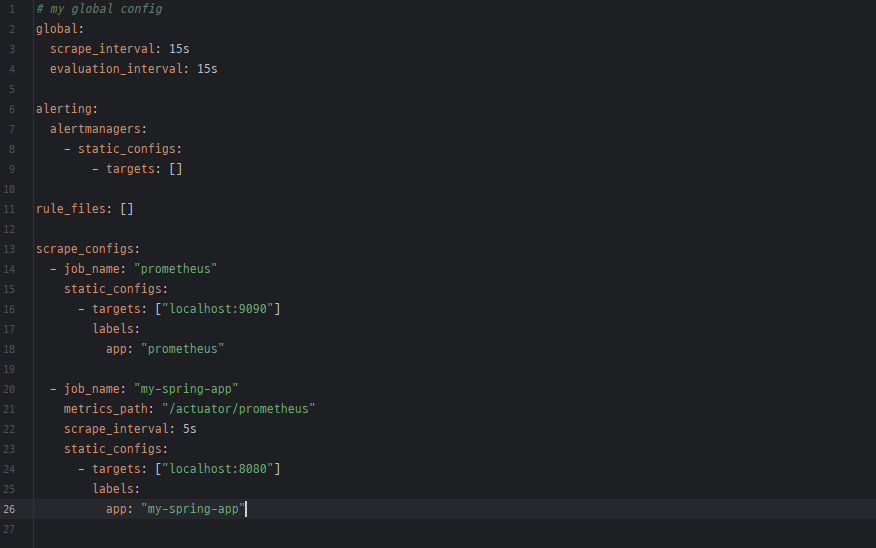
-
설정 후 prometheus 서버를 재가동 후에 http://localhost:9090/targets에 접속 시 아래와 같다면 OK
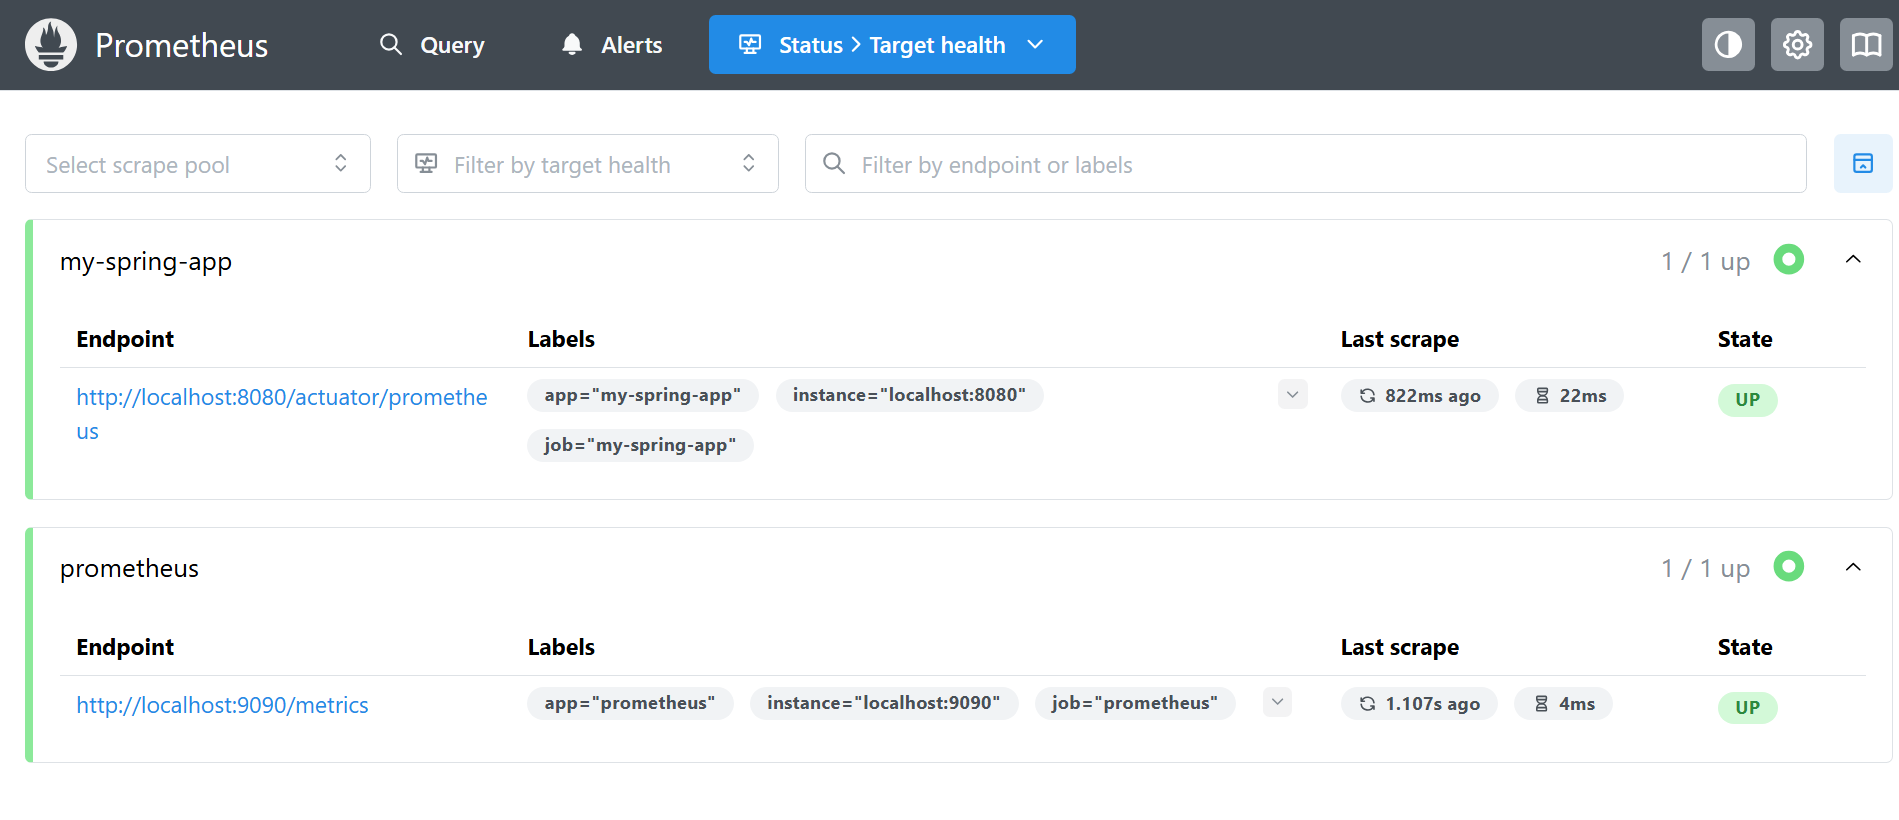
-
이제 prometheus는 OK입니다. 다음 GRAFANA로 넘어가겠습니다.
GRAFANA 설치
- 우선 아래 링크에서 그라파나를 다운받아줍니다.
https://grafana.com/grafana/download
- 그 후 http://localhost:3000 에 접속하여 그라파나로 들어가줍니다.
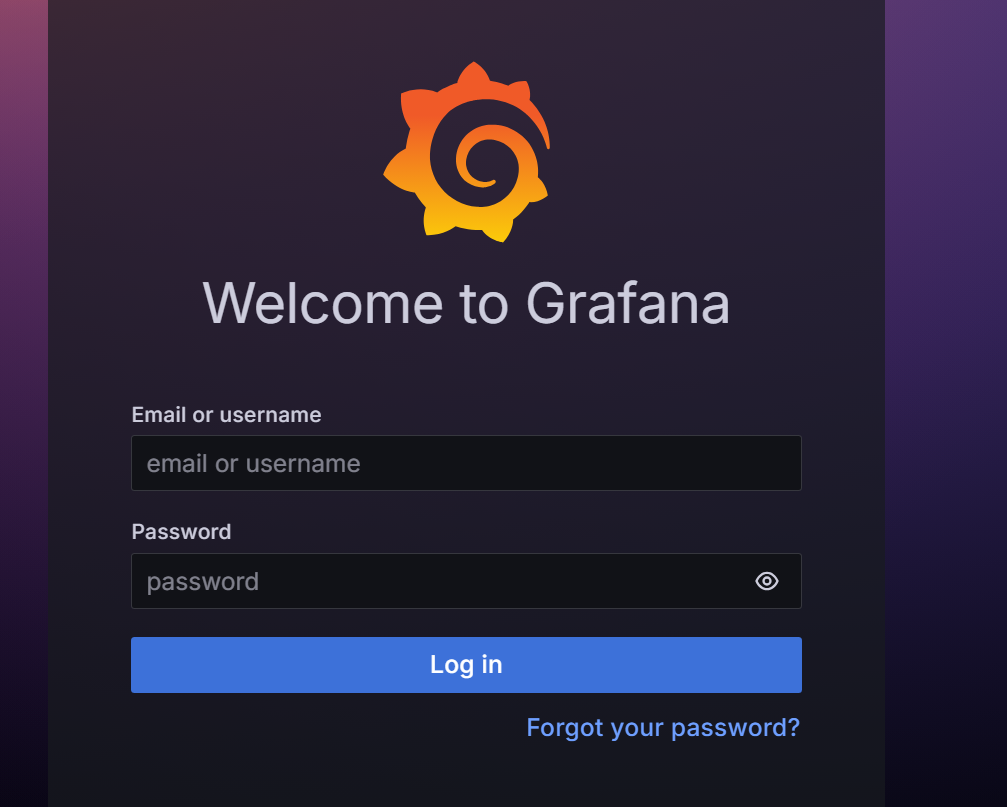
- 아이디, 비밀번호 모두 admin으로 입력 후 접속하여 줍니다.
설정 및 대시보드 확인
-
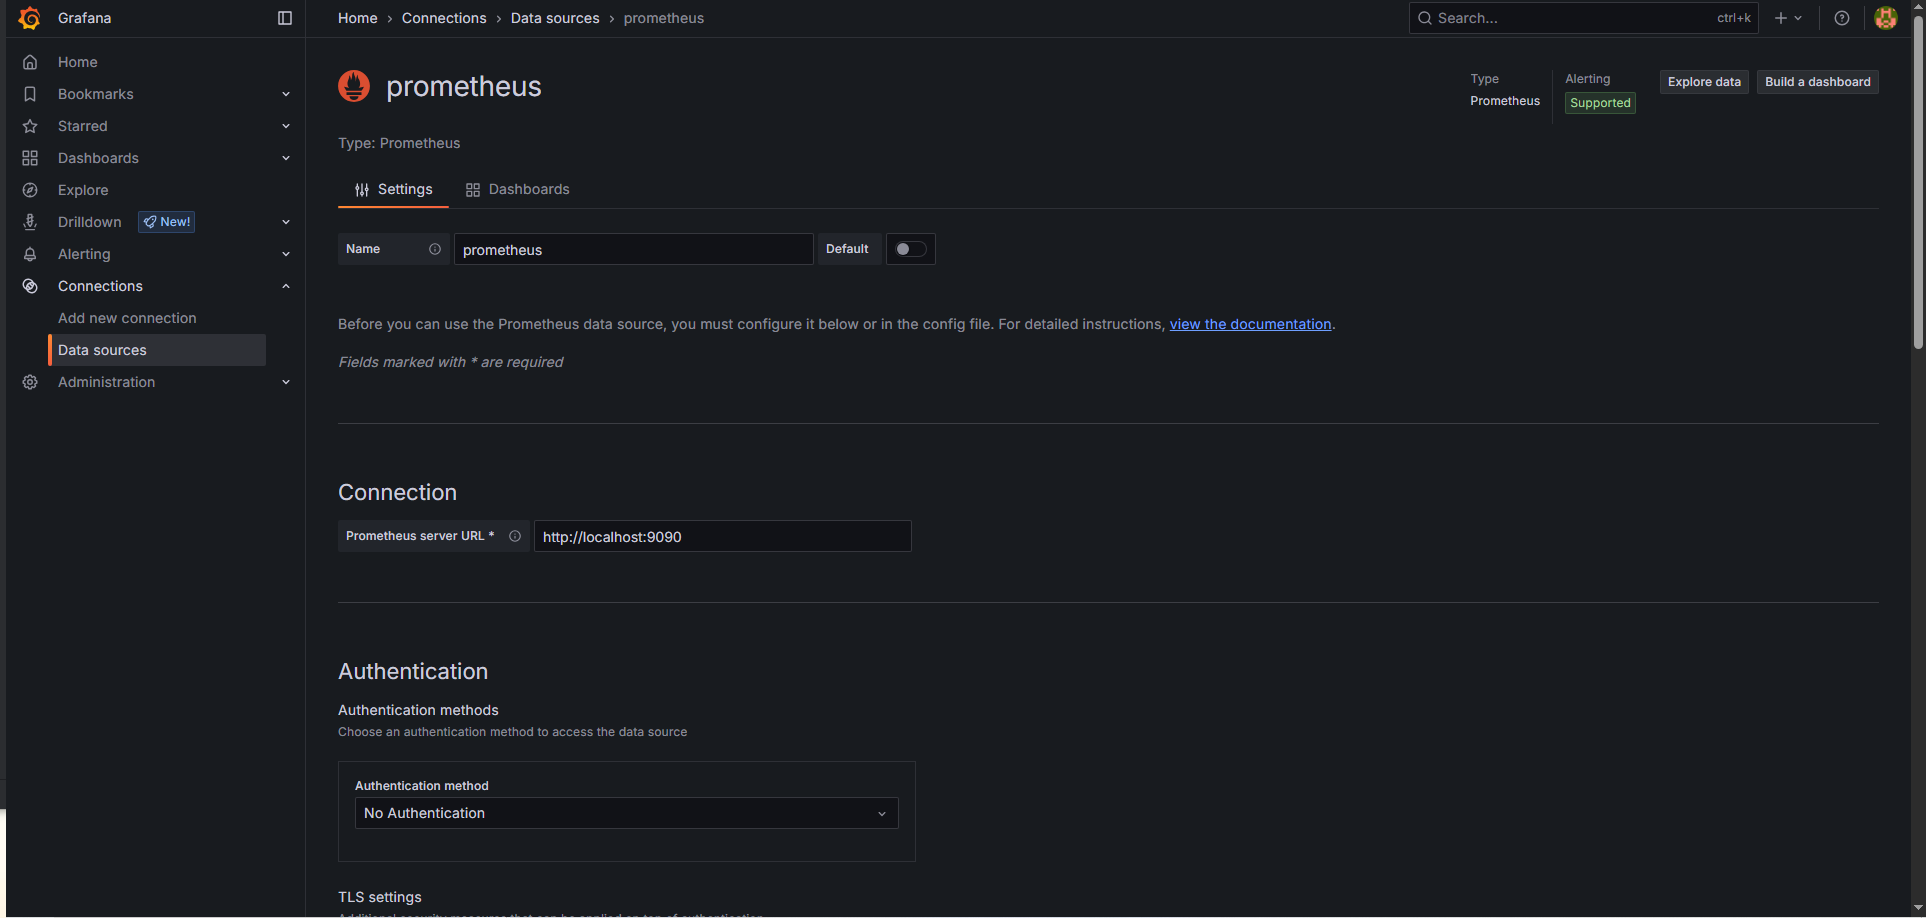
로그인하여 들어온 후에 좌측에 Connections > Add a new connection로 들어와 prometheus를 선택하여 줍니다.
-
다른 값을 모두 기본 값으로 두고 URL : http://localhost:9090으로 넣어준 후 저장하여 줍니다.
-
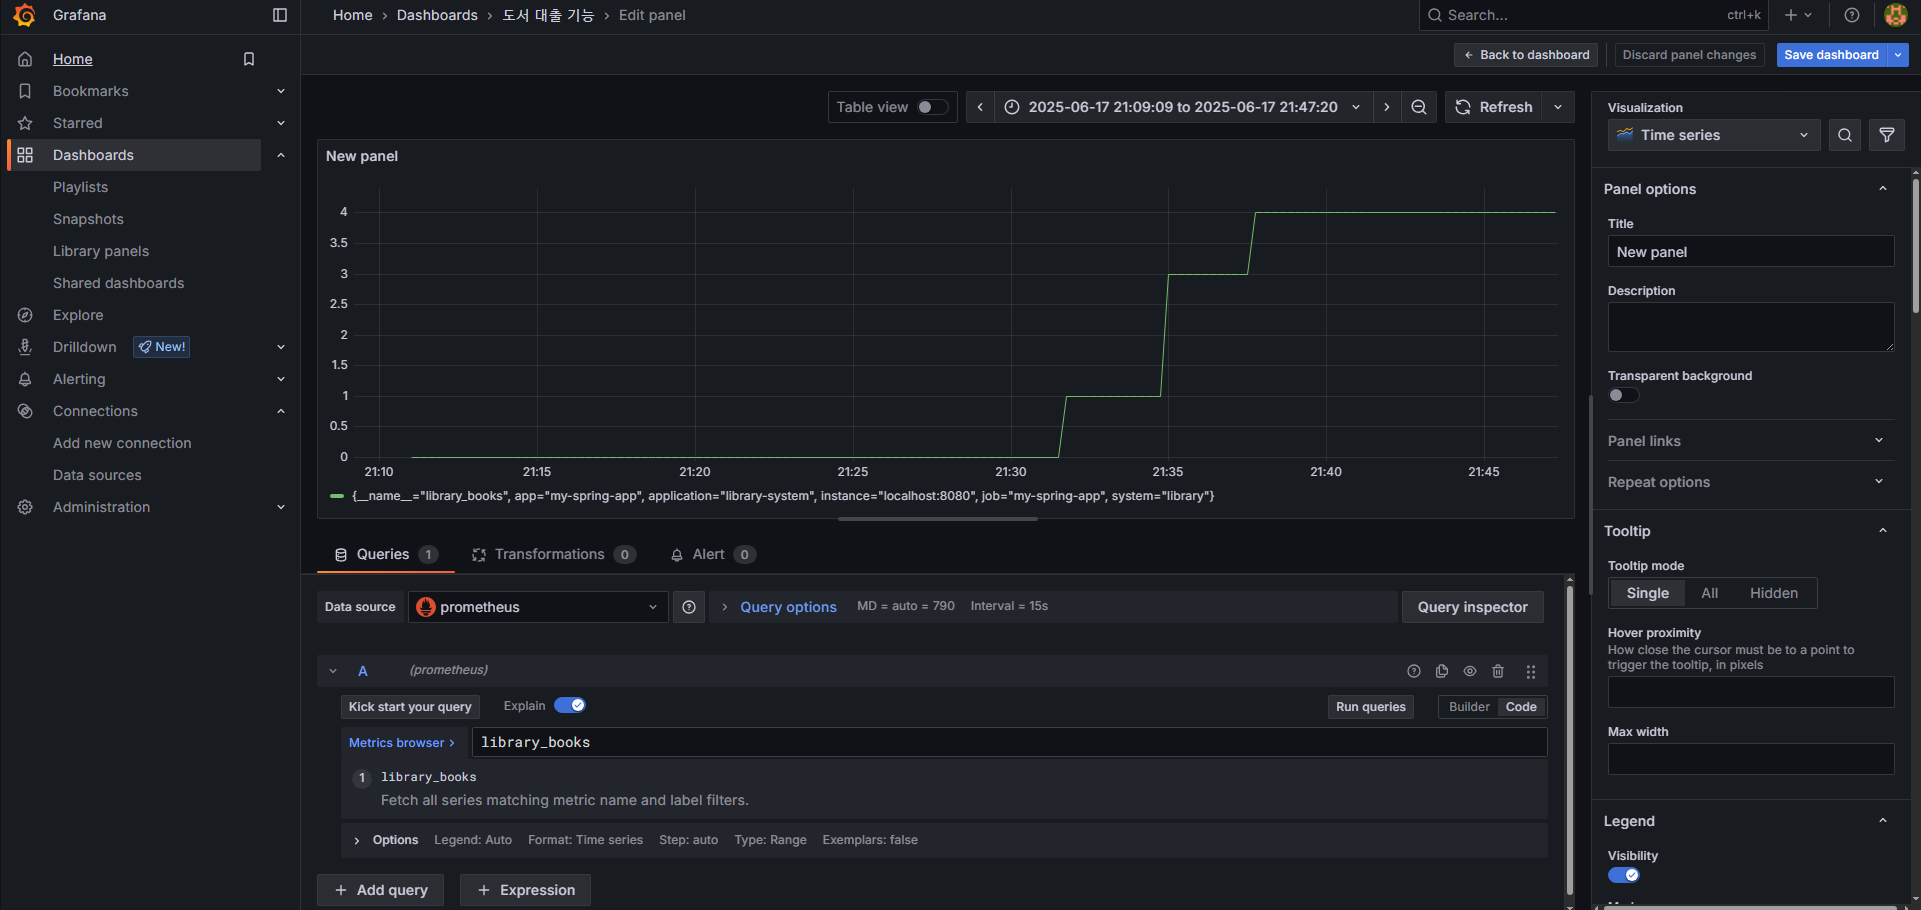
마지막으로 대시보드를 생성한 후에 보고 싶은 시각화 타입을 고르고 조회를 원하는 Metrics 필드를 선택한 후에 Run queries 버튼을 누르면 끝입니다.

- 아래는 책을 한권 더 추가한 그래프입니다.

좋은 글 잘 읽었습니다! 자세하게 설명되어 있어 좋네요