색상은 랜덤적용 안 하고 정성스럽게 하나씩 뽑아주기~
<div align="center" style="width: 700px;">
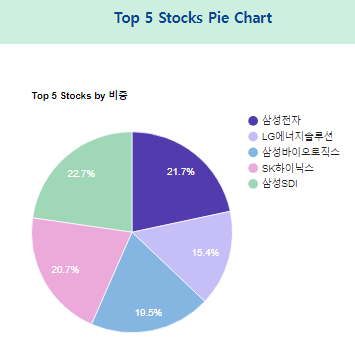
<h2>Top 5 Stocks Pie Chart</h2>
<div id="chart_div" style="width: 700px; height: 500px;"></div>
</div>
<script type="text/javascript" src="https://www.gstatic.com/charts/loader.js"></script>
<script type="text/javascript">
// Load the Visualization API and the corechart package.
google.charts.load('current', {'packages':['corechart']});
// Set a callback to run when the Google Visualization API is loaded.
google.charts.setOnLoadCallback(drawChart);
// Callback that creates and populates a data table,
// instantiates the pie chart, passes in the data and
// draws it.
function drawChart() {
// Create the data table.
var data = new google.visualization.DataTable();
data.addColumn('string', '종목명');
data.addColumn('number', '비중');
data.addRows([
<%
if (li != null) {
int count = 0;
for (StockVO m : li) {
if (count >= 5) break;
%>
['<%= m.getCol1() %>', <%= m.getCol2() %>],
<%
count++;
}
}
%>
]);
// Set chart options
var options = {
'title': 'Top 5 Stocks by 비중',
'width': 700,
'height': 500,
'slices': {
0: { color: '#dbd8f8' },
1: { color: '#c6bef7' },
2: { color: '#85B5E1' },
3: { color: '#ebaada' },
4: { color: '#9fd7b7' }
}
};
// Check for 삼성전자 and set its color specifically
for (var i = 0; i < data.getNumberOfRows(); i++) {
if (data.getValue(i, 0) === '삼성전자') {
options.slices[i] = { color: '#523bad' };
}
}
// Instantiate and draw our chart, passing in some options.
var chart = new google.visualization.PieChart(document.getElementById('chart_div'));
chart.draw(data, options);
}
</script>
기기 좋아하는 여자