Goal
matplotlib을 이해한다.
Update
지속적 업데이트 예정
[ 마지막 업데이트 ] 2022-01-08
수정, 개선이 필요할 경우 지적해주시면 감사하겠습니다.
1.matplotlib
기본구조
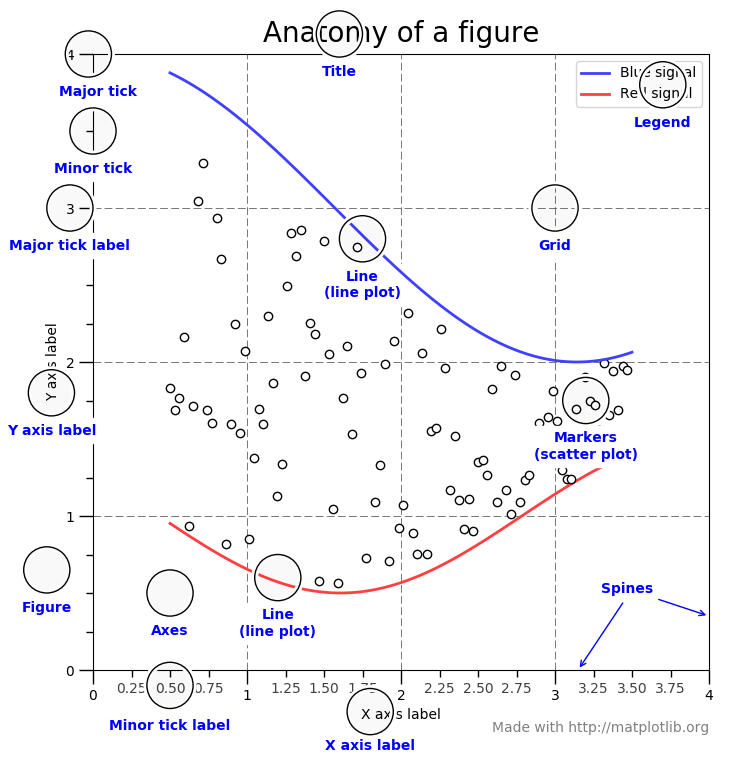
출처 : https://sosomemo.tistory.com/61, 소소메모(sosomemo)
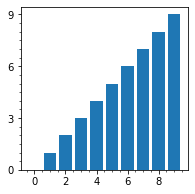
1-1 basic bar graph
1-1-1 code(2), output, explain
- #1 code
 1] plt.figure()
 2] 주눈금, 보조눈금 설정법
import matplotlib.pyplot as plt
import numpy as np

x = np.arange(10)
y = np.arange(10)

# plt.figure() :: 그래프를 그릴 틀 (도화지 정도로 이해)
plt.figure(figsize=(3,3))
# plt.axes() :: 실제로 그려질 그래프
ax = plt.axes()
'''
 	ax.xaxis.set_major_locator(ticker.MultipleLocator(2)) :: X축 주눈금의 간격 설정
	ax.yaxis.set_major_locator(ticker.MultipleLocator(3)) :: Y축 주눈금의 간격 설정
	ax.xaxis.set_minor_locator(ticker.MultipleLocator(0.5)) :: X축 보조눈금의 간격 설정
	ax.yaxis.set_minor_locator(ticker.MultipleLocator(0.5)) :: Y축 보조눈금의 간격 설정
'''
ax.xaxis.set_major_locator(ticker.MultipleLocator(2))
ax.yaxis.set_major_locator(ticker.MultipleLocator(3))
ax.xaxis.set_minor_locator(ticker.MultipleLocator(0.5))
ax.yaxis.set_minor_locator(ticker.MultipleLocator(0.5))
plt.bar(x, y)

plt.show()- #2 code
 1] fig = plt.figure()
 2] 주눈금, 보조눈금 설정법
import matplotlib.pyplot as plt
import numpy as np
import matplotlib.ticker as ticker
x = np.arange(10)
y = np.arange(10)
# plt.figure() :: 그래프를 그릴 틀 (도화지 정도로 이해)
fig = plt.figure()
# plt.axes() :: 실제로 그려질 그래프
ax = fig.add_subplot(1,1,1)
'''
ax.xaxis.set_major_locator(ticker.MultipleLocator(2)) :: X축 주눈금의 간격 설정
ax.yaxis.set_major_locator(ticker.MultipleLocator(3)) :: Y축 주눈금의 간격 설정
ax.xaxis.set_minor_locator(ticker.MultipleLocator(0.5)) :: X축 보조눈금의 간격 설정
ax.yaxis.set_minor_locator(ticker.MultipleLocator(0.5)) :: Y축 보조눈금의 간격 설정
'''
ax.xaxis.set_major_locator(ticker.MultipleLocator(2))
ax.yaxis.set_major_locator(ticker.MultipleLocator(3))
ax.xaxis.set_minor_locator(ticker.MultipleLocator(0.5))
ax.yaxis.set_minor_locator(ticker.MultipleLocator(0.5))
plt.bar(x, y)
plt.show()- #1, #2 output
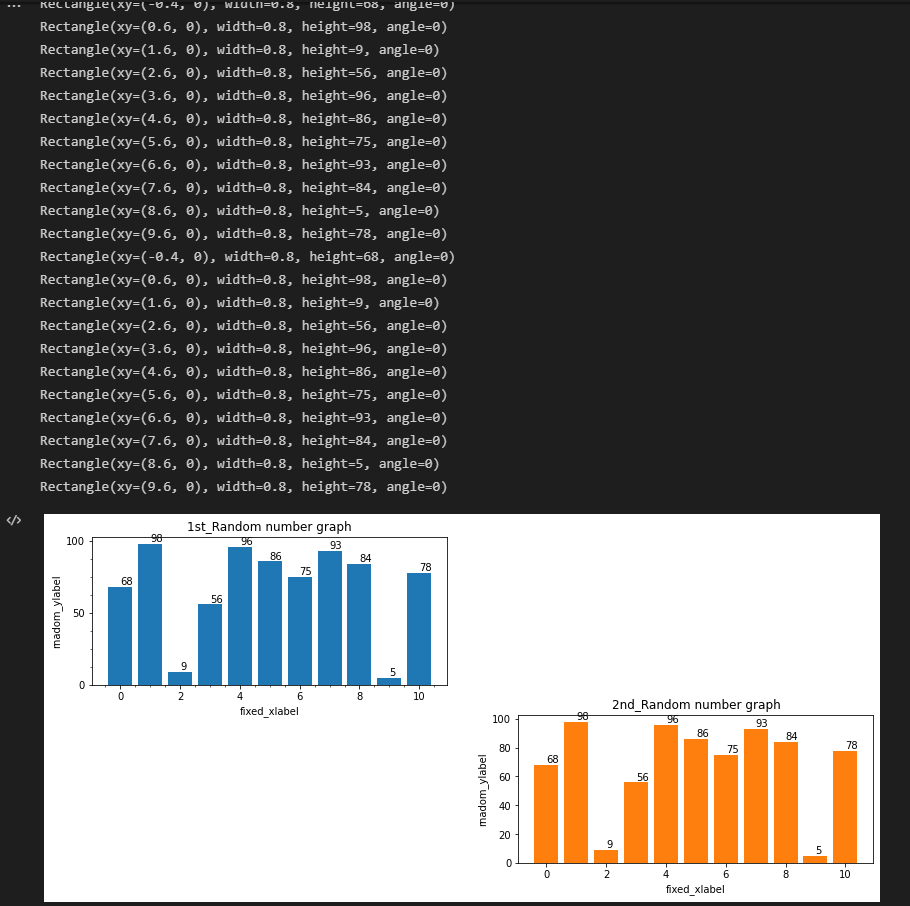
1-1-2 응용하기
 1] Display multiple plots in one figure (2 row & 2 columns)
2] ax_221과 ax_224 주눈금, 보조눈금 비교- #1 code
import matplotlib.pyplot as plt
import numpy as np
import matplotlib.ticker as ticker


x = np.arange(10)
y = np.random.randint(11, size=10)

# plt.figure() :: 그래프를 그릴 틀 (도화지 정도로 이해)
fig = plt.figure(figsize=(14, 6))
# plt.subplot() :: 실제로 그려질 그래프
ax_221 = fig.add_subplot(2, 2, 1)
ax_221.xaxis.set_major_locator(ticker.MultipleLocator(2)) # X축 주눈금의 간격 설정
ax_221.yaxis.set_major_locator(ticker.MultipleLocator(3)) # Y축 주눈금의 간격 설정
ax_221.xaxis.set_minor_locator(ticker.MultipleLocator(0.5)) # X축 보조눈금의 간격 설정
ax_221.yaxis.set_minor_locator(ticker.MultipleLocator(0.5)) # Y축 보조눈금의 간격 설정

barplot = plt.bar(x, y) # ax_221
for bar in barplot:
	'''
		bar의 값 명시
			Rectangle of plt.bar :: https://matplotlib.org/stable/api/_as_gen/matplotlib.patches.Rectangle.html?highlight=rectangle#matplotlib.patches.Rectangle
	'''
	print(bar)
	xval = bar.get_x() + bar.get_width() / 2.0
	yval = bar.get_height()
	plt.text(xval, yval, int(yval), va="bottom")

ax_224 = fig.add_subplot(2, 2, 4)
plt.bar(x, y)


barplot = plt.bar(x, y) # ax_224
for bar in barplot:
	'''
	bar의 값 명시
		Rectangle of plt.bar :: https://matplotlib.org/stable/api/_as_gen/matplotlib.patches.Rectangle.html?highlight=rectangle#matplotlib.patches.Rectangle
	'''
	print(bar)
	xval = bar.get_x() + bar.get_width() / 2.0
	yval = bar.get_height()
	plt.text(xval, yval, int(yval), va="bottom")

plt.title("Random number graph")
plt.xlabel("fixed_xlabel")
plt.ylabel("rnadom_ylabel")


plt.show()- #1 output

e-mail :: 업데이트 예정